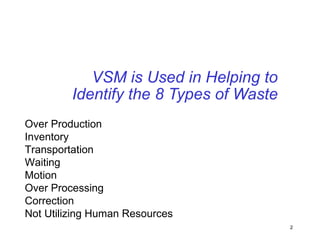
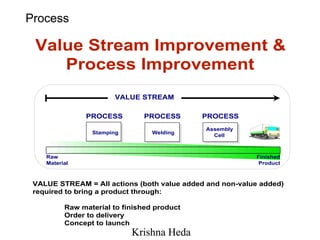
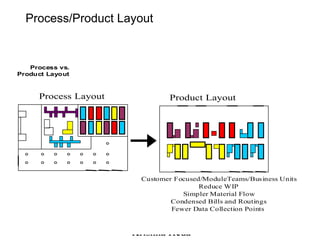
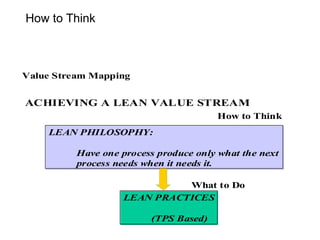
SlideShare a Scribd company logo
1 of 64
Presented By- Krishna Heda Value Stream Mapping
VSM is Used in Helping to Identify the 8 Types of Waste Over Production Inventory Transportation Waiting Motion Over Processing Correction Not Utilizing Human Resources
To be successful, a  Total System Strategy  must be employed.  The Total System Strategy is facilitated by committed leadership, knowledge, an effective planning process and a bias towards action.  Total System Strategy Flow Flow Operational Availability Workplace Organization Material Movement Employee  Environment  & Involvement Quality Flow Manufacturing (MSD) Waste Elimination Leadership Planning  Knowledge  Action  Flow Flow
Objectives ,[object Object],[object Object],[object Object]
Objectives Why Map the Value Stream?
[object Object],[object Object],[object Object],[object Object],[object Object],[object Object],[object Object],[object Object],[object Object],[object Object],Agenda Session 1 Session 2
[object Object],[object Object],[object Object],[object Object],Agenda - Session 1
Current State
Process
Introduction to Value Stream Mapping A  Value Stream  includes all elements (both value and non-value added) that occur to a given product from its inception as a raw material through delivery to the customer. Definition of Value Stream
Value Added & Non-Value Added
Waste
[object Object],[object Object],[object Object],[object Object],Objectives of Value Stream Mapping Eliminate  Waste Introduction to Value Stream Mapping
Definition of VSM What is Lean? “More with Less” or “Less with Less” Less Downtime of Equipment Less Inventory Less waste of Materials Less waste of Supplies Less “Non Value Added” Less Scrap Less Rework Less Absenteeism Less Injuries Less Lead-time Less Errors in Production
Indications of Opportunities EMPLOYEE SYMPTOMS *  Frustration *  Low Morale *  Absenteeism *  Negativism *  “It’s Not My Job” EXTERNAL INDICATORS *  Warranty Costs *  Negative Publicity *  Pricing Inflexibility *  Market Share Drop
Value Stream Mapping
Attribute Data to Collect Data Collection ,[object Object],[object Object],[object Object],[object Object],[object Object],[object Object],[object Object],[object Object],[object Object],[object Object],[object Object],[object Object],[object Object],[object Object],[object Object],[object Object]
[object Object],[object Object],[object Object],[object Object],Data Collection
Identify Opportunities for Improvement ? Data Collection
[object Object],[object Object],[object Object],[object Object],Agenda - Session 1
Map Current State The Steps Select a Product Family Form a Team Understand Customer Demand Map the Process Flow Map the Material Flow Map the Information Flow Calculate Total Product Cycle Time Detail Off-Line Activities Step 1: Step 2: Step 3: Step 4: Step 5: Step 6: Step 7: Step 8:
Tools Introduction to Value Stream Mapping Scrap Manufacturing  Process Kaizen  Lightning  Burst Outside Source/ Customer Data Box Inventory I o  o o Truck Shipment Finished Goods to Customer Push Arrow Supermarket Buffer or Safety Stock Manual  Information Flow Electronic Information Flow Production Kanban Withdrawal Kanban Signal Kanban Kanban Post
[object Object],[object Object],[object Object],[object Object],[object Object],[object Object],[object Object],Map Current State Step 1:  Select a Value Stream (Product Family)
[object Object],[object Object],[object Object],[object Object],Current State Step 2:  Form a Team  Cross Functional Team Manufacturing PC & L Maintenance Leadership Product Engineering Industrial Engineering Sensei
[object Object],[object Object],[object Object],[object Object],[object Object],Map Current State Step 3:  Understand Customer Demand Customer Demand/month: Part A = Part B = Part C = # of shifts =
Customer Map Current State Step 4:  Map the Process Flow Demand/month: Part A = Part B = Part C = # of shifts = Inventory Part A = Part B = Part C = # of shifts = Shipping Assembly Welding Stamping Takt = C.T. = D.T. = FTQ = 90% C/O Time = Lot Size = # of Shifts WIP = Takt = C.T. = D.T. = 20% FTQ = C/O Time = Lot Size = # of Shifts WIP = Takt = C.T. = D.T. =  FTQ = C/O Time = 4 hrs. Lot Size = # of Shifts WIP = Changeover Downtime FTQ
Map Current State Step 6:  Map the Information Flow Customer Demand/month: Part A = 705 pcs. Part B = 600 pcs. Part C = 1650 pcs. # of shifts = Inventory Part A = 750 pcs Part B = 600 pcs Part C = 1650 pcs # of shifts = Shipping Assembly Welding Stamping Takt = C.T. = D.T. = FTQ = 90% C/O Time = Lot Size = # of Shifts WIP = 550 pcs. Takt = C.T. = D.T. = 20% FTQ = C/O Time = Lot Size = # of Shifts WIP = 60 pcs. Takt = C.T. = D.T. =  FTQ = C/O Time = 4 hrs. Lot Size = # of Shifts WIP = 25 pcs. Changeover Downtime FTQ I I I I 2 x/ day 2 x/ week Supplier 1,200 pcs 1,500 pcs 800 pcs 500 pcs PC & L Weekly Build Schedule Daily Ship Schedule 6 week rolling forecast 6 week rolling forecast Weekly Order Weekly Order
Map Current State Step 7:  Calculate Total Product Cycle Time Customer Demand/month: Part A = 705 pcs. Part B = 600 pcs. Part C = 1650 pcs. # of shifts = Inventory Part A = 750 pcs Part B = 600 pcs Part C = 1650 pcs # of shifts = Shipping Assembly Welding Stamping Takt = C.T. = D.T. = FTQ = 90% C/O Time = Lot Size = # of Shifts WIP = 550 pcs. Takt = C.T. = D.T. = 20% FTQ = C/O Time = Lot Size = # of Shifts WIP = 60 pcs. Takt = C.T. = D.T. =  FTQ = C/O Time = 4 hrs. Lot Size = # of Shifts WIP = 25 pcs. Changeover Downtime FTQ I I I I 2 x/ day 2 x/ week Supplier 1,200 pcs 1,500 pcs 800 pcs 500 pcs PC & L Weekly Build Schedule Daily Ship Schedule 6 week rolling forecast 6 week rolling forecast Weekly Order Weekly Order .27 days .17 days .4 days .5 days 1.0 days .18 days .02 days .008 days TPc/t = 2.5 days
Current State
Step 8:  Detail Off-Line Activities Map Current State ,[object Object],[object Object],I Dies Die Room Receiving Die Room Shipping (Remove from Schedule Board) Die Bench I Dies 2 shifts 12 shifts Schedule Board (Forecast) Fork Truck Press Room
[object Object],[object Object],[object Object],[object Object],Agenda - Session 1
Activity:  Map the Current State Complete By Task Approximate Total Time: ,[object Object],[object Object],[object Object],[object Object]
[object Object],[object Object],[object Object],[object Object],[object Object],[object Object],[object Object],[object Object],[object Object],[object Object],Agenda Session 1 Session 2
[object Object],[object Object],[object Object],[object Object],[object Object],[object Object],Agenda - Session 2
[object Object],[object Object],Design Future State - Purpose Purpose
Process/Product Layout
How to Think
Efficiency
[object Object],[object Object],[object Object],[object Object],[object Object],[object Object],Agenda - Session 2
Guidelines to Future State
Achieving The Future State
Pacemaker Loop
Identify the Pacemaker
Where will you need to use supermarket pull systems to control production of upstream processes? What is Takt Time? Will you build to a finished goods supermarket or directly to shipping? Where can you use continuous flow processing? At what single point in the production chain will you schedule production? (Typically, this will be the final process.) How will you level the production mix at the pacemaker process? What increment of work will you consistently release and take away at the pacemaker process? What process improvements will be necessary at the value stream to flow as your future state design specifies? Consider Key Questions
Develop A Plan
Future State
Map Future State Step 1: Step 2: Step 3: Step 4: Step 5: Step 6: Step 7: The Steps Validate Customer Demand Draw the Future State Process Flow Map the Future State Material Flow Map the Future State Information Flow Calculate Total Product Cycle Time Detail Off-Line Activities Outline a Plan A simple way to approach the Future State Map is to begin by modifying the Current State Map.
Map Future State Customer demand should be validated to ensure accuracy and that consideration has been given for future business.  Step 1:  Validate Customer Demand X pcs / month Std Pack Qty # Shifts Customer
Map Future State Finished Goods Assembly Layout Welding Stamping X pcs / month Std Pack Qty # Shifts C/O Time = CT = TAKT Time 3 Shifts DT = Scrap = 0 Overtime 2 Shifts Max Size # Material Handlers C/O Time = CT = TAKT Time 3 Shifts DT = Scrap/Rework = C/O Time = CT = TAKT Time 3 Shifts DT = Scrap/Rework= Small Lot # Operators WIP = WIP = WIP = Customer Step 2:  Draw the Future State Process Flow List the items needed for  lean process flow
Map Future State Finished Goods Assembly Layout Welding 6 x / Day Daily Stamping X pcs / month Std Pack Qty # Shifts C/O Time = CT = TAKT Time 3 Shifts DT = Scrap = 0 Overtime 2 Shifts Max Size # Material Handlers C/O Time = CT = TAKT Time 3 Shifts DT = Scrap/Rework = C/O Time = CT = TAKT Time 3 Shifts DT = Scrap/Rework= Small Lot # Operators WIP = WIP = WIP = Customer Steel Supplier Step 3:  Draw the Future State Material Flow
Map Future State Rolling 6 wk Forecast Finished Goods Assembly Layout Welding 6 x / Day PC & L 6-wk forecast Daily Level Box DA1 DA2 DA3 Stamping X pcs / month Std Pack Qty # Shifts Weekly Order C/O Time = CT = TAKT Time 3 Shifts DT = Scrap = 0 Overtime 2 Shifts Max Size # Material Handlers C/O Time = CT = TAKT Time 3 Shifts DT = Scrap/Rework = C/O Time = CT = TAKT Time 3 Shifts DT = Scrap/Rework= Small Lot # Operators WIP = WIP = WIP = Customer Step 4:  Draw the Future State Informational Flow Steel Supplier
Step 5:  Calculate Total Product Cycle Time (TP c/t) Map Future State Rolling 6 wk Forecast Finished Goods Assembly Layout Welding 6 x / Day PC & L 6-wk forecast Daily Level Box DA1 DA2 DA3 Stamping X pcs / month Std Pack Qty # Shifts Weekly Order C/O Time = CT = TAKT Time 3 Shifts DT = Scrap = 0 Overtime 2 Shifts Max Size # Material Handlers C/O Time = CT = TAKT Time 3 Shifts DT = Scrap/Rework = C/O Time = CT = TAKT Time 3 Shifts DT = Scrap/Rework= Small Lot # Operators WIP = WIP = WIP = Inv .Time Proc .Time TPc /t = ? ? days ? days ? days ? days ? days ? days ? days Customer Steel Supplier
Step 6:  Detail Off-Line Activities Map Future State ,[object Object],[object Object]
Original Condition Step7:  Outline a Plan Map Future State Future Condition Inj: Molding 2 Sender Ass’y 2 MSS Ass’y Plants 7 Stamping 10 Tank Ass’y 4 Perform to TAKT & Pitch. Produce to Order Load Leveling and Pull Zone Maintenance & Fast Response Labels Level ABABA. . . Staging by Truck card by card (Pitch = 14 Units) 1ST 2ND 3RD 4TH 1ST 2ND 3RD 4TH Establish TAKT & Flow in Tank Ass'y Stamping Changeover Reduction Reduce Stamping Buffer Move Ass'y to Plant 10 Establish TAKT & Flow in Sender Ass'y Pull To Sender Ass'y Training 1999 2000 Activity Inj: Molding 2 Sender Ass’y 2 MSS Tank Ass’y Stamping Fuel Pump Ass’y I I I I I I Ass’y Plants 2 12 10 4 Cycle-Time Driven. Batches. Change Over Change Over No Flow Attendance No Flow Uptime Item Current Target Total  product cycle time Parts / Person Hour Delivery Performance Inventory (days) Overtime Uptime METRICS
Linkage to Improvement Workplace Organization 5S Deploy Visual Controls Layout Waste free - Eliminate waste thru Continuous Improvement Deploy and maintain appropriate Kanbans Uninterrupted flow Error Free Processing Insignificant Changeover
[object Object],[object Object],[object Object],[object Object],[object Object],[object Object],Agenda - Session 2
[object Object],[object Object],What process improvement are necessary for the  value stream to flow as your future state design specifies? This step is key to any successful value stream improvement activities. Consider Key Questions This is the step where we can most impact the bottom line.
Eliminate Waste Consider Key Questions Flow Manufacturing 1 Piece Flow,  Employee Involvement Empowered, Continuous Imp.  Workplace Organization Std. Work, 5S, EH&S Quality RRCA,  Process Certification Roadmap Operational SMED, TPM, MP  Material Movement FIFO, Pull System
[object Object],[object Object],[object Object],[object Object],[object Object],[object Object],Agenda - Session 2
Summary Getting Started Be Wise… Observe…it is necessary to physically observe the value stream.  This provides the greatest opportunity to identify and eliminate waste. Be Persistent... Value stream mapping is an iterative process. Todays future state is tomorrows current state.  This is what continuous improvement is all about.
Is the Time NOW
Achieving the Future State
Activity:  Design Future State Task ,[object Object],[object Object],[object Object],Approximate Total Time:
Activity:  Map the Future State Complete By Task Approximate Total Time: ,[object Object],[object Object],[object Object],[object Object],[object Object]

More Related Content

What's hot

Value Stream Mapping: Case Studies
Value Stream Mapping: Case StudiesValue Stream Mapping: Case Studies
Value Stream Mapping: Case StudiesTKMG, Inc.
 
Value Stream Mapping
Value Stream MappingValue Stream Mapping
Value Stream MappingTKMG, Inc.
 
Lean manufacturing basics
Lean manufacturing basicsLean manufacturing basics
Lean manufacturing basicssarah bridge
 
Lean manufacturing overview
Lean manufacturing overviewLean manufacturing overview
Lean manufacturing overviewPruek Pinyo
 
Tps and lean manufacturing
Tps and lean manufacturingTps and lean manufacturing
Tps and lean manufacturingAdeel Javaid
 
Lean Manufacturing : Concept & Overview nkchawla@gmail.com
Lean Manufacturing : Concept & Overview nkchawla@gmail.comLean Manufacturing : Concept & Overview nkchawla@gmail.com
Lean Manufacturing : Concept & Overview nkchawla@gmail.comNareshChawla
 
Kaizen Events Blitz & Lean Projects
Kaizen Events   Blitz  & Lean ProjectsKaizen Events   Blitz  & Lean Projects
Kaizen Events Blitz & Lean ProjectsAnand Subramaniam
 
Logistics WCM Presentation Final - Converted (2)
Logistics WCM Presentation Final - Converted (2)Logistics WCM Presentation Final - Converted (2)
Logistics WCM Presentation Final - Converted (2)Ashley Smith
 
Lean Transformation ~ A Journey
Lean Transformation ~ A JourneyLean Transformation ~ A Journey
Lean Transformation ~ A JourneyAnand Subramaniam
 
Value stream mapping (1)
Value stream mapping (1)Value stream mapping (1)
Value stream mapping (1)jmachado33
 
VSM - Value Stream Mapping for made-to-order manufacturing
VSM - Value Stream Mapping for made-to-order manufacturingVSM - Value Stream Mapping for made-to-order manufacturing
VSM - Value Stream Mapping for made-to-order manufacturingJessica Mitchell
 
Value Stream Mapping Project Template by Operational Excellence Consulting
Value Stream Mapping Project Template by Operational Excellence ConsultingValue Stream Mapping Project Template by Operational Excellence Consulting
Value Stream Mapping Project Template by Operational Excellence ConsultingOperational Excellence Consulting
 
Applications of lean manufacturing tools
Applications of lean manufacturing toolsApplications of lean manufacturing tools
Applications of lean manufacturing toolsIshmam Ahmed
 

What's hot (20)

Lean Manufacturing Training
Lean Manufacturing TrainingLean Manufacturing Training
Lean Manufacturing Training
 
Value Stream Mapping: Case Studies
Value Stream Mapping: Case StudiesValue Stream Mapping: Case Studies
Value Stream Mapping: Case Studies
 
Value Stream Mapping
Value Stream MappingValue Stream Mapping
Value Stream Mapping
 
Lean manufacturing basics
Lean manufacturing basicsLean manufacturing basics
Lean manufacturing basics
 
Lean manufacturing overview
Lean manufacturing overviewLean manufacturing overview
Lean manufacturing overview
 
Tps and lean manufacturing
Tps and lean manufacturingTps and lean manufacturing
Tps and lean manufacturing
 
Lean Manufacturing : Concept & Overview nkchawla@gmail.com
Lean Manufacturing : Concept & Overview nkchawla@gmail.comLean Manufacturing : Concept & Overview nkchawla@gmail.com
Lean Manufacturing : Concept & Overview nkchawla@gmail.com
 
Kaizen Events Blitz & Lean Projects
Kaizen Events   Blitz  & Lean ProjectsKaizen Events   Blitz  & Lean Projects
Kaizen Events Blitz & Lean Projects
 
Spaghetti Diagrams
Spaghetti DiagramsSpaghetti Diagrams
Spaghetti Diagrams
 
Lean Manufacturing
Lean ManufacturingLean Manufacturing
Lean Manufacturing
 
Logistics WCM Presentation Final - Converted (2)
Logistics WCM Presentation Final - Converted (2)Logistics WCM Presentation Final - Converted (2)
Logistics WCM Presentation Final - Converted (2)
 
Introduction To Lean
Introduction To LeanIntroduction To Lean
Introduction To Lean
 
LEAN MANUFACTURING USES
LEAN MANUFACTURING USESLEAN MANUFACTURING USES
LEAN MANUFACTURING USES
 
Lean Transformation ~ A Journey
Lean Transformation ~ A JourneyLean Transformation ~ A Journey
Lean Transformation ~ A Journey
 
Value stream mapping (1)
Value stream mapping (1)Value stream mapping (1)
Value stream mapping (1)
 
Lean basics
Lean basicsLean basics
Lean basics
 
Lean Manufacturing
Lean ManufacturingLean Manufacturing
Lean Manufacturing
 
VSM - Value Stream Mapping for made-to-order manufacturing
VSM - Value Stream Mapping for made-to-order manufacturingVSM - Value Stream Mapping for made-to-order manufacturing
VSM - Value Stream Mapping for made-to-order manufacturing
 
Value Stream Mapping Project Template by Operational Excellence Consulting
Value Stream Mapping Project Template by Operational Excellence ConsultingValue Stream Mapping Project Template by Operational Excellence Consulting
Value Stream Mapping Project Template by Operational Excellence Consulting
 
Applications of lean manufacturing tools
Applications of lean manufacturing toolsApplications of lean manufacturing tools
Applications of lean manufacturing tools
 

Viewers also liked

Types of waste - lean Concept Krishna Heda
Types of waste - lean Concept Krishna HedaTypes of waste - lean Concept Krishna Heda
Types of waste - lean Concept Krishna Hedakrishnaheda
 
How to Use VSM Correctly
How to Use VSM CorrectlyHow to Use VSM Correctly
How to Use VSM CorrectlyMike Rother
 
Value stream mapping training
Value stream mapping trainingValue stream mapping training
Value stream mapping trainingJusto Castellon
 
Value Stream Mapping - Strategy Before Tactics
Value Stream Mapping - Strategy Before TacticsValue Stream Mapping - Strategy Before Tactics
Value Stream Mapping - Strategy Before TacticsTKMG, Inc.
 
Value Stream Mapping Overview Update
Value Stream Mapping Overview UpdateValue Stream Mapping Overview Update
Value Stream Mapping Overview Updatejheaton418
 
Triz - Indepth Knowledge - Krishna Heda
Triz - Indepth Knowledge -  Krishna HedaTriz - Indepth Knowledge -  Krishna Heda
Triz - Indepth Knowledge - Krishna Hedakrishnaheda
 
5s training slides_432
5s training slides_4325s training slides_432
5s training slides_432Mahesh Kumar
 
M shop pres_updated_2_2012
M shop pres_updated_2_2012M shop pres_updated_2_2012
M shop pres_updated_2_2012stacey_goulding
 
Application of value stream mapping for reduction of cycle time in machining ...
Application of value stream mapping for reduction of cycle time in machining ...Application of value stream mapping for reduction of cycle time in machining ...
Application of value stream mapping for reduction of cycle time in machining ...Sumit Bhattacharya
 
Insuring Lean Operations - How JPF Learned to be Lean
Insuring Lean Operations - How JPF Learned to be LeanInsuring Lean Operations - How JPF Learned to be Lean
Insuring Lean Operations - How JPF Learned to be LeanLean Enterprise Academy
 
Assembly Line Balancing
Assembly Line BalancingAssembly Line Balancing
Assembly Line BalancingAlan Wei Teck
 
7 ways of reducing tpm cost
7 ways of reducing tpm cost 7 ways of reducing tpm cost
7 ways of reducing tpm cost TradeInsight
 

Viewers also liked (20)

Types of waste - lean Concept Krishna Heda
Types of waste - lean Concept Krishna HedaTypes of waste - lean Concept Krishna Heda
Types of waste - lean Concept Krishna Heda
 
VSM – Current & Future
VSM – Current & FutureVSM – Current & Future
VSM – Current & Future
 
How to Use VSM Correctly
How to Use VSM CorrectlyHow to Use VSM Correctly
How to Use VSM Correctly
 
Value stream mapping training
Value stream mapping trainingValue stream mapping training
Value stream mapping training
 
Value Stream Mapping - Strategy Before Tactics
Value Stream Mapping - Strategy Before TacticsValue Stream Mapping - Strategy Before Tactics
Value Stream Mapping - Strategy Before Tactics
 
Value Stream Mapping Overview Update
Value Stream Mapping Overview UpdateValue Stream Mapping Overview Update
Value Stream Mapping Overview Update
 
Triz - Indepth Knowledge - Krishna Heda
Triz - Indepth Knowledge -  Krishna HedaTriz - Indepth Knowledge -  Krishna Heda
Triz - Indepth Knowledge - Krishna Heda
 
5s training slides_432
5s training slides_4325s training slides_432
5s training slides_432
 
M shop pres_updated_2_2012
M shop pres_updated_2_2012M shop pres_updated_2_2012
M shop pres_updated_2_2012
 
Training with ROI
Training with ROITraining with ROI
Training with ROI
 
Case Study of Herrestad Clinic, Sweden
Case Study of Herrestad Clinic, SwedenCase Study of Herrestad Clinic, Sweden
Case Study of Herrestad Clinic, Sweden
 
Application of value stream mapping for reduction of cycle time in machining ...
Application of value stream mapping for reduction of cycle time in machining ...Application of value stream mapping for reduction of cycle time in machining ...
Application of value stream mapping for reduction of cycle time in machining ...
 
Insuring Lean Operations - How JPF Learned to be Lean
Insuring Lean Operations - How JPF Learned to be LeanInsuring Lean Operations - How JPF Learned to be Lean
Insuring Lean Operations - How JPF Learned to be Lean
 
Value Steam Mapping
Value Steam MappingValue Steam Mapping
Value Steam Mapping
 
TPM Loss Analysis
TPM  Loss AnalysisTPM  Loss Analysis
TPM Loss Analysis
 
Housing Repairs
Housing RepairsHousing Repairs
Housing Repairs
 
Assembly Line Balancing
Assembly Line BalancingAssembly Line Balancing
Assembly Line Balancing
 
Basics f HRM
Basics f HRMBasics f HRM
Basics f HRM
 
Ch9 Jit
Ch9 JitCh9 Jit
Ch9 Jit
 
7 ways of reducing tpm cost
7 ways of reducing tpm cost 7 ways of reducing tpm cost
7 ways of reducing tpm cost
 

Similar to Value stream mapping - Future State

10-vcc-how-to-understand-and-complete-a-value-stream-map-v2.pdf
10-vcc-how-to-understand-and-complete-a-value-stream-map-v2.pdf10-vcc-how-to-understand-and-complete-a-value-stream-map-v2.pdf
10-vcc-how-to-understand-and-complete-a-value-stream-map-v2.pdfBENCHERMUSHEMEZA1
 
how-to-understand-and-complete-a-value-stream-map
how-to-understand-and-complete-a-value-stream-maphow-to-understand-and-complete-a-value-stream-map
how-to-understand-and-complete-a-value-stream-mapBENCHERMUSHEMEZA1
 
Demand Flow Technology workshop - Lean manufacturing
Demand Flow Technology workshop - Lean manufacturingDemand Flow Technology workshop - Lean manufacturing
Demand Flow Technology workshop - Lean manufacturingbisal6
 
Management information system
Management information systemManagement information system
Management information systemKush Sharma
 
01-VSM-VSD-Training-Presentation-20140406-pptx.pptx
01-VSM-VSD-Training-Presentation-20140406-pptx.pptx01-VSM-VSD-Training-Presentation-20140406-pptx.pptx
01-VSM-VSD-Training-Presentation-20140406-pptx.pptxabdullahmohamed10900
 
460 operations - 4.20
460   operations - 4.20460   operations - 4.20
460 operations - 4.20Kyle Bakken
 
Metrics-Based Process Mapping
Metrics-Based Process MappingMetrics-Based Process Mapping
Metrics-Based Process MappingTKMG, Inc.
 
Have you tried to lean your IT Service Management? by Daniel Breston
Have you tried to lean your IT Service Management? by Daniel BrestonHave you tried to lean your IT Service Management? by Daniel Breston
Have you tried to lean your IT Service Management? by Daniel BrestonInstitut Lean France
 
Value Stream Mapping in Anatomic Pathology
Value Stream Mapping in Anatomic PathologyValue Stream Mapping in Anatomic Pathology
Value Stream Mapping in Anatomic Pathologyguest389e15
 
Froehling Value Stream Mapping G2 2008 Final Version
Froehling Value Stream Mapping G2 2008 Final VersionFroehling Value Stream Mapping G2 2008 Final Version
Froehling Value Stream Mapping G2 2008 Final Versionhfroehling1
 
Eliminating the production bottlenecks
Eliminating the production bottlenecksEliminating the production bottlenecks
Eliminating the production bottlenecksdutconsult
 
Learning to see (VSM)
Learning to see (VSM)Learning to see (VSM)
Learning to see (VSM)Mohamed Effat
 

Similar to Value stream mapping - Future State (20)

Lean section 2
Lean section 2Lean section 2
Lean section 2
 
Value Stream Analysis
Value Stream AnalysisValue Stream Analysis
Value Stream Analysis
 
VSM Lean Value Stream intro
VSM Lean Value Stream introVSM Lean Value Stream intro
VSM Lean Value Stream intro
 
10-vcc-how-to-understand-and-complete-a-value-stream-map-v2.pdf
10-vcc-how-to-understand-and-complete-a-value-stream-map-v2.pdf10-vcc-how-to-understand-and-complete-a-value-stream-map-v2.pdf
10-vcc-how-to-understand-and-complete-a-value-stream-map-v2.pdf
 
how-to-understand-and-complete-a-value-stream-map
how-to-understand-and-complete-a-value-stream-maphow-to-understand-and-complete-a-value-stream-map
how-to-understand-and-complete-a-value-stream-map
 
Demand Flow Technology workshop - Lean manufacturing
Demand Flow Technology workshop - Lean manufacturingDemand Flow Technology workshop - Lean manufacturing
Demand Flow Technology workshop - Lean manufacturing
 
Management information system
Management information systemManagement information system
Management information system
 
01-VSM-VSD-Training-Presentation-20140406-pptx.pptx
01-VSM-VSD-Training-Presentation-20140406-pptx.pptx01-VSM-VSD-Training-Presentation-20140406-pptx.pptx
01-VSM-VSD-Training-Presentation-20140406-pptx.pptx
 
460 operations - 4.20
460   operations - 4.20460   operations - 4.20
460 operations - 4.20
 
Value Stream Mapping in the Office
Value Stream Mapping in the Office Value Stream Mapping in the Office
Value Stream Mapping in the Office
 
VSM (Méthode HOSHIN)
VSM (Méthode HOSHIN)VSM (Méthode HOSHIN)
VSM (Méthode HOSHIN)
 
Value Stream Maps
Value Stream MapsValue Stream Maps
Value Stream Maps
 
Metrics-Based Process Mapping
Metrics-Based Process MappingMetrics-Based Process Mapping
Metrics-Based Process Mapping
 
Have you tried to lean your IT Service Management? by Daniel Breston
Have you tried to lean your IT Service Management? by Daniel BrestonHave you tried to lean your IT Service Management? by Daniel Breston
Have you tried to lean your IT Service Management? by Daniel Breston
 
Value stream mapping
Value stream mappingValue stream mapping
Value stream mapping
 
Value stream mapping
Value stream mappingValue stream mapping
Value stream mapping
 
Value Stream Mapping in Anatomic Pathology
Value Stream Mapping in Anatomic PathologyValue Stream Mapping in Anatomic Pathology
Value Stream Mapping in Anatomic Pathology
 
Froehling Value Stream Mapping G2 2008 Final Version
Froehling Value Stream Mapping G2 2008 Final VersionFroehling Value Stream Mapping G2 2008 Final Version
Froehling Value Stream Mapping G2 2008 Final Version
 
Eliminating the production bottlenecks
Eliminating the production bottlenecksEliminating the production bottlenecks
Eliminating the production bottlenecks
 
Learning to see (VSM)
Learning to see (VSM)Learning to see (VSM)
Learning to see (VSM)
 

Recently uploaded

DATA STRUCTURE AND ALGORITHM for beginners
DATA STRUCTURE AND ALGORITHM for beginnersDATA STRUCTURE AND ALGORITHM for beginners
DATA STRUCTURE AND ALGORITHM for beginnersSabitha Banu
 
Influencing policy (training slides from Fast Track Impact)
Influencing policy (training slides from Fast Track Impact)Influencing policy (training slides from Fast Track Impact)
Influencing policy (training slides from Fast Track Impact)Mark Reed
 
Employee wellbeing at the workplace.pptx
Employee wellbeing at the workplace.pptxEmployee wellbeing at the workplace.pptx
Employee wellbeing at the workplace.pptxNirmalaLoungPoorunde1
 
ROOT CAUSE ANALYSIS PowerPoint Presentation
ROOT CAUSE ANALYSIS PowerPoint PresentationROOT CAUSE ANALYSIS PowerPoint Presentation
ROOT CAUSE ANALYSIS PowerPoint PresentationAadityaSharma884161
 
call girls in Kamla Market (DELHI) 🔝 >༒9953330565🔝 genuine Escort Service 🔝✔️✔️
call girls in Kamla Market (DELHI) 🔝 >༒9953330565🔝 genuine Escort Service 🔝✔️✔️call girls in Kamla Market (DELHI) 🔝 >༒9953330565🔝 genuine Escort Service 🔝✔️✔️
call girls in Kamla Market (DELHI) 🔝 >༒9953330565🔝 genuine Escort Service 🔝✔️✔️9953056974 Low Rate Call Girls In Saket, Delhi NCR
 
Introduction to AI in Higher Education_draft.pptx
Introduction to AI in Higher Education_draft.pptxIntroduction to AI in Higher Education_draft.pptx
Introduction to AI in Higher Education_draft.pptxpboyjonauth
 
Like-prefer-love -hate+verb+ing & silent letters & citizenship text.pdf
Like-prefer-love -hate+verb+ing & silent letters & citizenship text.pdfLike-prefer-love -hate+verb+ing & silent letters & citizenship text.pdf
Like-prefer-love -hate+verb+ing & silent letters & citizenship text.pdfMr Bounab Samir
 
Grade 9 Q4-MELC1-Active and Passive Voice.pptx
Grade 9 Q4-MELC1-Active and Passive Voice.pptxGrade 9 Q4-MELC1-Active and Passive Voice.pptx
Grade 9 Q4-MELC1-Active and Passive Voice.pptxChelloAnnAsuncion2
 
Judging the Relevance and worth of ideas part 2.pptx
Judging the Relevance  and worth of ideas part 2.pptxJudging the Relevance  and worth of ideas part 2.pptx
Judging the Relevance and worth of ideas part 2.pptxSherlyMaeNeri
 
ECONOMIC CONTEXT - PAPER 1 Q3: NEWSPAPERS.pptx
ECONOMIC CONTEXT - PAPER 1 Q3: NEWSPAPERS.pptxECONOMIC CONTEXT - PAPER 1 Q3: NEWSPAPERS.pptx
ECONOMIC CONTEXT - PAPER 1 Q3: NEWSPAPERS.pptxiammrhaywood
 
MULTIDISCIPLINRY NATURE OF THE ENVIRONMENTAL STUDIES.pptx
MULTIDISCIPLINRY NATURE OF THE ENVIRONMENTAL STUDIES.pptxMULTIDISCIPLINRY NATURE OF THE ENVIRONMENTAL STUDIES.pptx
MULTIDISCIPLINRY NATURE OF THE ENVIRONMENTAL STUDIES.pptxAnupkumar Sharma
 
Proudly South Africa powerpoint Thorisha.pptx
Proudly South Africa powerpoint Thorisha.pptxProudly South Africa powerpoint Thorisha.pptx
Proudly South Africa powerpoint Thorisha.pptxthorishapillay1
 
How to Configure Email Server in Odoo 17
How to Configure Email Server in Odoo 17How to Configure Email Server in Odoo 17
How to Configure Email Server in Odoo 17Celine George
 
Types of Journalistic Writing Grade 8.pptx
Types of Journalistic Writing Grade 8.pptxTypes of Journalistic Writing Grade 8.pptx
Types of Journalistic Writing Grade 8.pptxEyham Joco
 
EPANDING THE CONTENT OF AN OUTLINE using notes.pptx
EPANDING THE CONTENT OF AN OUTLINE using notes.pptxEPANDING THE CONTENT OF AN OUTLINE using notes.pptx
EPANDING THE CONTENT OF AN OUTLINE using notes.pptxRaymartEstabillo3
 
Alper Gobel In Media Res Media Component
Alper Gobel In Media Res Media ComponentAlper Gobel In Media Res Media Component
Alper Gobel In Media Res Media ComponentInMediaRes1
 
Computed Fields and api Depends in the Odoo 17
Computed Fields and api Depends in the Odoo 17Computed Fields and api Depends in the Odoo 17
Computed Fields and api Depends in the Odoo 17Celine George
 
Gas measurement O2,Co2,& ph) 04/2024.pptx
Gas measurement O2,Co2,& ph) 04/2024.pptxGas measurement O2,Co2,& ph) 04/2024.pptx
Gas measurement O2,Co2,& ph) 04/2024.pptxDr.Ibrahim Hassaan
 
How to do quick user assign in kanban in Odoo 17 ERP
How to do quick user assign in kanban in Odoo 17 ERPHow to do quick user assign in kanban in Odoo 17 ERP
How to do quick user assign in kanban in Odoo 17 ERPCeline George
 

Recently uploaded (20)

DATA STRUCTURE AND ALGORITHM for beginners
DATA STRUCTURE AND ALGORITHM for beginnersDATA STRUCTURE AND ALGORITHM for beginners
DATA STRUCTURE AND ALGORITHM for beginners
 
Influencing policy (training slides from Fast Track Impact)
Influencing policy (training slides from Fast Track Impact)Influencing policy (training slides from Fast Track Impact)
Influencing policy (training slides from Fast Track Impact)
 
Employee wellbeing at the workplace.pptx
Employee wellbeing at the workplace.pptxEmployee wellbeing at the workplace.pptx
Employee wellbeing at the workplace.pptx
 
ROOT CAUSE ANALYSIS PowerPoint Presentation
ROOT CAUSE ANALYSIS PowerPoint PresentationROOT CAUSE ANALYSIS PowerPoint Presentation
ROOT CAUSE ANALYSIS PowerPoint Presentation
 
call girls in Kamla Market (DELHI) 🔝 >༒9953330565🔝 genuine Escort Service 🔝✔️✔️
call girls in Kamla Market (DELHI) 🔝 >༒9953330565🔝 genuine Escort Service 🔝✔️✔️call girls in Kamla Market (DELHI) 🔝 >༒9953330565🔝 genuine Escort Service 🔝✔️✔️
call girls in Kamla Market (DELHI) 🔝 >༒9953330565🔝 genuine Escort Service 🔝✔️✔️
 
Introduction to AI in Higher Education_draft.pptx
Introduction to AI in Higher Education_draft.pptxIntroduction to AI in Higher Education_draft.pptx
Introduction to AI in Higher Education_draft.pptx
 
Like-prefer-love -hate+verb+ing & silent letters & citizenship text.pdf
Like-prefer-love -hate+verb+ing & silent letters & citizenship text.pdfLike-prefer-love -hate+verb+ing & silent letters & citizenship text.pdf
Like-prefer-love -hate+verb+ing & silent letters & citizenship text.pdf
 
Grade 9 Q4-MELC1-Active and Passive Voice.pptx
Grade 9 Q4-MELC1-Active and Passive Voice.pptxGrade 9 Q4-MELC1-Active and Passive Voice.pptx
Grade 9 Q4-MELC1-Active and Passive Voice.pptx
 
Judging the Relevance and worth of ideas part 2.pptx
Judging the Relevance  and worth of ideas part 2.pptxJudging the Relevance  and worth of ideas part 2.pptx
Judging the Relevance and worth of ideas part 2.pptx
 
TataKelola dan KamSiber Kecerdasan Buatan v022.pdf
TataKelola dan KamSiber Kecerdasan Buatan v022.pdfTataKelola dan KamSiber Kecerdasan Buatan v022.pdf
TataKelola dan KamSiber Kecerdasan Buatan v022.pdf
 
ECONOMIC CONTEXT - PAPER 1 Q3: NEWSPAPERS.pptx
ECONOMIC CONTEXT - PAPER 1 Q3: NEWSPAPERS.pptxECONOMIC CONTEXT - PAPER 1 Q3: NEWSPAPERS.pptx
ECONOMIC CONTEXT - PAPER 1 Q3: NEWSPAPERS.pptx
 
MULTIDISCIPLINRY NATURE OF THE ENVIRONMENTAL STUDIES.pptx
MULTIDISCIPLINRY NATURE OF THE ENVIRONMENTAL STUDIES.pptxMULTIDISCIPLINRY NATURE OF THE ENVIRONMENTAL STUDIES.pptx
MULTIDISCIPLINRY NATURE OF THE ENVIRONMENTAL STUDIES.pptx
 
Proudly South Africa powerpoint Thorisha.pptx
Proudly South Africa powerpoint Thorisha.pptxProudly South Africa powerpoint Thorisha.pptx
Proudly South Africa powerpoint Thorisha.pptx
 
How to Configure Email Server in Odoo 17
How to Configure Email Server in Odoo 17How to Configure Email Server in Odoo 17
How to Configure Email Server in Odoo 17
 
Types of Journalistic Writing Grade 8.pptx
Types of Journalistic Writing Grade 8.pptxTypes of Journalistic Writing Grade 8.pptx
Types of Journalistic Writing Grade 8.pptx
 
EPANDING THE CONTENT OF AN OUTLINE using notes.pptx
EPANDING THE CONTENT OF AN OUTLINE using notes.pptxEPANDING THE CONTENT OF AN OUTLINE using notes.pptx
EPANDING THE CONTENT OF AN OUTLINE using notes.pptx
 
Alper Gobel In Media Res Media Component
Alper Gobel In Media Res Media ComponentAlper Gobel In Media Res Media Component
Alper Gobel In Media Res Media Component
 
Computed Fields and api Depends in the Odoo 17
Computed Fields and api Depends in the Odoo 17Computed Fields and api Depends in the Odoo 17
Computed Fields and api Depends in the Odoo 17
 
Gas measurement O2,Co2,& ph) 04/2024.pptx
Gas measurement O2,Co2,& ph) 04/2024.pptxGas measurement O2,Co2,& ph) 04/2024.pptx
Gas measurement O2,Co2,& ph) 04/2024.pptx
 
How to do quick user assign in kanban in Odoo 17 ERP
How to do quick user assign in kanban in Odoo 17 ERPHow to do quick user assign in kanban in Odoo 17 ERP
How to do quick user assign in kanban in Odoo 17 ERP
 

Value stream mapping - Future State

  • 1. Presented By- Krishna Heda Value Stream Mapping
  • 2. VSM is Used in Helping to Identify the 8 Types of Waste Over Production Inventory Transportation Waiting Motion Over Processing Correction Not Utilizing Human Resources
  • 3. To be successful, a Total System Strategy must be employed. The Total System Strategy is facilitated by committed leadership, knowledge, an effective planning process and a bias towards action. Total System Strategy Flow Flow Operational Availability Workplace Organization Material Movement Employee Environment & Involvement Quality Flow Manufacturing (MSD) Waste Elimination Leadership Planning Knowledge Action Flow Flow
  • 4.
  • 5. Objectives Why Map the Value Stream?
  • 6.
  • 7.
  • 10. Introduction to Value Stream Mapping A Value Stream includes all elements (both value and non-value added) that occur to a given product from its inception as a raw material through delivery to the customer. Definition of Value Stream
  • 11. Value Added & Non-Value Added
  • 12. Waste
  • 13.
  • 14. Definition of VSM What is Lean? “More with Less” or “Less with Less” Less Downtime of Equipment Less Inventory Less waste of Materials Less waste of Supplies Less “Non Value Added” Less Scrap Less Rework Less Absenteeism Less Injuries Less Lead-time Less Errors in Production
  • 15. Indications of Opportunities EMPLOYEE SYMPTOMS * Frustration * Low Morale * Absenteeism * Negativism * “It’s Not My Job” EXTERNAL INDICATORS * Warranty Costs * Negative Publicity * Pricing Inflexibility * Market Share Drop
  • 17.
  • 18.
  • 19. Identify Opportunities for Improvement ? Data Collection
  • 20.
  • 21. Map Current State The Steps Select a Product Family Form a Team Understand Customer Demand Map the Process Flow Map the Material Flow Map the Information Flow Calculate Total Product Cycle Time Detail Off-Line Activities Step 1: Step 2: Step 3: Step 4: Step 5: Step 6: Step 7: Step 8:
  • 22. Tools Introduction to Value Stream Mapping Scrap Manufacturing Process Kaizen Lightning Burst Outside Source/ Customer Data Box Inventory I o o o Truck Shipment Finished Goods to Customer Push Arrow Supermarket Buffer or Safety Stock Manual Information Flow Electronic Information Flow Production Kanban Withdrawal Kanban Signal Kanban Kanban Post
  • 23.
  • 24.
  • 25.
  • 26. Customer Map Current State Step 4: Map the Process Flow Demand/month: Part A = Part B = Part C = # of shifts = Inventory Part A = Part B = Part C = # of shifts = Shipping Assembly Welding Stamping Takt = C.T. = D.T. = FTQ = 90% C/O Time = Lot Size = # of Shifts WIP = Takt = C.T. = D.T. = 20% FTQ = C/O Time = Lot Size = # of Shifts WIP = Takt = C.T. = D.T. = FTQ = C/O Time = 4 hrs. Lot Size = # of Shifts WIP = Changeover Downtime FTQ
  • 27. Map Current State Step 6: Map the Information Flow Customer Demand/month: Part A = 705 pcs. Part B = 600 pcs. Part C = 1650 pcs. # of shifts = Inventory Part A = 750 pcs Part B = 600 pcs Part C = 1650 pcs # of shifts = Shipping Assembly Welding Stamping Takt = C.T. = D.T. = FTQ = 90% C/O Time = Lot Size = # of Shifts WIP = 550 pcs. Takt = C.T. = D.T. = 20% FTQ = C/O Time = Lot Size = # of Shifts WIP = 60 pcs. Takt = C.T. = D.T. = FTQ = C/O Time = 4 hrs. Lot Size = # of Shifts WIP = 25 pcs. Changeover Downtime FTQ I I I I 2 x/ day 2 x/ week Supplier 1,200 pcs 1,500 pcs 800 pcs 500 pcs PC & L Weekly Build Schedule Daily Ship Schedule 6 week rolling forecast 6 week rolling forecast Weekly Order Weekly Order
  • 28. Map Current State Step 7: Calculate Total Product Cycle Time Customer Demand/month: Part A = 705 pcs. Part B = 600 pcs. Part C = 1650 pcs. # of shifts = Inventory Part A = 750 pcs Part B = 600 pcs Part C = 1650 pcs # of shifts = Shipping Assembly Welding Stamping Takt = C.T. = D.T. = FTQ = 90% C/O Time = Lot Size = # of Shifts WIP = 550 pcs. Takt = C.T. = D.T. = 20% FTQ = C/O Time = Lot Size = # of Shifts WIP = 60 pcs. Takt = C.T. = D.T. = FTQ = C/O Time = 4 hrs. Lot Size = # of Shifts WIP = 25 pcs. Changeover Downtime FTQ I I I I 2 x/ day 2 x/ week Supplier 1,200 pcs 1,500 pcs 800 pcs 500 pcs PC & L Weekly Build Schedule Daily Ship Schedule 6 week rolling forecast 6 week rolling forecast Weekly Order Weekly Order .27 days .17 days .4 days .5 days 1.0 days .18 days .02 days .008 days TPc/t = 2.5 days
  • 30.
  • 31.
  • 32.
  • 33.
  • 34.
  • 35.
  • 39.
  • 44. Where will you need to use supermarket pull systems to control production of upstream processes? What is Takt Time? Will you build to a finished goods supermarket or directly to shipping? Where can you use continuous flow processing? At what single point in the production chain will you schedule production? (Typically, this will be the final process.) How will you level the production mix at the pacemaker process? What increment of work will you consistently release and take away at the pacemaker process? What process improvements will be necessary at the value stream to flow as your future state design specifies? Consider Key Questions
  • 47. Map Future State Step 1: Step 2: Step 3: Step 4: Step 5: Step 6: Step 7: The Steps Validate Customer Demand Draw the Future State Process Flow Map the Future State Material Flow Map the Future State Information Flow Calculate Total Product Cycle Time Detail Off-Line Activities Outline a Plan A simple way to approach the Future State Map is to begin by modifying the Current State Map.
  • 48. Map Future State Customer demand should be validated to ensure accuracy and that consideration has been given for future business. Step 1: Validate Customer Demand X pcs / month Std Pack Qty # Shifts Customer
  • 49. Map Future State Finished Goods Assembly Layout Welding Stamping X pcs / month Std Pack Qty # Shifts C/O Time = CT = TAKT Time 3 Shifts DT = Scrap = 0 Overtime 2 Shifts Max Size # Material Handlers C/O Time = CT = TAKT Time 3 Shifts DT = Scrap/Rework = C/O Time = CT = TAKT Time 3 Shifts DT = Scrap/Rework= Small Lot # Operators WIP = WIP = WIP = Customer Step 2: Draw the Future State Process Flow List the items needed for lean process flow
  • 50. Map Future State Finished Goods Assembly Layout Welding 6 x / Day Daily Stamping X pcs / month Std Pack Qty # Shifts C/O Time = CT = TAKT Time 3 Shifts DT = Scrap = 0 Overtime 2 Shifts Max Size # Material Handlers C/O Time = CT = TAKT Time 3 Shifts DT = Scrap/Rework = C/O Time = CT = TAKT Time 3 Shifts DT = Scrap/Rework= Small Lot # Operators WIP = WIP = WIP = Customer Steel Supplier Step 3: Draw the Future State Material Flow
  • 51. Map Future State Rolling 6 wk Forecast Finished Goods Assembly Layout Welding 6 x / Day PC & L 6-wk forecast Daily Level Box DA1 DA2 DA3 Stamping X pcs / month Std Pack Qty # Shifts Weekly Order C/O Time = CT = TAKT Time 3 Shifts DT = Scrap = 0 Overtime 2 Shifts Max Size # Material Handlers C/O Time = CT = TAKT Time 3 Shifts DT = Scrap/Rework = C/O Time = CT = TAKT Time 3 Shifts DT = Scrap/Rework= Small Lot # Operators WIP = WIP = WIP = Customer Step 4: Draw the Future State Informational Flow Steel Supplier
  • 52. Step 5: Calculate Total Product Cycle Time (TP c/t) Map Future State Rolling 6 wk Forecast Finished Goods Assembly Layout Welding 6 x / Day PC & L 6-wk forecast Daily Level Box DA1 DA2 DA3 Stamping X pcs / month Std Pack Qty # Shifts Weekly Order C/O Time = CT = TAKT Time 3 Shifts DT = Scrap = 0 Overtime 2 Shifts Max Size # Material Handlers C/O Time = CT = TAKT Time 3 Shifts DT = Scrap/Rework = C/O Time = CT = TAKT Time 3 Shifts DT = Scrap/Rework= Small Lot # Operators WIP = WIP = WIP = Inv .Time Proc .Time TPc /t = ? ? days ? days ? days ? days ? days ? days ? days Customer Steel Supplier
  • 53.
  • 54. Original Condition Step7: Outline a Plan Map Future State Future Condition Inj: Molding 2 Sender Ass’y 2 MSS Ass’y Plants 7 Stamping 10 Tank Ass’y 4 Perform to TAKT & Pitch. Produce to Order Load Leveling and Pull Zone Maintenance & Fast Response Labels Level ABABA. . . Staging by Truck card by card (Pitch = 14 Units) 1ST 2ND 3RD 4TH 1ST 2ND 3RD 4TH Establish TAKT & Flow in Tank Ass'y Stamping Changeover Reduction Reduce Stamping Buffer Move Ass'y to Plant 10 Establish TAKT & Flow in Sender Ass'y Pull To Sender Ass'y Training 1999 2000 Activity Inj: Molding 2 Sender Ass’y 2 MSS Tank Ass’y Stamping Fuel Pump Ass’y I I I I I I Ass’y Plants 2 12 10 4 Cycle-Time Driven. Batches. Change Over Change Over No Flow Attendance No Flow Uptime Item Current Target Total product cycle time Parts / Person Hour Delivery Performance Inventory (days) Overtime Uptime METRICS
  • 55. Linkage to Improvement Workplace Organization 5S Deploy Visual Controls Layout Waste free - Eliminate waste thru Continuous Improvement Deploy and maintain appropriate Kanbans Uninterrupted flow Error Free Processing Insignificant Changeover
  • 56.
  • 57.
  • 58. Eliminate Waste Consider Key Questions Flow Manufacturing 1 Piece Flow, Employee Involvement Empowered, Continuous Imp. Workplace Organization Std. Work, 5S, EH&S Quality RRCA, Process Certification Roadmap Operational SMED, TPM, MP Material Movement FIFO, Pull System
  • 59.
  • 60. Summary Getting Started Be Wise… Observe…it is necessary to physically observe the value stream. This provides the greatest opportunity to identify and eliminate waste. Be Persistent... Value stream mapping is an iterative process. Todays future state is tomorrows current state. This is what continuous improvement is all about.
  • 61. Is the Time NOW
  • 63.
  • 64.

Editor's Notes

  1. 1999 Delphi Automotive Systems DMS Overview - Instructor Manual - Version 1.0 Page Arial 12 Sub-bullet Next Sub-bullet Last Sub-bullet
  2. 1999 Delphi Automotive Systems DMS Overview - Instructor Manual - Version 1.0 Page Arial 12 Sub-bullet Next Sub-bullet Last Sub-bullet
  3. 1999 Delphi Automotive Systems DMS Overview - Instructor Manual - Version 1.0 Page Explain that DMS is a Total System Strategy and that committed leadership, knowledge, effective planning and action are essential. Emphasize the importance of Action. Explain that DMS is structured in six interdependent elements and reference these elements on the graphic. Explain that two key elements of DMS are: Flow-based manufacturing. Waste identification and elimination. Transition to the next slide by stating: Let’s briefly discuss Waste Identification. Key Point
  4. 1999 Delphi Automotive Systems DMS Overview - Instructor Manual - Version 1.0 Page
  5. 1999 Delphi Automotive Systems DMS Overview - Instructor Manual - Version 1.0 Page Activity: Design Future State Goal: To Complete a Future State Map and an Implementation Plan.
  6. 1999 Delphi Automotive Systems DMS Overview - Instructor Manual - Version 1.0 Page
  7. 1999 Delphi Automotive Systems DMS Overview - Instructor Manual - Version 1.0 Page
  8. 1999 Delphi Automotive Systems DMS Overview - Instructor Manual - Version 1.0 Page Activity: Design Future State Goal: To Complete a Future State Map and an Implementation Plan.
  9. 1999 Delphi Automotive Systems DMS Overview - Instructor Manual - Version 1.0 Page Activity: Design Future State Goal: To Complete a Future State Map and an Implementation Plan.
  10. 1999 Delphi Automotive Systems DMS Overview - Instructor Manual - Version 1.0 Page
  11. 1999 Delphi Automotive Systems DMS Overview - Instructor Manual - Version 1.0 Page Activity: Design Future State Goal: To Complete a Future State Map and an Implementation Plan.
  12. 1999 Delphi Automotive Systems DMS Overview - Instructor Manual - Version 1.0 Page Activity: Design Future State Goal: To Complete a Future State Map and an Implementation Plan.
  13. 1999 Delphi Automotive Systems DMS Overview - Instructor Manual - Version 1.0 Page
  14. 1999 Delphi Automotive Systems DMS Overview - Instructor Manual - Version 1.0 Page Activity: Design Future State Goal: To Complete a Future State Map and an Implementation Plan.
  15. 1999 Delphi Automotive Systems DMS Overview - Instructor Manual - Version 1.0 Page Activity: Design Future State Goal: To Complete a Future State Map and an Implementation Plan.
  16. 1999 Delphi Automotive Systems DMS Overview - Instructor Manual - Version 1.0 Page Activity: Design Future State Goal: To Complete a Future State Map and an Implementation Plan.
  17. 1999 Delphi Automotive Systems DMS Overview - Instructor Manual - Version 1.0 Page
  18. 1999 Delphi Automotive Systems DMS Overview - Instructor Manual - Version 1.0 Page
  19. 1999 Delphi Automotive Systems DMS Overview - Instructor Manual - Version 1.0 Page
  20. 1999 Delphi Automotive Systems DMS Overview - Instructor Manual - Version 1.0 Page
  21. 1999 Delphi Automotive Systems DMS Overview - Instructor Manual - Version 1.0 Page
  22. 1999 Delphi Automotive Systems DMS Overview - Instructor Manual - Version 1.0 Page
  23. 1999 Delphi Automotive Systems DMS Overview - Instructor Manual - Version 1.0 Page 2
  24. 1999 Delphi Automotive Systems DMS Overview - Instructor Manual - Version 1.0 Page 3
  25. 1999 Delphi Automotive Systems DMS Overview - Instructor Manual - Version 1.0 Page 4 Instructors Notes: Sources of information
  26. 1999 Delphi Automotive Systems DMS Overview - Instructor Manual - Version 1.0 Page 5
  27. 1999 Delphi Automotive Systems DMS Overview - Instructor Manual - Version 1.0 Page
  28. 1999 Delphi Automotive Systems DMS Overview - Instructor Manual - Version 1.0 Page 7
  29. 1999 Delphi Automotive Systems DMS Overview - Instructor Manual - Version 1.0 Page Activity: Design Future State Goal: To Complete a Future State Map and an Implementation Plan.
  30. 1999 Delphi Automotive Systems DMS Overview - Instructor Manual - Version 1.0 Page State: This is an optional step.
  31. 1999 Delphi Automotive Systems DMS Overview - Instructor Manual - Version 1.0 Page
  32. 1999 Delphi Automotive Systems DMS Overview - Instructor Manual - Version 1.0 Page Activity : Map the Current State Goal: Prepare for Session 2. Prior to starting Session 2, get a copy of the Current State Map. If possible, make a transparency of the Current State Map and use the transparency for review. The first topic for Session 2 is the Review of the Current State Map. Use the overhead machine for the review then switch to the automated presentation. The presentation assumes you have completed the overview and will show Review Current State Map as a completed topic.
  33. 1999 Delphi Automotive Systems DMS Overview - Instructor Manual - Version 1.0 Page
  34. 1999 Delphi Automotive Systems DMS Overview - Instructor Manual - Version 1.0 Page
  35. 1999 Delphi Automotive Systems DMS Overview - Instructor Manual - Version 1.0 Page
  36. 1999 Delphi Automotive Systems DMS Overview - Instructor Manual - Version 1.0 Page Activity: Design Future State Goal: To Complete a Future State Map and an Implementation Plan.
  37. 1999 Delphi Automotive Systems DMS Overview - Instructor Manual - Version 1.0 Page Activity: Design Future State Goal: To Complete a Future State Map and an Implementation Plan.
  38. 1999 Delphi Automotive Systems DMS Overview - Instructor Manual - Version 1.0 Page Activity: Design Future State Goal: To Complete a Future State Map and an Implementation Plan.
  39. 1999 Delphi Automotive Systems DMS Overview - Instructor Manual - Version 1.0 Page
  40. 1999 Delphi Automotive Systems DMS Overview - Instructor Manual - Version 1.0 Page Activity: Design Future State Goal: To Complete a Future State Map and an Implementation Plan.
  41. 1999 Delphi Automotive Systems DMS Overview - Instructor Manual - Version 1.0 Page Activity: Design Future State Goal: To Complete a Future State Map and an Implementation Plan.
  42. 1999 Delphi Automotive Systems DMS Overview - Instructor Manual - Version 1.0 Page Activity: Design Future State Goal: To Complete a Future State Map and an Implementation Plan.
  43. 1999 Delphi Automotive Systems DMS Overview - Instructor Manual - Version 1.0 Page Activity: Design Future State Goal: To Complete a Future State Map and an Implementation Plan.
  44. 1999 Delphi Automotive Systems DMS Overview - Instructor Manual - Version 1.0 Page
  45. 1999 Delphi Automotive Systems DMS Overview - Instructor Manual - Version 1.0 Page Activity: Design Future State Goal: To Complete a Future State Map and an Implementation Plan.
  46. 1999 Delphi Automotive Systems DMS Overview - Instructor Manual - Version 1.0 Page Activity: Design Future State Goal: To Complete a Future State Map and an Implementation Plan.
  47. 1999 Delphi Automotive Systems DMS Overview - Instructor Manual - Version 1.0 Page
  48. 1999 Delphi Automotive Systems DMS Overview - Instructor Manual - Version 1.0 Page
  49. 1999 Delphi Automotive Systems DMS Overview - Instructor Manual - Version 1.0 Page
  50. 1999 Delphi Automotive Systems DMS Overview - Instructor Manual - Version 1.0 Page
  51. 1999 Delphi Automotive Systems DMS Overview - Instructor Manual - Version 1.0 Page
  52. 1999 Delphi Automotive Systems DMS Overview - Instructor Manual - Version 1.0 Page
  53. 1999 Delphi Automotive Systems DMS Overview - Instructor Manual - Version 1.0 Page
  54. 1999 Delphi Automotive Systems DMS Overview - Instructor Manual - Version 1.0 Page
  55. 1999 Delphi Automotive Systems DMS Overview - Instructor Manual - Version 1.0 Page Activity: Design Future State Goal: To Complete a Future State Map and an Implementation Plan.
  56. 1999 Delphi Automotive Systems DMS Overview - Instructor Manual - Version 1.0 Page
  57. 1999 Delphi Automotive Systems DMS Overview - Instructor Manual - Version 1.0 Page
  58. 1999 Delphi Automotive Systems DMS Overview - Instructor Manual - Version 1.0 Page
  59. 1999 Delphi Automotive Systems DMS Overview - Instructor Manual - Version 1.0 Page
  60. 1999 Delphi Automotive Systems DMS Overview - Instructor Manual - Version 1.0 Page
  61. 1999 Delphi Automotive Systems DMS Overview - Instructor Manual - Version 1.0 Page
  62. 1999 Delphi Automotive Systems DMS Overview - Instructor Manual - Version 1.0 Page Activity: Design Future State Goal: To Complete a Future State Map and an Implementation Plan.
  63. 1999 Delphi Automotive Systems DMS Overview - Instructor Manual - Version 1.0 Page Activity: Design Future State Goal: To Complete a Future State Map and an Implementation Plan.
  64. 1999 Delphi Automotive Systems DMS Overview - Instructor Manual - Version 1.0 Page Activity : Map the Current State Goal: Prepare for Session 2. Prior to starting Session 2, get a copy of the Current State Map. If possible, make a transparency of the Current State Map and use the transparency for review. The first topic for Session 2 is the Review of the Current State Map. Use the overhead machine for the review then switch to the automated presentation. The presentation assumes you have completed the overview and will show Review Current State Map as a completed topic.