VSM
•
5 likes•507 views

Value steam Mapping- Graphical presentation of information flow and material flow

Recommended
More Related Content
What's hot
What's hot (20)
Viewers also liked
Similar to VSM
Similar to VSM (20)
More from মোঃ ফুরকান উদ্দিন জুয়েল
More from মোঃ ফুরকান উদ্দিন জুয়েল (19)
Recently uploaded
Recently uploaded (20)
VSM
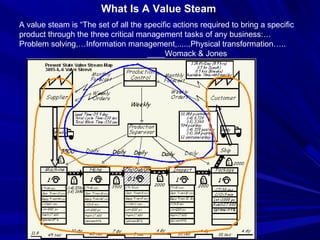
- 1. What Is A Value Steam A value steam is “The set of all the specific actions required to bring a specific product through the three critical management tasks of any business:… Problem solving,…Information management,......Physical transformation….. ____Womack & Jones
- 2. Importance • VSM addresses material process sequences and flows as well as information flows that impact movement. • It encourages data acquisition in a systematic manner. • VSM maps reflect a broad view of the process, usually from external supplier from the external customer at a given facility. • VSM is most important in group setting because many of the problems it exposes reach across organizational lines of responsibility and enterprise. • This technique lends well to high volume, low Varity production. Application in other situation can be problematic. History and background: VSM derives from the automotive industry and was popularized by womack and jones in their book “learning to see”. It is not clear whether Toyota invented VSM or used it in a formal way.
- 3. When to use value steam mapping Use VSM for high production, low Varity product mixes with few components and sub assemblies and dedicated components.
- 4. VSM conventions: VSM symbols and conventions are fairly complex. They represent information flows, material, storage and many specific techniques of lean such as Kanban. VSM symbols: Information symbols represent scheduling, forecast and similar information flows that after production. This are generally in the upper middle region. Information usually moves from right to left (upstream). Material and process symbols represent process equipment and departments, storage areas and other features related directly to material. Material flows from left to right (downstream).
- 8. Now we will use the example of a value sleeve machining to illustrate the steps for both present and future step maps Sixteen steps to the present state Map: Step 1:Draw Customer, Supplier and Production control icons. Place these as shown in the figure Step 2: Enter customer requirements per month and per day. The VSM of figure has two similar but distinct parts labeled as “-4” and “-6”. Step 3: Calculate daily production and container requirements. Production should correspond to customer requirements. When containers hold multiple pieces,
- 9. Step 4: Draw outbound shipping icon and truck with delivery frequency. Note full, partial or mixed loads. Step 5: Draw inbound shipping icon, truck and delivery frequency, Note full, partial and mixed loads.
- 10. Step 6: Draw boxes for each process in sequence, left to right. Step 7: add data boxes below the process boxes and timeline for value added and non value added.
- 11. Step 8:Add communication arrows and note methods and frequencies. This may require considerable investigation. Step 9: Obtain process attributes and add to data boxes. It is best to observe all times directly. Step 10: Add operator symbols and numbers. When the value stream shares a process with other products, use only the number of operators dedicated to the value stream being mapped.
- 12. Step 11: Add inventory locations and levels in production units. Step 12: Add push, pull and FIFO icons. Step 13: Add any other information that may prove useful.
- 13. Step 14: Add working hours. Use the net available hours planned or scheduled for factory or scheduled for the factory or department at the expected customer demand. Step 15: Calculate lead times and place on the timeline. For processes, the Lead Time is the process cycle time. For transports it is the time for transport. For inventory point, the section on “Calculating Inventory Times” applies. Step 16: Calculate total cycle time and lead time. Add the total of VA and NVA times on
- 14. What Goes In A Data Box
- 16. Future State Steps Step 1: Review the present state Map At this time, the VSM team should review their present state map. This review should answer three questions: 1. Is the map essentially correct? 2. Does everyone on the team understand the map in all its detail? 3. Where are the major opportunity areas? Step 2: Calculate Takt time Calculate the takt time based on customer demand. Compare the takt time to process time for each process box. If any process time is longer than the takt time, there is a capacity problem with this process. Speed up the process Additional equipment or process Eliminate the process
- 17. Step 3: Identify bottleneck Process The bottleneck is the process that with the longest cycle time. It determines total system throughput and is the primary point for scheduling. We want to pay much attention to the bottleneck process. Step 4: Identify lot size and setup opportunities The larger the setup cost the larger the lot size. Smaller lots are desirable because this make scheduling easier, reduce inventory and enable kanban. If setup cost and time can be reduced, it allows smaller lots and frees capacity for additional production and for scheduling flexibility. If the machining setup cannot be reduced, we could maintain a high inventory between machining and honing and then operate with much smaller lots in Honing, Cleaning, Inspection and packaging. This might offer significant inventory reduction and improvements in lead-time.
- 18. Steps 5: Identify Potential Workcells Generally it is best to combine all processes, from start to finish, in a single workcell dedicated to the product or product family being mapped. However, several factors may limit the feasibility of this. Step 6: Determine Kanban, Broadcast and FIFO Locations Identify likely locations for Kanban and FIFO and add the appropriate icons to the future state Map as in figure
- 19. FIFO: FIFO processes all orders in same sequence and batch size through several operations. If this is feasible, then we control the upstream process through kanban or conventional scheduling and the downstream process works on whatever comes out of the upstream process in the same sequence and the same batches. This is extremely simple and require very small inventory. Broadcast: Broadcast systems are a variation of FIFO in which all processes work to the same schedule but with a short offset in time to allow for transport. Kanban: Kanban systems allow differences in batch size and/or sequence. Use them where process technology dictates different batch sizes or sequences. Any or all of these methods can work within a workcell or between workcells or between workcells and customers or between workcells and functional departments or between workcells and suppliers.
- 20. Step 7: Establish Overall Scheduling Methods With the basic processes, handling and inventory methods in place, we now establish the overall scheduling method(s). Some of the internal methods have been already established when we set Kanban and FIFO points. In general, the more frequently and the more quickly scheduling information is transferred, the better the performance and the lower the inventory. Step 8: Calculate Lead and Cycle times: Step 9: Add kaizen bursts In developing the future state Map we have made many assumptions about the changes that might be made. In several areas such as the workcell design, kanban system design and setup opportunities, we have ignored the details of how these will be designed and implemented. Kaizen bursts indicate areas where future work is necessary to design and implement these features.