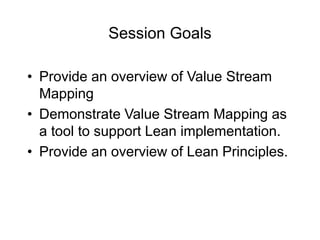
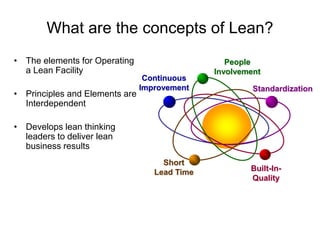
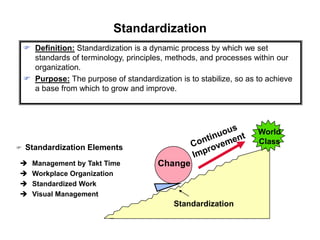
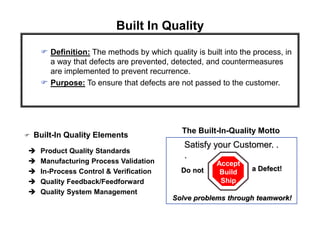
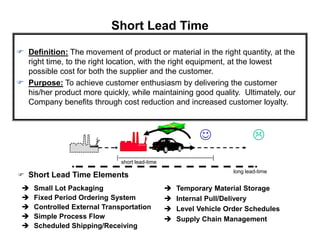
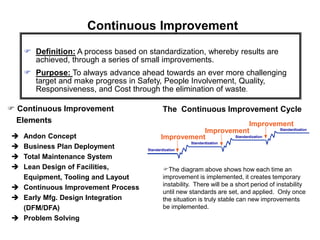
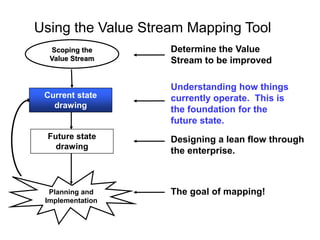
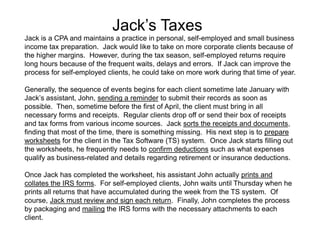
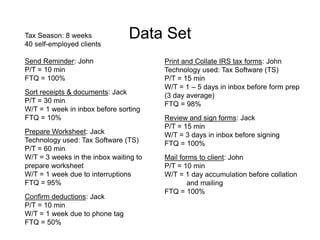
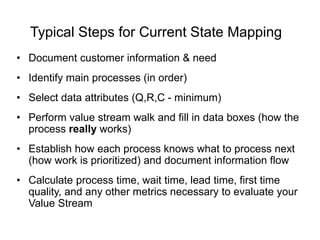
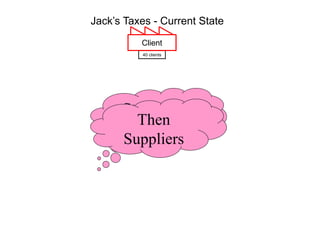
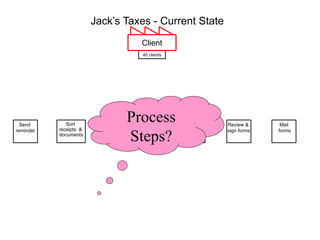
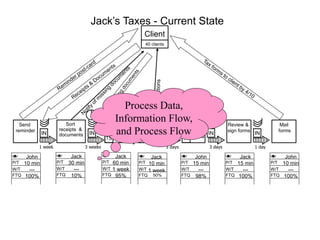
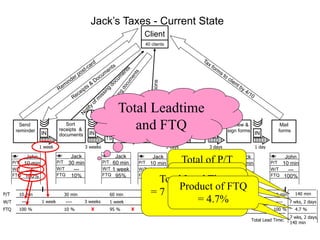
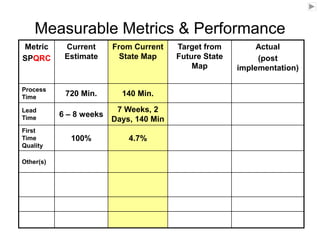
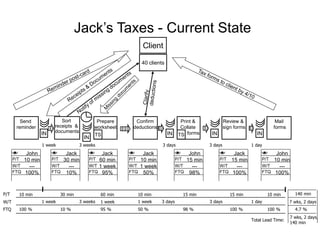
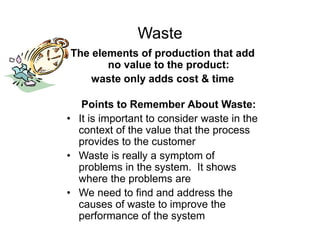
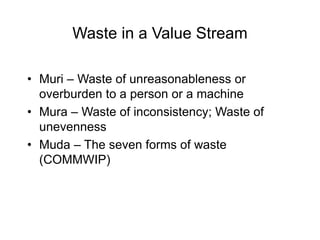
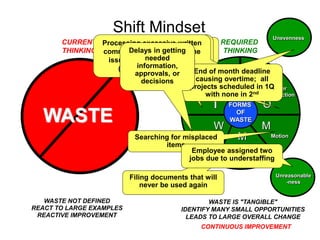
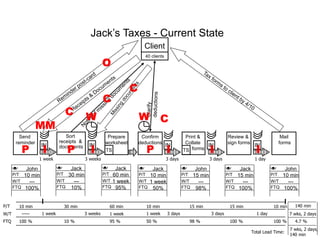
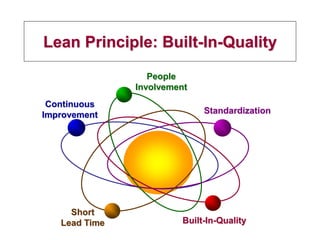
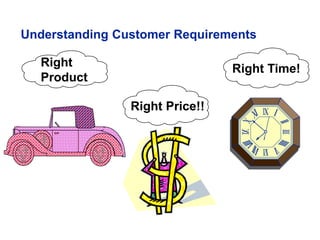
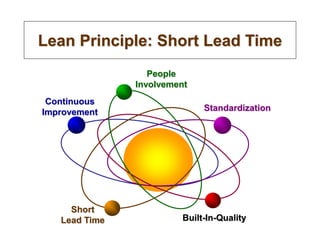
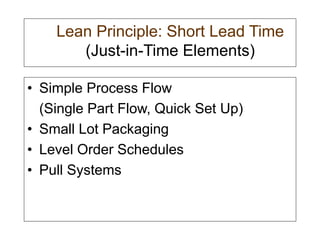
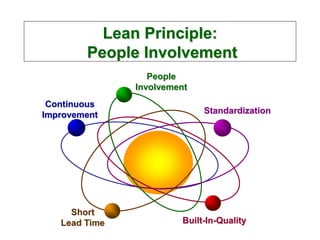
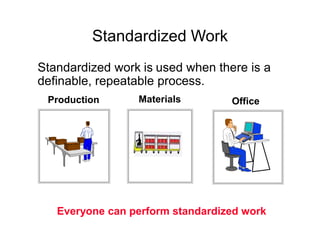
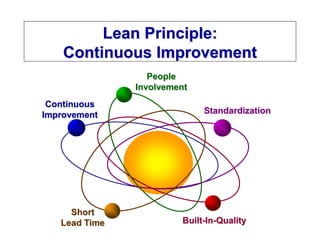
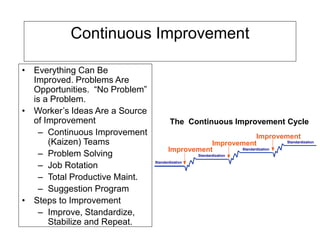
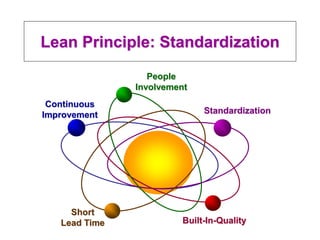
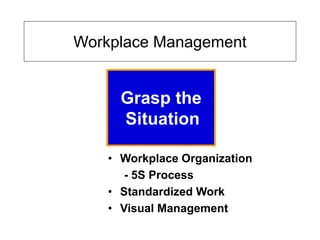
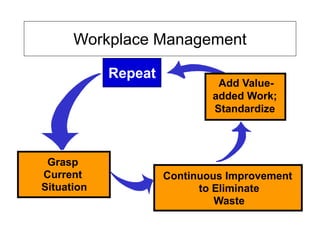
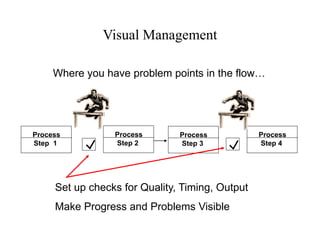
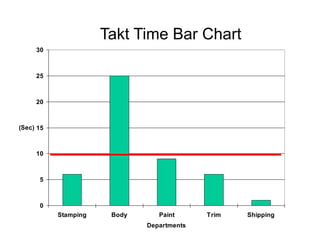
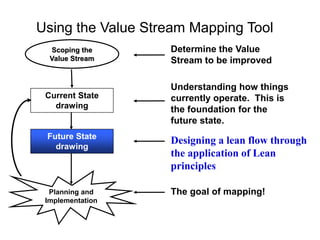
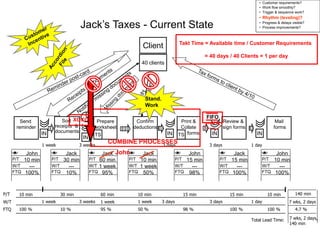
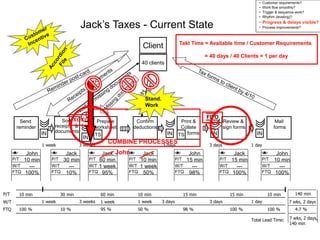
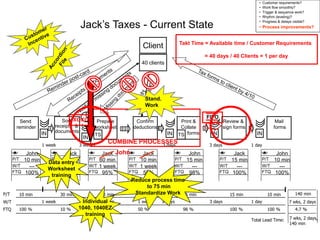
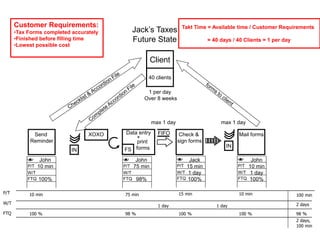
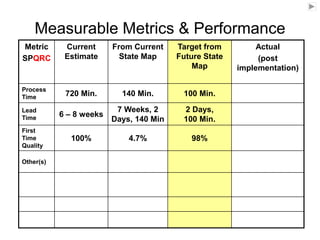
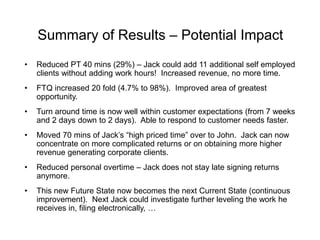
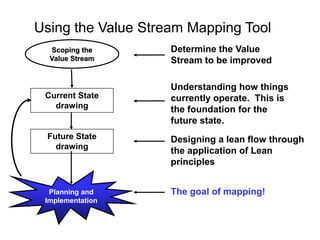
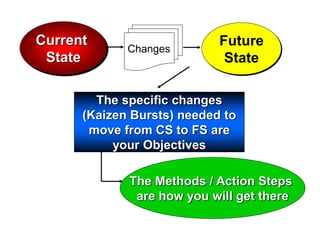
Welcome
Value Stream Mapping
Session Goals
• Provide an overview of Value Stream
Mapping
• Demonstrate Value Stream Mapping as
a tool to support Lean implementation.
• Provide an overview of Lean Principles.
Introduction
Name
Current Position
VSM Experience (if any)
What are the concepts of Lean?
• The elements for Operating
a Lean Facility
• Principles and Elements are
Interdependent
• Develops lean thinking
leaders to deliver lean
business results
Continuous
Improvement Standardization
Built-In-
Quality
Short
Lead Time
People
Involvement
 Definition: Standardization is a dynamic process by which we set
standards of terminology, principles, methods, and processes within our
organization.
 Purpose: The purpose of standardization is to stabilize, so as to achieve
a base from which to grow and improve.
Standardization
World
Class
Change
 Standardization Elements
 Management by Takt Time
 Workplace Organization
 Standardized Work
 Visual Management
Standardization
 Built-In Quality Elements
 Product Quality Standards
 Manufacturing Process Validation
 In-Process Control & Verification
 Quality Feedback/Feedforward
 Quality System Management
 Definition: The methods by which quality is built into the process, in
a way that defects are prevented, detected, and countermeasures
are implemented to prevent recurrence.
 Purpose: To ensure that defects are not passed to the customer.
Do not
Accept
Build
Ship
a Defect!
Solve problems through teamwork!
Satisfy your Customer. .
.
The Built-In-Quality Motto
Built In Quality
 Definition: The movement of product or material in the right quantity, at the
right time, to the right location, with the right equipment, at the lowest
possible cost for both the supplier and the customer.
 Purpose: To achieve customer enthusiasm by delivering the customer
his/her product more quickly, while maintaining good quality. Ultimately, our
Company benefits through cost reduction and increased customer loyalty.
 Short Lead Time Elements
 Small Lot Packaging
 Fixed Period Ordering System
 Controlled External Transportation
 Simple Process Flow
 Scheduled Shipping/Receiving
 Temporary Material Storage
 Internal Pull/Delivery
 Level Vehicle Order Schedules
 Supply Chain Management
long lead-time
short lead-time
 
Short Lead Time
 Definition: A process based on standardization, whereby results are
achieved, through a series of small improvements.
 Purpose: To always advance ahead towards an ever more challenging
target and make progress in Safety, People Involvement, Quality,
Responsiveness, and Cost through the elimination of waste.
 Continuous Improvement
Elements
 Andon Concept
 Business Plan Deployment
 Total Maintenance System
 Lean Design of Facilities,
Equipment, Tooling and Layout
 Continuous Improvement Process
 Early Mfg. Design Integration
(DFM/DFA)
 Problem Solving
The diagram above shows how each time an
improvement is implemented, it creates temporary
instability. There will be a short period of instability
until new standards are set, and applied. Only once
the situation is truly stable can new improvements
be implemented.
Continuous Improvement
The Continuous Improvement Cycle
Standardization
Improvement
Standardization
Standardization
Standardization
Improvement
Improvement
How Do We Expand VSM
Throughout the Enterprise?
• All the Principles and Elements apply, however,
there is one big difference
• In the factory, the process itself is very visible
making it easy to see, study and improve
• The processes in HR, Engineering, Purchasing,
etc... are not as visible
• What we need is a tool that will help make the
process more visible
Value Stream Mapping
• A tool originally used by the Toyota
Production System experts to study
processes
• Developed and refined by John Shook and
Mike Rother in Learning to See
• Used in manufacturing, engineering and
administrative offices by lean experts to
improve business processes
What is a Value Stream?
A value stream involves all
the steps, both value added
and non value added,
required to complete a
product or service from
beginning to end
How Does Value Stream Mapping Fit
With the Lean Journey
• VSM is a tool used
to support the
implementation of
lean strategies.
What Makes Value Stream Mapping Unique?
• Visualizes the Process Flow from a systems
perspective
• Focuses on the customer and the customer’s
requirements
• Includes information flow and product movement
• Summarizes the timeline as it relates to delivery to the
customer
• Documents performance characteristics of both the
Value Stream and the individual process steps
Process 1 Process 2
Process Time
Wait Time
FTQ
Process Time
Wait Time
FTQ
Value Stream Map Elements
Customer
XYZ Org
Supplier Orders
Customer Orders
Internal
Scheduling
Delivery
Freq.
Material
Movement
via PUSH
Delivery
Freq.
I
I
I
Supplier
Inventory
Lead Time
Value Stream Maps
Enable a System View
• Starts with a Focus on the Customer
• Links process steps and information flow
• Reveals problems with flow
• Documents performance of the process
– Customer Expectations
– Process metrics
– Visibility of progress and quality
• Reveals waste
• Establishes a common language
• Provides a blueprint for improvement
• Gets People involved in creating the future
VSM Analysis – Data Attributes
• Lead time =
– Processing time + Wait Time / Delays
• Typical batch size
• First-Time Quality
– Reliability (e.g. system or equipment uptime)
• Rework / revisions
– % Complete and Accurate Inputs (% C&A)
– Design Changes
– Errors
• Number of people involved
– % utilization of people
VSM Case Study
Using the Value Stream Mapping Tool
Understanding how things
currently operate. This is
the foundation for the
future state.
Scoping the
Value Stream
Designing a lean flow through
the enterprise.
Future state
drawing
Determine the Value
Stream to be improved
The goal of mapping!
Planning and
Implementation
Current state
drawing
Jack’s Taxes
Jack is a CPA and maintains a practice in personal, self-employed and small business
income tax preparation. Jack would like to take on more corporate clients because of
the higher margins. However, during the tax season, self-employed returns require
long hours because of the frequent waits, delays and errors. If Jack can improve the
process for self-employed clients, he could take on more work during that time of year.
Generally, the sequence of events begins for each client sometime late January with
Jack’s assistant, John, sending a reminder to submit their records as soon as
possible. Then, sometime before the first of April, the client must bring in all
necessary forms and receipts. Regular clients drop off or send their box of receipts
and tax forms from various income sources. Jack sorts the receipts and documents,
finding that most of the time, there is something missing. His next step is to prepare
worksheets for the client in the Tax Software (TS) system. Once Jack starts filling out
the worksheets, he frequently needs to confirm deductions such as what expenses
qualify as business-related and details regarding retirement or insurance deductions.
Once Jack has completed the worksheet, his assistant John actually prints and
collates the IRS forms. For self-employed clients, John waits until Thursday when he
prints all returns that have accumulated during the week from the TS system. Of
course, Jack must review and sign each return. Finally, John completes the process
by packaging and mailing the IRS forms with the necessary attachments to each
client.
Data Set
Tax Season: 8 weeks
40 self-employed clients
Send Reminder: John
P/T = 10 min
FTQ = 100%
Sort receipts & documents: Jack
P/T = 30 min
W/T = 1 week in inbox before sorting
FTQ = 10%
Prepare Worksheet: Jack
Technology used: Tax Software (TS)
P/T = 60 min
W/T = 3 weeks in the inbox waiting to
prepare worksheet
W/T = 1 week due to interruptions
FTQ = 95%
Confirm deductions: Jack
P/T = 10 min
W/T = 1 week due to phone tag
FTQ = 50%
Print and Collate IRS tax forms: John
Technology used: Tax Software (TS)
P/T = 15 min
W/T = 1 – 5 days in inbox before form prep
(3 day average)
FTQ = 98%
Review and sign forms: Jack
P/T = 15 min
W/T = 3 days in inbox before signing
FTQ = 100%
Mail forms to client: John
P/T = 10 min
W/T = 1 day accumulation before collation
and mailing
FTQ = 100%
Metric
SPQRC
Current
Estimate
From Current
State Map
Target from
Future State
Map
Actual
(post
implementation)
Process
Time
12 hours
(720 Min.)
Lead
Time 6 – 8 weeks
First
Time
Quality
100%
Other(s)
Measurable Metrics & Performance
Typical Steps for Current State Mapping
• Document customer information & need
• Identify main processes (in order)
• Select data attributes (Q,R,C - minimum)
• Perform value stream walk and fill in data boxes (how the
process really works)
• Establish how each process knows what to process next
(how work is prioritized) and document information flow
• Calculate process time, wait time, lead time, first time
quality, and any other metrics necessary to evaluate your
Value Stream
Icons
Movement by Push
Electronic Information Flow
Weekly
Schedule
Worker
In Box
(Queue)
IN
MRP
Wait-Time
Conversation Information Flow
Data Box
P/T
W/T
FTQ
Supermarket
XOXO Leveling, Mix
and/or
Volume
Withdrawal (Pull)
F I F O
First-In
First-Out
Flow
Changeover
Kaizen
Lightning
Burst
Iterations
Movement of “physical” property
Reminder post-card
Customer
Process Box
Technology Used
MRP
Draw the Current State
Jack’s Taxes - Current State
Customer
Suppliers
Start with
Customer
Then
Suppliers
40 clients
Client
Sort
receipts &
documents
Confirm
deductions
Mail
forms
Print &
Collate
forms
TS
Review &
sign forms
Send
reminder
Prepare
worksheet
TS
Process
Steps?
Jack’s Taxes - Current State
40 clients
Client
John
10 min
---
100%
Jack
60 min
1 week
95%
Jack
10 min
John
15 min
---
98%
Jack
15 min
---
100%
John
10 min
---
100%
Jack
30 min
---
10%
1 week
P/T
W/T
FTQ
P/T
W/T
FTQ
P/T
W/T
FTQ
P/T
W/T
FTQ
P/T
W/T
FTQ
P/T
W/T
FTQ
3 days
IN
3 days
IN
1 day
IN
3 weeks
Client
40 clients
Sort
receipts &
documents
Confirm
deductions
Mail
forms
Print &
Collate
forms
TS
Review &
sign forms
Send
reminder
Prepare
worksheet
TS
IN IN
Jack’s Taxes - Current State
50%
1 week
P/T
W/T
FTQ
Process Data,
Information Flow,
and Process Flow
IN IN IN IN IN
Client
40 clients
Sort
receipts &
documents
Confirm
deductions
Mail
forms
Print &
Collate
forms
TS
Review &
sign forms
Send
reminder
Prepare
worksheet
TS
John
10 min
---
100%
Jack
60 min
1 week
95%
Jack
10 min
1 week
50%
John
15 min
---
98%
Jack
15 min
---
100%
John
10 min
---
100%
Jack
30 min
---
10%
1 week 3 weeks 3 days 3 days 1 day
P/T
W/T
FTQ
P/T
W/T
FTQ
P/T
W/T
FTQ
P/T
W/T
FTQ
P/T
W/T
FTQ
P/T
W/T
FTQ
P/T
W/T
FTQ
10 min
1 week
30 min
3 weeks
60 min 10 min
3 days
15 min 15 min 10 min
3 days 1 day
1 week
100 % 98 % 100 %
50 % 100 %
95 %
10 %
1 week
140 min
7 wks, 2 days
4.7 %
Total Lead Time:
W/T
P/T
FTQ
7 wks, 2 days,
140 min
Total Leadtime
and FTQ
-----
Total of P/T
= 140 minutes
Total of W/T
= 7wks, 2days
Jack’s Taxes - Current State
X X X X X
---- ---- ---- ----
Total Lead Time
= 7 wks, 2 days, and
140 min.
Product of FTQ
= 4.7%
Metric
SPQRC
Current
Estimate
From Current
State Map
Target from
Future State
Map
Actual
(post
implementation)
Process
Time 720 Min. 140 Min.
Lead
Time 6 – 8 weeks
7 Weeks, 2
Days, 140 Min
First
Time
Quality
100% 4.7%
Other(s)
Measurable Metrics & Performance
Jack’s Taxes - Current State
IN
40 clients
Sort
receipts &
documents
Confirm
deductions
Mail
forms
IN IN
Print &
Collate
forms
TS
Review &
sign forms
IN
Send
reminder
Prepare
worksheet
TS
Client
John
10 min
---
100%
Jack
60 min
1 week
95%
Jack
10 min
1 week
50%
John
15 min
---
98%
Jack
15 min
---
100%
John
10 min
---
100%
Jack
30 min
---
10%
1 week 3 weeks 3 days 3 days 1 day
W/T
P/T 10 min
1 week
30 min
3 weeks
60 min 10 min
3 days
15 min 15 min 10 min
3 days 1 day
1 week
FTQ 100 % 98 % 100 %
50 % 100 %
95 %
10 %
1 week
140 min
7 wks, 2 days
4.7 %
Total Lead Time:
7 wks, 2 days,
140 min
P/T
W/T
FTQ
P/T
W/T
FTQ
P/T
W/T
FTQ
P/T
W/T
FTQ
P/T
W/T
FTQ
P/T
W/T
FTQ
P/T
W/T
FTQ
IN
Waste
The elements of production that add
no value to the product:
waste only adds cost & time
Points to Remember About Waste:
• It is important to consider waste in the
context of the value that the process
provides to the customer
• Waste is really a symptom of
problems in the system. It shows
where the problems are
• We need to find and address the
causes of waste to improve the
performance of the system
Waste in a Value Stream
• Muri – Waste of unreasonableness or
overburden to a person or a machine
• Mura – Waste of inconsistency; Waste of
unevenness
• Muda – The seven forms of waste
(COMMWIP)
FORMS
OF
WASTE
I
C
O
M
W
P
M
CURRENT
THINKING
WASTE NOT DEFINED
REACT TO LARGE EXAMPLES
REACTIVE IMPROVEMENT
REQUIRED
THINKING
CONTINUOUS IMPROVEMENT
Correction
Over
Production
Motion
Material
Movement
Waiting
Inventory
Processing
WASTE IS "TANGIBLE"
IDENTIFY MANY SMALL OPPORTUNITIES
LEADS TO LARGE OVERALL CHANGE
Shift Mindset
WASTE
Sending back forms for
incomplete or inaccurate data
Producing reports that are not
used, producing reports
before they are needed
Searching for misplaced
items
Filing documents that will
never be used again
Keeping multiple
copies of reports
Processing excessive written
communication to determine
issues requiring attention
(mental processing)
Unreasonable
-ness
Unevenness
Employee assigned two
jobs due to understaffing
End of month deadline
causing overtime; all
projects scheduled in 1Q
with none in 2nd
Delays in getting
needed
information,
approvals, or
decisions
Waste Exercise
Participants identify waste on
current state maps.
IN IN IN IN IN
Client
40 clients
Sort
receipts &
documents
Confirm
deductions
Mail
forms
Print &
Collate
forms
TS
Review &
sign forms
Send
reminder
Prepare
worksheet
TS
John
10 min
---
100%
Jack
60 min
1 week
95%
Jack
10 min
1 week
50%
John
15 min
---
98%
Jack
15 min
---
100%
John
10 min
---
100%
Jack
30 min
---
10%
1 week 3 weeks 3 days 3 days 1 day
P/T
W/T
FTQ
P/T
W/T
FTQ
P/T
W/T
FTQ
P/T
W/T
FTQ
P/T
W/T
FTQ
P/T
W/T
FTQ
P/T
W/T
FTQ
10 min
1 week
30 min
3 weeks
60 min 10 min
3 days
15 min 15 min 10 min
3 days 1 day
1 week
100 % 98 % 100 %
50 % 100 %
95 %
10 %
1 week
140 min
7 wks, 2 days
4.7 %
Total Lead Time:
W/T
P/T
FTQ
7 wks, 2 days,
140 min
-----
Jack’s Taxes - Current State
MM
W W
I I I I I
P
P P
C
C
C
C
O
Lean Principle: Built-In-Quality
Continuous
Improvement Standardization
Built-In-Quality
Short
Lead Time
People
Involvement
Right
Product
Right Time!
Understanding Customer Requirements
Right Price!!
Built-In-Quality
• Product Quality Standards
• In-Process Control & Verification
• Quality Feedback/Feed Forward
Product Quality Standards
• Focus On The Customer
– J.D. Power
• Quality Standards must be easily
understood by the Team members
• Quality Standards must be Clear
and Unambiguous
In Process Control & Verification
Quality Feedback / Feed Forward
Ability to signal for help when Sensing
Abnormalities
– Quality Must Be Assured In The
Process
– Error Proofing
– In-Process Verification
– Feedback / Feed Forward
Lean Principle:
Continuous Improvement
Continuous
Improvement Standardization
Built-In-Quality
Short
Lead Time
People
Involvement
Andon
ENABLERS
BENEFITS
1 2 3 4 5 6
PROCESS NO.
3
3
O.D. Reference 4
Motion
Correction
Waiting
Andon
• Implement corrective
action
• Quality in station
• Inspection and Feedback
• Open Communication
• Teamwork
• Improved Productivity
ENABLERS
BENEFITS
5
Motion
Correction
Waiting
1 2 3 4 5 6
PROCESS NO.
3
3
O.D. Reference 4
Andon
•Team System
•Team Leader Ratio
•Clear Standards
•Problem Solving Process
•Employee Training
•Standardized Work
•Mutual Trust/Respect
•Process Capability
• Implement corrective
action
• Quality in station
• Inspection and Feedback
• Open Communication
• Teamwork
• Improved Productivity
ENABLERS
BENEFITS
Motion
Correction
Waiting
1 2 3
4
5 6
PROCESS NO.
3
3
O.D. Reference 4
4
Lean Principle: Short Lead Time
Continuous
Improvement Standardization
Built-In-Quality
Short
Lead Time
People
Involvement
Lean Principle: Short Lead Time
(Just-in-Time Elements)
• Simple Process Flow
(Single Part Flow, Quick Set Up)
• Small Lot Packaging
• Level Order Schedules
• Pull Systems
Flow
All process steps
occur in tight
sequence
(continuous flow),
with little or no
waiting?
Pull
Each process step
occurs only at the
command of the
downstream step in
response to the pull of
the internal customer.
TRY TO SCHEDULE ONLY 1 POINT
FLOW WHERE YOU CAN, PULL WHERE YOU CAN’T
Schedule
Supermarket
Schedule
CONTINUOUS FLOW PROCESSING
Batch & Push Processing
Continuous Flow “make one, move one”
3 Minutes for first piece
12 Minutes for total order
21 minutes for first piece
One Piece Flow - Order entry - Before
File
Batch
Enter
Batch
Stack and
Hold
Acknowledge
Orders
Calculate Batch
Total
Batch
Orders
Open
Mail
One Piece Flow - Order Entry – After
File
Order
Enter
One
Order
Acknowledge
One Order
Open One
Envelope
Leveling - Heijunka
• Uneven customer demand
creates a challenge
• Variation & fluctuation in
volume (spiky customer
demand) can lead to waste
• In a multi-product
environment, demand
leveling (heijunka) absorbs
fluctuation & variation
Production Schedule
Monday…….400 A
Tuesday……100 A, 300 B
Wednesday..200 B, 200 C
Thursday…. .400 C
Friday……….200 C, 200 A
No Good
Daily:
140 A, 100 B, 160 C
Better: Every Part Every Day
50 B, 70 A, 80 C 50 B, 70 A, 80 C
Monday
Even Better: Every Part Every Ship Window
Leveling
Why have small lots and leveling?
• Small Lot Strategy
– Shortens Cycle Time (The amount of time it
takes to complete the task)
– Reduces Excess Inventory
– Improves Responsiveness
• Production Leveling
– Minimizes Stocks of Finished Products
– Reduces Fluctuations in Flow
– Balances Workload
Lean Principle:
People Involvement
Continuous
Improvement Standardization
Built-In-Quality
Short
Lead Time
People
Involvement
Multifunctional Workers
• Minimal (or no) Job
Description Silos
• Rotate Jobs
• Perform Several Tasks
• Balance the Workload
• Standard Work
Lean Principle: Standardization
Continuous
Improvement Standardization
Built-In-Quality
Short
Lead Time
People
Involvement
If there is no standard,
there is no improvement
Standardized Work
• The best combination of
people, equipment and material
to meet customer demand.
• An agreed upon set of work
procedures to establish the
best sequence for each
process.
• Start at a baseline and
continuously improve
Materials
Production
Standardized Work
Standardized work is used when there is a
definable, repeatable process.
Office
Everyone can perform standardized work
Standardized work yields:
• Shorter lead time
• Reduced work-in-process
• Reduced wait time
• More flexibility, less waste
• Ability to identify and fix
problems
• Reduced handling
• Better response to
customer demand
• Balanced workload
TAKT TIME – Component of Standardized Work
Synchronizes Pace of Production
to Match Pace of Demand
Rate for producing a product,
and its components, based on rate of delivery.
Available Time
Takt Time =
Customer Requirement / Demand
Lean Principle:
Continuous Improvement
Continuous
Improvement Standardization
Built-In-Quality
Short
Lead Time
People
Involvement
Continuous Improvement
• Everything Can Be
Improved. Problems Are
Opportunities. “No Problem”
is a Problem.
• Worker’s Ideas Are a Source
of Improvement
– Continuous Improvement
(Kaizen) Teams
– Problem Solving
– Job Rotation
– Total Productive Maint.
– Suggestion Program
• Steps to Improvement
– Improve, Standardize,
Stabilize and Repeat.
The Continuous Improvement Cycle
Standardization
Improvement
Standardization
Standardization
Standardization
Improvement
Improvement
Continuous Improvement
• Standardized Work contributes to continuous
improvement by:
– Documenting the current best practice that provides
a base from which to improve
– Creating the stability necessary to make changes
– Providing the tools to make waste highly visible
Lean Principle: Standardization
Continuous
Improvement Standardization
Built-In-Quality
Short
Lead Time
People
Involvement
• Workplace Organization
- 5S Process
• Standardized Work
• Visual Management
Grasp the
Situation
Workplace Management
Grasp
Current
Situation
Continuous Improvement
to Eliminate
Waste
Repeat
Add Value-
added Work;
Standardize
Workplace Management
Where you have problem points in the flow…
Process
Step 1
Process
Step 2
Process
Step 3
Process
Step 4
Set up checks for Quality, Timing, Output
Make Progress and Problems Visible
Visual Management
E-Toyota
Application of Heijunka Box
Takt Time Bar Chart
0
5
10
15
20
25
30
Stamping Body Paint Trim Shipping
Departments
(Sec)
Future State Questions
Relating to Improving Delivery and Flow
• What are the customer requirements?
• Where and how will you trigger and sequence work?
• How will you make work flow smoothly?
• How will you establish rhythm to pace the work and
surface problems?
• How will you make the progress and delays of the work
visible?
• What process improvements are necessary to achieve
your Value Stream vision?
Future State Mapping
Using the Value Stream Mapping Tool
Understanding how things
currently operate. This is
the foundation for the
future state.
Designing a lean flow through
the application of Lean
principles
Current State
drawing
Future State
drawing
Determine the Value
Stream to be improved
The goal of mapping!
Planning and
Implementation
Scoping the
Value Stream
Future State Questions
Relating to Improving Delivery and Flow
• What are the customer requirements?
• Where and how will you trigger and sequence work?
• How will you make work flow smoothly?
• How will you establish rhythm to pace the work and
surface problems?
• How will you make the progress and delays of the work
visible?
• What process improvements are necessary to achieve
your Value Stream vision?
• Customer requirements?
• Work flow smoothly?
• Trigger & sequence work?
• Rhythm (leveling)?
• Progress & delays visible?
• Process improvements?
Jack’s Taxes - Current State
IN
40 clients
Sort
receipts &
documents
Confirm
deductions
Mail
forms
IN IN
Print &
Collate
forms
TS
Review &
sign forms
IN
Send
reminder
Prepare
worksheet
TS
Client
John
10 min
---
100%
Jack
60 min
1 week
95%
Jack
10 min
1 week
50%
John
15 min
---
98%
Jack
15 min
---
100%
John
10 min
---
100%
Jack
30 min
---
10%
1 week 3 weeks 3 days 3 days 1 day
W/T
P/T 10 min
1 week
30 min
3 weeks
60 min 10 min
3 days
15 min 15 min 10 min
3 days 1 day
1 week
FTQ 100 % 98 % 100 %
50 % 100 %
95 %
10 %
1 week
140 min
7 wks, 2 days
4.7 %
Total Lead Time: 7 wks, 2 days,
140 min
P/T
W/T
FTQ
P/T
W/T
FTQ
P/T
W/T
FTQ
P/T
W/T
FTQ
P/T
W/T
FTQ
P/T
W/T
FTQ
P/T
W/T
FTQ
Takt Time = Available time / Customer Requirements
= 40 days / 40 Clients = 1 per day
IN
COMBINE PROCESSES
Stand.
Work
John
XOXO
FIFO
Data entry
Worksheet
training
Individual
1040, 1040EZ
training
Reduce process time
to 75 min
Standardize Work
IN
40 clients
Mail forms
Jack’s Taxes
Future State
Check &
sign forms
IN
Send
Reminder
Data entry
+
print
forms
FS
Client
FIFO
max 1 day max 1 day
XOXO
1 per day
Over 8 weeks
Takt Time = Available time / Customer Requirements
= 40 days / 40 Clients = 1 per day
Customer Requirements:
•Tax Forms completed accurately
•Finished before filling time
•Lowest possible cost
W/T
P/T
FTQ
100 min
2 days
98 %
2 days,
100 min
10 min 75 min 15 min 10 min
1 day
1 day
P/T
W/T
FTQ
P/T
W/T
FTQ
P/T
W/T
FTQ
P/T
W/T
FTQ
John
10 min
100%
John
75 min
98%
Jack
15 min
1 day
100%
John
10 min
1 day
100%
98 % 100 %
100 %
100 %
Metric
SPQRC
Current
Estimate
From Current
State Map
Target from
Future State
Map
Actual
(post
implementation)
Process
Time 720 Min. 140 Min. 100 Min.
Lead
Time 6 – 8 weeks
7 Weeks, 2
Days, 140 Min
2 Days,
100 Min.
First
Time
Quality
100% 4.7% 98%
Other(s)
Measurable Metrics & Performance
Summary of Results – Potential Impact
• Reduced PT 40 mins (29%) – Jack could add 11 additional self employed
clients without adding work hours! Increased revenue, no more time.
• FTQ increased 20 fold (4.7% to 98%). Improved area of greatest
opportunity.
• Turn around time is now well within customer expectations (from 7 weeks
and 2 days down to 2 days). Able to respond to customer needs faster.
• Moved 70 mins of Jack’s “high priced time” over to John. Jack can now
concentrate on more complicated returns or on obtaining more higher
revenue generating corporate clients.
• Reduced personal overtime – Jack does not stay late signing returns
anymore.
• This new Future State now becomes the next Current State (continuous
improvement). Next Jack could investigate further leveling the work he
receives in, filing electronically, …
Implementation Planning
Understanding how things
currently operate. This is
the foundation for the
future state.
Designing a lean flow through
the application of Lean
principles
Current State
drawing
Future State
drawing
Determine the Value
Stream to be improved
The goal of mapping!
Planning and
Implementation
Scoping the
Value Stream
Using the Value Stream Mapping Tool
Current
State
The Methods / Action Steps
are how you will get there
Future
State
Changes
The specific changes
(Kaizen Bursts) needed to
move from CS to FS are
your Objectives
Business Plan Deployment
(BPD) is the Standard
Process that enables the
total organization to set
targets, integrate plans,
and remain focused to
achieve company-wide
goals and manage change
Concrete
GOALS
Specific OBJECTIVES
Clear & Measurable TARGETS
A METHOD to reach the targets / GAP CLOSURE PLAN and Strategies
Common Measurements
BPD Elements
Business Plan Deployment
Is a PDCA Cycle
2
Tasks
Plant Master Plan
A
c
ti
o
n
Annual
Business
Plan
1
2
3
4 Plan
Do (Communicate & Implement)
Check
Act (Standardized & Countermeasures)
Scorecard
Plan
Do
Check
Act
Problem Description
Direct Cause
Cause
Cause
Cause
Why?
Why?
Why?
Why?
Why?
Root
Cause
Plan
Do
Check
Act TEACH!
Leadership’s Role
Wrap-Up
Wrap-up
• What did you learn today?
• Did the program meet your
expectations?
• How can we improve this learning
event?

documents.pub_value-stream-mapping-training.ppt

  • 1.
  • 2.
    Session Goals • Providean overview of Value Stream Mapping • Demonstrate Value Stream Mapping as a tool to support Lean implementation. • Provide an overview of Lean Principles.
  • 3.
  • 4.
    What are theconcepts of Lean? • The elements for Operating a Lean Facility • Principles and Elements are Interdependent • Develops lean thinking leaders to deliver lean business results Continuous Improvement Standardization Built-In- Quality Short Lead Time People Involvement
  • 5.
     Definition: Standardizationis a dynamic process by which we set standards of terminology, principles, methods, and processes within our organization.  Purpose: The purpose of standardization is to stabilize, so as to achieve a base from which to grow and improve. Standardization World Class Change  Standardization Elements  Management by Takt Time  Workplace Organization  Standardized Work  Visual Management Standardization
  • 6.
     Built-In QualityElements  Product Quality Standards  Manufacturing Process Validation  In-Process Control & Verification  Quality Feedback/Feedforward  Quality System Management  Definition: The methods by which quality is built into the process, in a way that defects are prevented, detected, and countermeasures are implemented to prevent recurrence.  Purpose: To ensure that defects are not passed to the customer. Do not Accept Build Ship a Defect! Solve problems through teamwork! Satisfy your Customer. . . The Built-In-Quality Motto Built In Quality
  • 7.
     Definition: Themovement of product or material in the right quantity, at the right time, to the right location, with the right equipment, at the lowest possible cost for both the supplier and the customer.  Purpose: To achieve customer enthusiasm by delivering the customer his/her product more quickly, while maintaining good quality. Ultimately, our Company benefits through cost reduction and increased customer loyalty.  Short Lead Time Elements  Small Lot Packaging  Fixed Period Ordering System  Controlled External Transportation  Simple Process Flow  Scheduled Shipping/Receiving  Temporary Material Storage  Internal Pull/Delivery  Level Vehicle Order Schedules  Supply Chain Management long lead-time short lead-time   Short Lead Time
  • 8.
     Definition: Aprocess based on standardization, whereby results are achieved, through a series of small improvements.  Purpose: To always advance ahead towards an ever more challenging target and make progress in Safety, People Involvement, Quality, Responsiveness, and Cost through the elimination of waste.  Continuous Improvement Elements  Andon Concept  Business Plan Deployment  Total Maintenance System  Lean Design of Facilities, Equipment, Tooling and Layout  Continuous Improvement Process  Early Mfg. Design Integration (DFM/DFA)  Problem Solving The diagram above shows how each time an improvement is implemented, it creates temporary instability. There will be a short period of instability until new standards are set, and applied. Only once the situation is truly stable can new improvements be implemented. Continuous Improvement The Continuous Improvement Cycle Standardization Improvement Standardization Standardization Standardization Improvement Improvement
  • 9.
    How Do WeExpand VSM Throughout the Enterprise? • All the Principles and Elements apply, however, there is one big difference • In the factory, the process itself is very visible making it easy to see, study and improve • The processes in HR, Engineering, Purchasing, etc... are not as visible • What we need is a tool that will help make the process more visible
  • 10.
    Value Stream Mapping •A tool originally used by the Toyota Production System experts to study processes • Developed and refined by John Shook and Mike Rother in Learning to See • Used in manufacturing, engineering and administrative offices by lean experts to improve business processes
  • 11.
    What is aValue Stream? A value stream involves all the steps, both value added and non value added, required to complete a product or service from beginning to end
  • 12.
    How Does ValueStream Mapping Fit With the Lean Journey • VSM is a tool used to support the implementation of lean strategies.
  • 13.
    What Makes ValueStream Mapping Unique? • Visualizes the Process Flow from a systems perspective • Focuses on the customer and the customer’s requirements • Includes information flow and product movement • Summarizes the timeline as it relates to delivery to the customer • Documents performance characteristics of both the Value Stream and the individual process steps
  • 14.
    Process 1 Process2 Process Time Wait Time FTQ Process Time Wait Time FTQ Value Stream Map Elements Customer XYZ Org Supplier Orders Customer Orders Internal Scheduling Delivery Freq. Material Movement via PUSH Delivery Freq. I I I Supplier Inventory Lead Time
  • 15.
    Value Stream Maps Enablea System View • Starts with a Focus on the Customer • Links process steps and information flow • Reveals problems with flow • Documents performance of the process – Customer Expectations – Process metrics – Visibility of progress and quality • Reveals waste • Establishes a common language • Provides a blueprint for improvement • Gets People involved in creating the future
  • 16.
    VSM Analysis –Data Attributes • Lead time = – Processing time + Wait Time / Delays • Typical batch size • First-Time Quality – Reliability (e.g. system or equipment uptime) • Rework / revisions – % Complete and Accurate Inputs (% C&A) – Design Changes – Errors • Number of people involved – % utilization of people
  • 17.
  • 18.
    Using the ValueStream Mapping Tool Understanding how things currently operate. This is the foundation for the future state. Scoping the Value Stream Designing a lean flow through the enterprise. Future state drawing Determine the Value Stream to be improved The goal of mapping! Planning and Implementation Current state drawing
  • 19.
    Jack’s Taxes Jack isa CPA and maintains a practice in personal, self-employed and small business income tax preparation. Jack would like to take on more corporate clients because of the higher margins. However, during the tax season, self-employed returns require long hours because of the frequent waits, delays and errors. If Jack can improve the process for self-employed clients, he could take on more work during that time of year. Generally, the sequence of events begins for each client sometime late January with Jack’s assistant, John, sending a reminder to submit their records as soon as possible. Then, sometime before the first of April, the client must bring in all necessary forms and receipts. Regular clients drop off or send their box of receipts and tax forms from various income sources. Jack sorts the receipts and documents, finding that most of the time, there is something missing. His next step is to prepare worksheets for the client in the Tax Software (TS) system. Once Jack starts filling out the worksheets, he frequently needs to confirm deductions such as what expenses qualify as business-related and details regarding retirement or insurance deductions. Once Jack has completed the worksheet, his assistant John actually prints and collates the IRS forms. For self-employed clients, John waits until Thursday when he prints all returns that have accumulated during the week from the TS system. Of course, Jack must review and sign each return. Finally, John completes the process by packaging and mailing the IRS forms with the necessary attachments to each client.
  • 20.
    Data Set Tax Season:8 weeks 40 self-employed clients Send Reminder: John P/T = 10 min FTQ = 100% Sort receipts & documents: Jack P/T = 30 min W/T = 1 week in inbox before sorting FTQ = 10% Prepare Worksheet: Jack Technology used: Tax Software (TS) P/T = 60 min W/T = 3 weeks in the inbox waiting to prepare worksheet W/T = 1 week due to interruptions FTQ = 95% Confirm deductions: Jack P/T = 10 min W/T = 1 week due to phone tag FTQ = 50% Print and Collate IRS tax forms: John Technology used: Tax Software (TS) P/T = 15 min W/T = 1 – 5 days in inbox before form prep (3 day average) FTQ = 98% Review and sign forms: Jack P/T = 15 min W/T = 3 days in inbox before signing FTQ = 100% Mail forms to client: John P/T = 10 min W/T = 1 day accumulation before collation and mailing FTQ = 100%
  • 21.
    Metric SPQRC Current Estimate From Current State Map Targetfrom Future State Map Actual (post implementation) Process Time 12 hours (720 Min.) Lead Time 6 – 8 weeks First Time Quality 100% Other(s) Measurable Metrics & Performance
  • 22.
    Typical Steps forCurrent State Mapping • Document customer information & need • Identify main processes (in order) • Select data attributes (Q,R,C - minimum) • Perform value stream walk and fill in data boxes (how the process really works) • Establish how each process knows what to process next (how work is prioritized) and document information flow • Calculate process time, wait time, lead time, first time quality, and any other metrics necessary to evaluate your Value Stream
  • 23.
    Icons Movement by Push ElectronicInformation Flow Weekly Schedule Worker In Box (Queue) IN MRP Wait-Time Conversation Information Flow Data Box P/T W/T FTQ Supermarket XOXO Leveling, Mix and/or Volume Withdrawal (Pull) F I F O First-In First-Out Flow Changeover Kaizen Lightning Burst Iterations Movement of “physical” property Reminder post-card Customer Process Box Technology Used MRP
  • 24.
  • 25.
    Jack’s Taxes -Current State Customer Suppliers Start with Customer Then Suppliers 40 clients Client
  • 26.
    Sort receipts & documents Confirm deductions Mail forms Print & Collate forms TS Review& sign forms Send reminder Prepare worksheet TS Process Steps? Jack’s Taxes - Current State 40 clients Client
  • 27.
    John 10 min --- 100% Jack 60 min 1week 95% Jack 10 min John 15 min --- 98% Jack 15 min --- 100% John 10 min --- 100% Jack 30 min --- 10% 1 week P/T W/T FTQ P/T W/T FTQ P/T W/T FTQ P/T W/T FTQ P/T W/T FTQ P/T W/T FTQ 3 days IN 3 days IN 1 day IN 3 weeks Client 40 clients Sort receipts & documents Confirm deductions Mail forms Print & Collate forms TS Review & sign forms Send reminder Prepare worksheet TS IN IN Jack’s Taxes - Current State 50% 1 week P/T W/T FTQ Process Data, Information Flow, and Process Flow
  • 28.
    IN IN ININ IN Client 40 clients Sort receipts & documents Confirm deductions Mail forms Print & Collate forms TS Review & sign forms Send reminder Prepare worksheet TS John 10 min --- 100% Jack 60 min 1 week 95% Jack 10 min 1 week 50% John 15 min --- 98% Jack 15 min --- 100% John 10 min --- 100% Jack 30 min --- 10% 1 week 3 weeks 3 days 3 days 1 day P/T W/T FTQ P/T W/T FTQ P/T W/T FTQ P/T W/T FTQ P/T W/T FTQ P/T W/T FTQ P/T W/T FTQ 10 min 1 week 30 min 3 weeks 60 min 10 min 3 days 15 min 15 min 10 min 3 days 1 day 1 week 100 % 98 % 100 % 50 % 100 % 95 % 10 % 1 week 140 min 7 wks, 2 days 4.7 % Total Lead Time: W/T P/T FTQ 7 wks, 2 days, 140 min Total Leadtime and FTQ ----- Total of P/T = 140 minutes Total of W/T = 7wks, 2days Jack’s Taxes - Current State X X X X X ---- ---- ---- ---- Total Lead Time = 7 wks, 2 days, and 140 min. Product of FTQ = 4.7%
  • 29.
    Metric SPQRC Current Estimate From Current State Map Targetfrom Future State Map Actual (post implementation) Process Time 720 Min. 140 Min. Lead Time 6 – 8 weeks 7 Weeks, 2 Days, 140 Min First Time Quality 100% 4.7% Other(s) Measurable Metrics & Performance
  • 30.
    Jack’s Taxes -Current State IN 40 clients Sort receipts & documents Confirm deductions Mail forms IN IN Print & Collate forms TS Review & sign forms IN Send reminder Prepare worksheet TS Client John 10 min --- 100% Jack 60 min 1 week 95% Jack 10 min 1 week 50% John 15 min --- 98% Jack 15 min --- 100% John 10 min --- 100% Jack 30 min --- 10% 1 week 3 weeks 3 days 3 days 1 day W/T P/T 10 min 1 week 30 min 3 weeks 60 min 10 min 3 days 15 min 15 min 10 min 3 days 1 day 1 week FTQ 100 % 98 % 100 % 50 % 100 % 95 % 10 % 1 week 140 min 7 wks, 2 days 4.7 % Total Lead Time: 7 wks, 2 days, 140 min P/T W/T FTQ P/T W/T FTQ P/T W/T FTQ P/T W/T FTQ P/T W/T FTQ P/T W/T FTQ P/T W/T FTQ IN
  • 31.
    Waste The elements ofproduction that add no value to the product: waste only adds cost & time Points to Remember About Waste: • It is important to consider waste in the context of the value that the process provides to the customer • Waste is really a symptom of problems in the system. It shows where the problems are • We need to find and address the causes of waste to improve the performance of the system
  • 32.
    Waste in aValue Stream • Muri – Waste of unreasonableness or overburden to a person or a machine • Mura – Waste of inconsistency; Waste of unevenness • Muda – The seven forms of waste (COMMWIP)
  • 33.
    FORMS OF WASTE I C O M W P M CURRENT THINKING WASTE NOT DEFINED REACTTO LARGE EXAMPLES REACTIVE IMPROVEMENT REQUIRED THINKING CONTINUOUS IMPROVEMENT Correction Over Production Motion Material Movement Waiting Inventory Processing WASTE IS "TANGIBLE" IDENTIFY MANY SMALL OPPORTUNITIES LEADS TO LARGE OVERALL CHANGE Shift Mindset WASTE Sending back forms for incomplete or inaccurate data Producing reports that are not used, producing reports before they are needed Searching for misplaced items Filing documents that will never be used again Keeping multiple copies of reports Processing excessive written communication to determine issues requiring attention (mental processing) Unreasonable -ness Unevenness Employee assigned two jobs due to understaffing End of month deadline causing overtime; all projects scheduled in 1Q with none in 2nd Delays in getting needed information, approvals, or decisions
  • 34.
    Waste Exercise Participants identifywaste on current state maps.
  • 35.
    IN IN ININ IN Client 40 clients Sort receipts & documents Confirm deductions Mail forms Print & Collate forms TS Review & sign forms Send reminder Prepare worksheet TS John 10 min --- 100% Jack 60 min 1 week 95% Jack 10 min 1 week 50% John 15 min --- 98% Jack 15 min --- 100% John 10 min --- 100% Jack 30 min --- 10% 1 week 3 weeks 3 days 3 days 1 day P/T W/T FTQ P/T W/T FTQ P/T W/T FTQ P/T W/T FTQ P/T W/T FTQ P/T W/T FTQ P/T W/T FTQ 10 min 1 week 30 min 3 weeks 60 min 10 min 3 days 15 min 15 min 10 min 3 days 1 day 1 week 100 % 98 % 100 % 50 % 100 % 95 % 10 % 1 week 140 min 7 wks, 2 days 4.7 % Total Lead Time: W/T P/T FTQ 7 wks, 2 days, 140 min ----- Jack’s Taxes - Current State MM W W I I I I I P P P C C C C O
  • 36.
    Lean Principle: Built-In-Quality Continuous ImprovementStandardization Built-In-Quality Short Lead Time People Involvement
  • 37.
  • 38.
    Built-In-Quality • Product QualityStandards • In-Process Control & Verification • Quality Feedback/Feed Forward
  • 39.
    Product Quality Standards •Focus On The Customer – J.D. Power • Quality Standards must be easily understood by the Team members • Quality Standards must be Clear and Unambiguous
  • 40.
    In Process Control& Verification Quality Feedback / Feed Forward Ability to signal for help when Sensing Abnormalities – Quality Must Be Assured In The Process – Error Proofing – In-Process Verification – Feedback / Feed Forward
  • 41.
    Lean Principle: Continuous Improvement Continuous ImprovementStandardization Built-In-Quality Short Lead Time People Involvement
  • 42.
    Andon ENABLERS BENEFITS 1 2 34 5 6 PROCESS NO. 3 3 O.D. Reference 4 Motion Correction Waiting
  • 43.
    Andon • Implement corrective action •Quality in station • Inspection and Feedback • Open Communication • Teamwork • Improved Productivity ENABLERS BENEFITS 5 Motion Correction Waiting 1 2 3 4 5 6 PROCESS NO. 3 3 O.D. Reference 4
  • 44.
    Andon •Team System •Team LeaderRatio •Clear Standards •Problem Solving Process •Employee Training •Standardized Work •Mutual Trust/Respect •Process Capability • Implement corrective action • Quality in station • Inspection and Feedback • Open Communication • Teamwork • Improved Productivity ENABLERS BENEFITS Motion Correction Waiting 1 2 3 4 5 6 PROCESS NO. 3 3 O.D. Reference 4 4
  • 45.
    Lean Principle: ShortLead Time Continuous Improvement Standardization Built-In-Quality Short Lead Time People Involvement
  • 46.
    Lean Principle: ShortLead Time (Just-in-Time Elements) • Simple Process Flow (Single Part Flow, Quick Set Up) • Small Lot Packaging • Level Order Schedules • Pull Systems
  • 47.
    Flow All process steps occurin tight sequence (continuous flow), with little or no waiting?
  • 48.
    Pull Each process step occursonly at the command of the downstream step in response to the pull of the internal customer.
  • 49.
    TRY TO SCHEDULEONLY 1 POINT FLOW WHERE YOU CAN, PULL WHERE YOU CAN’T Schedule Supermarket Schedule
  • 50.
    CONTINUOUS FLOW PROCESSING Batch& Push Processing Continuous Flow “make one, move one” 3 Minutes for first piece 12 Minutes for total order 21 minutes for first piece
  • 51.
    One Piece Flow- Order entry - Before File Batch Enter Batch Stack and Hold Acknowledge Orders Calculate Batch Total Batch Orders Open Mail
  • 52.
    One Piece Flow- Order Entry – After File Order Enter One Order Acknowledge One Order Open One Envelope
  • 53.
    Leveling - Heijunka •Uneven customer demand creates a challenge • Variation & fluctuation in volume (spiky customer demand) can lead to waste • In a multi-product environment, demand leveling (heijunka) absorbs fluctuation & variation
  • 54.
    Production Schedule Monday…….400 A Tuesday……100A, 300 B Wednesday..200 B, 200 C Thursday…. .400 C Friday……….200 C, 200 A No Good Daily: 140 A, 100 B, 160 C Better: Every Part Every Day 50 B, 70 A, 80 C 50 B, 70 A, 80 C Monday Even Better: Every Part Every Ship Window Leveling
  • 55.
    Why have smalllots and leveling? • Small Lot Strategy – Shortens Cycle Time (The amount of time it takes to complete the task) – Reduces Excess Inventory – Improves Responsiveness • Production Leveling – Minimizes Stocks of Finished Products – Reduces Fluctuations in Flow – Balances Workload
  • 56.
    Lean Principle: People Involvement Continuous ImprovementStandardization Built-In-Quality Short Lead Time People Involvement
  • 57.
    Multifunctional Workers • Minimal(or no) Job Description Silos • Rotate Jobs • Perform Several Tasks • Balance the Workload • Standard Work
  • 58.
    Lean Principle: Standardization Continuous ImprovementStandardization Built-In-Quality Short Lead Time People Involvement
  • 59.
    If there isno standard, there is no improvement Standardized Work • The best combination of people, equipment and material to meet customer demand. • An agreed upon set of work procedures to establish the best sequence for each process. • Start at a baseline and continuously improve
  • 60.
    Materials Production Standardized Work Standardized workis used when there is a definable, repeatable process. Office Everyone can perform standardized work
  • 61.
    Standardized work yields: •Shorter lead time • Reduced work-in-process • Reduced wait time • More flexibility, less waste • Ability to identify and fix problems • Reduced handling • Better response to customer demand • Balanced workload
  • 62.
    TAKT TIME –Component of Standardized Work Synchronizes Pace of Production to Match Pace of Demand Rate for producing a product, and its components, based on rate of delivery. Available Time Takt Time = Customer Requirement / Demand
  • 63.
    Lean Principle: Continuous Improvement Continuous ImprovementStandardization Built-In-Quality Short Lead Time People Involvement
  • 64.
    Continuous Improvement • EverythingCan Be Improved. Problems Are Opportunities. “No Problem” is a Problem. • Worker’s Ideas Are a Source of Improvement – Continuous Improvement (Kaizen) Teams – Problem Solving – Job Rotation – Total Productive Maint. – Suggestion Program • Steps to Improvement – Improve, Standardize, Stabilize and Repeat. The Continuous Improvement Cycle Standardization Improvement Standardization Standardization Standardization Improvement Improvement
  • 65.
    Continuous Improvement • StandardizedWork contributes to continuous improvement by: – Documenting the current best practice that provides a base from which to improve – Creating the stability necessary to make changes – Providing the tools to make waste highly visible
  • 66.
    Lean Principle: Standardization Continuous ImprovementStandardization Built-In-Quality Short Lead Time People Involvement
  • 67.
    • Workplace Organization -5S Process • Standardized Work • Visual Management Grasp the Situation Workplace Management
  • 68.
    Grasp Current Situation Continuous Improvement to Eliminate Waste Repeat AddValue- added Work; Standardize Workplace Management
  • 69.
    Where you haveproblem points in the flow… Process Step 1 Process Step 2 Process Step 3 Process Step 4 Set up checks for Quality, Timing, Output Make Progress and Problems Visible Visual Management
  • 70.
  • 71.
    Takt Time BarChart 0 5 10 15 20 25 30 Stamping Body Paint Trim Shipping Departments (Sec)
  • 72.
    Future State Questions Relatingto Improving Delivery and Flow • What are the customer requirements? • Where and how will you trigger and sequence work? • How will you make work flow smoothly? • How will you establish rhythm to pace the work and surface problems? • How will you make the progress and delays of the work visible? • What process improvements are necessary to achieve your Value Stream vision?
  • 73.
  • 74.
    Using the ValueStream Mapping Tool Understanding how things currently operate. This is the foundation for the future state. Designing a lean flow through the application of Lean principles Current State drawing Future State drawing Determine the Value Stream to be improved The goal of mapping! Planning and Implementation Scoping the Value Stream
  • 75.
    Future State Questions Relatingto Improving Delivery and Flow • What are the customer requirements? • Where and how will you trigger and sequence work? • How will you make work flow smoothly? • How will you establish rhythm to pace the work and surface problems? • How will you make the progress and delays of the work visible? • What process improvements are necessary to achieve your Value Stream vision?
  • 76.
    • Customer requirements? •Work flow smoothly? • Trigger & sequence work? • Rhythm (leveling)? • Progress & delays visible? • Process improvements? Jack’s Taxes - Current State IN 40 clients Sort receipts & documents Confirm deductions Mail forms IN IN Print & Collate forms TS Review & sign forms IN Send reminder Prepare worksheet TS Client John 10 min --- 100% Jack 60 min 1 week 95% Jack 10 min 1 week 50% John 15 min --- 98% Jack 15 min --- 100% John 10 min --- 100% Jack 30 min --- 10% 1 week 3 weeks 3 days 3 days 1 day W/T P/T 10 min 1 week 30 min 3 weeks 60 min 10 min 3 days 15 min 15 min 10 min 3 days 1 day 1 week FTQ 100 % 98 % 100 % 50 % 100 % 95 % 10 % 1 week 140 min 7 wks, 2 days 4.7 % Total Lead Time: 7 wks, 2 days, 140 min P/T W/T FTQ P/T W/T FTQ P/T W/T FTQ P/T W/T FTQ P/T W/T FTQ P/T W/T FTQ P/T W/T FTQ Takt Time = Available time / Customer Requirements = 40 days / 40 Clients = 1 per day IN COMBINE PROCESSES Stand. Work John XOXO FIFO
  • 77.
    • Customer requirements? •Work flow smoothly? • Trigger & sequence work? • Rhythm (leveling)? • Progress & delays visible? • Process improvements? Jack’s Taxes - Current State IN 40 clients Sort receipts & documents Confirm deductions Mail forms IN IN Print & Collate forms TS Review & sign forms IN Send reminder Prepare worksheet TS Client John 10 min --- 100% Jack 60 min 1 week 95% Jack 10 min 1 week 50% John 15 min --- 98% Jack 15 min --- 100% John 10 min --- 100% Jack 30 min --- 10% 1 week 3 weeks 3 days 3 days 1 day W/T P/T 10 min 1 week 30 min 3 weeks 60 min 10 min 3 days 15 min 15 min 10 min 3 days 1 day 1 week FTQ 100 % 98 % 100 % 50 % 100 % 95 % 10 % 1 week 140 min 7 wks, 2 days 4.7 % Total Lead Time: 7 wks, 2 days, 140 min P/T W/T FTQ P/T W/T FTQ P/T W/T FTQ P/T W/T FTQ P/T W/T FTQ P/T W/T FTQ P/T W/T FTQ Takt Time = Available time / Customer Requirements = 40 days / 40 Clients = 1 per day IN COMBINE PROCESSES Stand. Work John XOXO FIFO
  • 78.
    • Customer requirements? •Work flow smoothly? • Trigger & sequence work? • Rhythm (leveling)? • Progress & delays visible? • Process improvements? Jack’s Taxes - Current State IN 40 clients Sort receipts & documents Confirm deductions Mail forms IN IN Print & Collate forms TS Review & sign forms IN Send reminder Prepare worksheet TS Client John 10 min --- 100% Jack 60 min 1 week 95% Jack 10 min 1 week 50% John 15 min --- 98% Jack 15 min --- 100% John 10 min --- 100% Jack 30 min --- 10% 1 week 3 weeks 3 days 3 days 1 day W/T P/T 10 min 1 week 30 min 3 weeks 60 min 10 min 3 days 15 min 15 min 10 min 3 days 1 day 1 week FTQ 100 % 98 % 100 % 50 % 100 % 95 % 10 % 1 week 140 min 7 wks, 2 days 4.7 % Total Lead Time: 7 wks, 2 days, 140 min P/T W/T FTQ P/T W/T FTQ P/T W/T FTQ P/T W/T FTQ P/T W/T FTQ P/T W/T FTQ P/T W/T FTQ Takt Time = Available time / Customer Requirements = 40 days / 40 Clients = 1 per day IN COMBINE PROCESSES Stand. Work John XOXO FIFO Data entry Worksheet training Individual 1040, 1040EZ training Reduce process time to 75 min Standardize Work
  • 79.
    IN 40 clients Mail forms Jack’sTaxes Future State Check & sign forms IN Send Reminder Data entry + print forms FS Client FIFO max 1 day max 1 day XOXO 1 per day Over 8 weeks Takt Time = Available time / Customer Requirements = 40 days / 40 Clients = 1 per day Customer Requirements: •Tax Forms completed accurately •Finished before filling time •Lowest possible cost W/T P/T FTQ 100 min 2 days 98 % 2 days, 100 min 10 min 75 min 15 min 10 min 1 day 1 day P/T W/T FTQ P/T W/T FTQ P/T W/T FTQ P/T W/T FTQ John 10 min 100% John 75 min 98% Jack 15 min 1 day 100% John 10 min 1 day 100% 98 % 100 % 100 % 100 %
  • 80.
    Metric SPQRC Current Estimate From Current State Map Targetfrom Future State Map Actual (post implementation) Process Time 720 Min. 140 Min. 100 Min. Lead Time 6 – 8 weeks 7 Weeks, 2 Days, 140 Min 2 Days, 100 Min. First Time Quality 100% 4.7% 98% Other(s) Measurable Metrics & Performance
  • 81.
    Summary of Results– Potential Impact • Reduced PT 40 mins (29%) – Jack could add 11 additional self employed clients without adding work hours! Increased revenue, no more time. • FTQ increased 20 fold (4.7% to 98%). Improved area of greatest opportunity. • Turn around time is now well within customer expectations (from 7 weeks and 2 days down to 2 days). Able to respond to customer needs faster. • Moved 70 mins of Jack’s “high priced time” over to John. Jack can now concentrate on more complicated returns or on obtaining more higher revenue generating corporate clients. • Reduced personal overtime – Jack does not stay late signing returns anymore. • This new Future State now becomes the next Current State (continuous improvement). Next Jack could investigate further leveling the work he receives in, filing electronically, …
  • 82.
  • 83.
    Understanding how things currentlyoperate. This is the foundation for the future state. Designing a lean flow through the application of Lean principles Current State drawing Future State drawing Determine the Value Stream to be improved The goal of mapping! Planning and Implementation Scoping the Value Stream Using the Value Stream Mapping Tool
  • 84.
    Current State The Methods /Action Steps are how you will get there Future State Changes The specific changes (Kaizen Bursts) needed to move from CS to FS are your Objectives
  • 85.
    Business Plan Deployment (BPD)is the Standard Process that enables the total organization to set targets, integrate plans, and remain focused to achieve company-wide goals and manage change
  • 86.
    Concrete GOALS Specific OBJECTIVES Clear &Measurable TARGETS A METHOD to reach the targets / GAP CLOSURE PLAN and Strategies Common Measurements BPD Elements
  • 87.
    Business Plan Deployment Isa PDCA Cycle 2 Tasks Plant Master Plan A c ti o n Annual Business Plan 1 2 3 4 Plan Do (Communicate & Implement) Check Act (Standardized & Countermeasures) Scorecard Plan Do Check Act Problem Description Direct Cause Cause Cause Cause Why? Why? Why? Why? Why? Root Cause
  • 88.
  • 89.
  • 90.
    Wrap-up • What didyou learn today? • Did the program meet your expectations? • How can we improve this learning event?