Downloaded 1,403 times
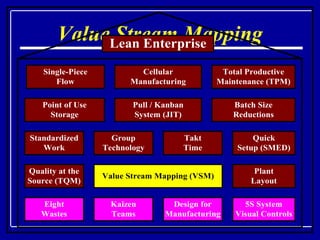
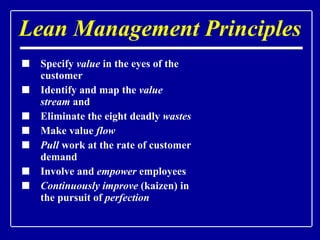
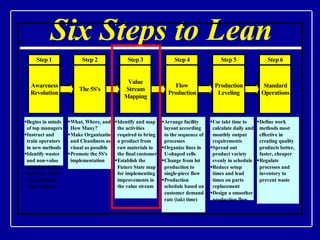

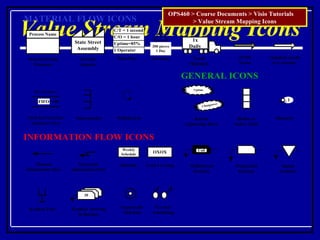
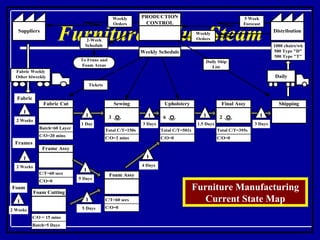
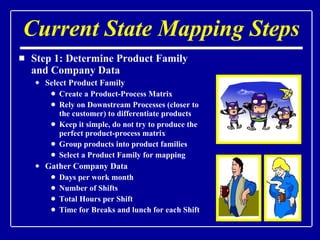
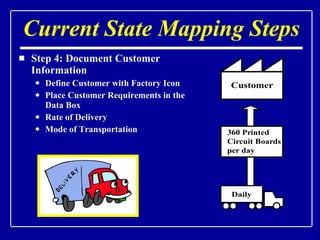
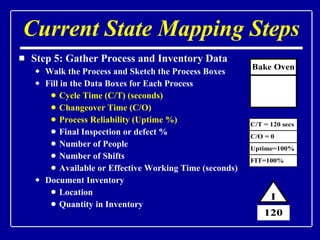
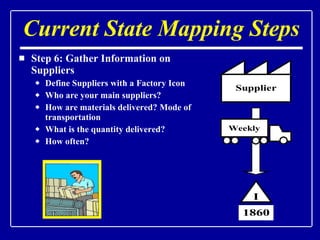
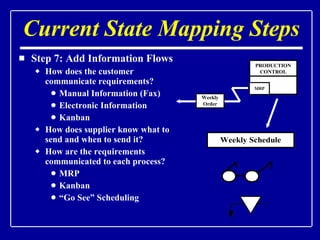
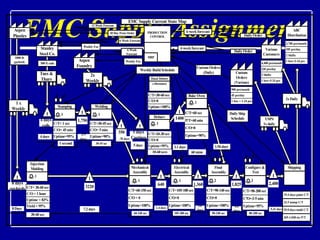
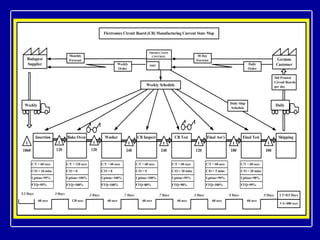
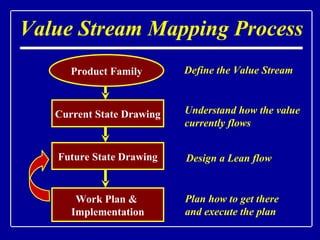
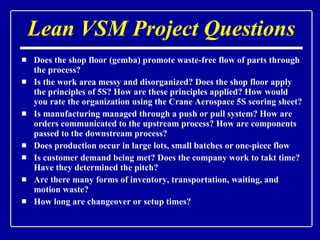
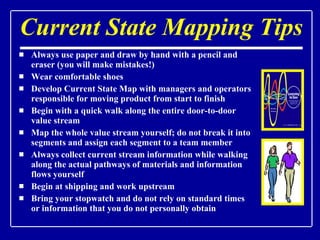
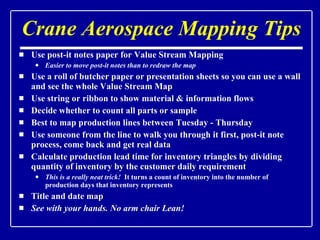
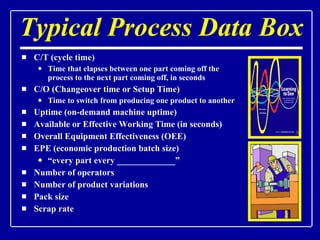

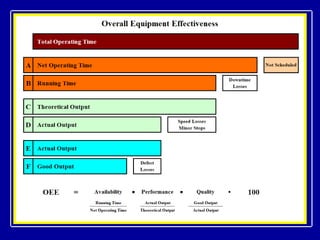
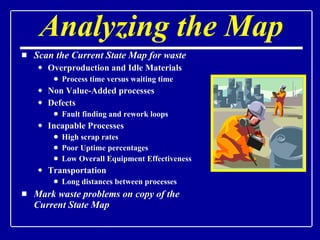
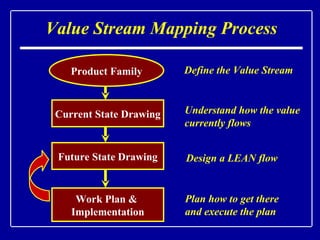
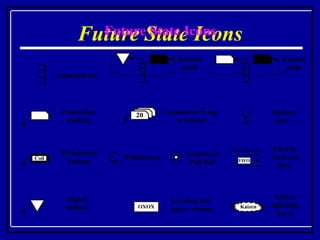
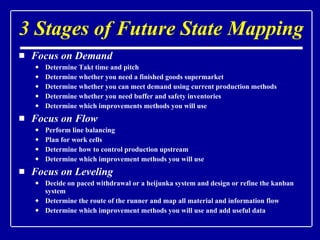
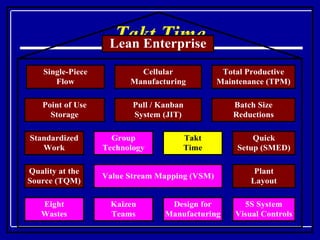
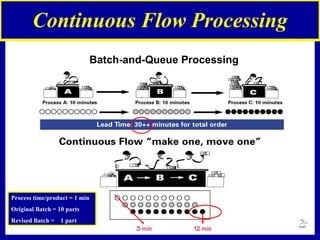
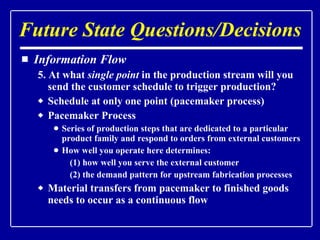
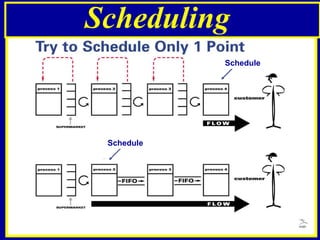
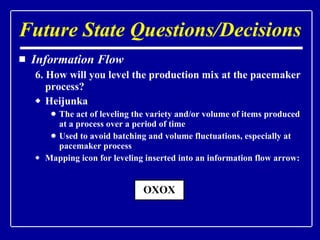
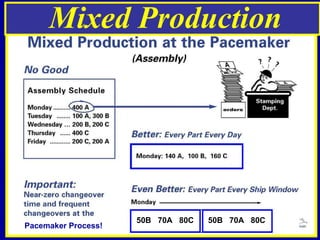

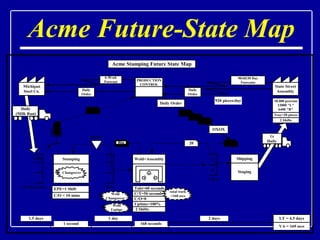
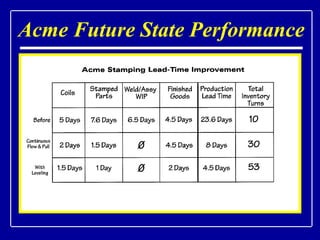
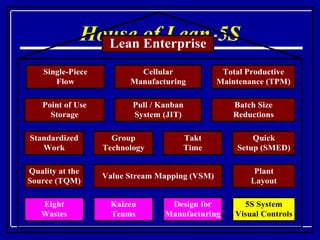

The document discusses value stream mapping, a Lean management technique. It describes the six steps to value stream mapping: (1) specify value from the customer perspective, (2) map the value stream and eliminate waste, (3) make value flow continuously, (4) pull work at the customer demand rate, (5) involve and empower employees, and (6) continuously improve. It then provides details on conducting current state and future state value stream mapping, including collecting production data, identifying waste, setting targets to reduce lead time and inventory, and designing continuous flow processing.


