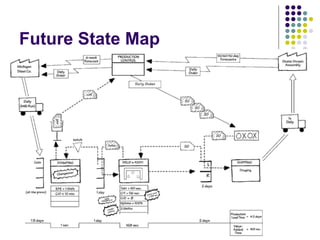
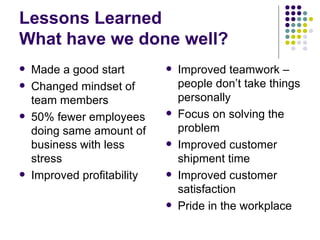
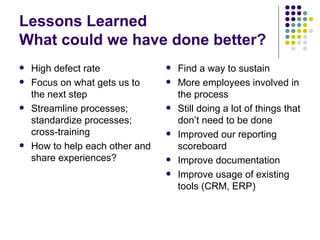
Lean Manufacturing A real-world case study
Presentation Objectives Review the objectives of Lean Manufacturing. What did we accomplish? Review some additional concepts and tools for Lean Manufacturing. Assess our lessons learned. Develop a set of next steps to focus on adding value for our Customers and eliminate additional waste.
Objectives of Lean Manufacturing Improve customer service Fast turnaround Fast delivery Increase sales Improve internal operating efficiencies and reduce expenses Improve profitability Improve product quality Reduce inventories Improve workplace safety
Accomplishments Reduced inventory Same day shipping Reduced workload More efficient production scheduling Improved customer satisfaction Inventory accuracy Hot items are non-existent Got rid of clutter Organized warehouse Improved flow on production lines
Lean Manufacturing Results
Company Trends First  Lean Event
How To Achieve These Goals? Focus on the needs of the Customer Make sure all business activities are value-added for the Customer Fundamental change in how we do business Operations Sales and Marketing Administration Employee involvement Continuous improvement It’s okay to make mistakes – we want to focus on how to prevent them from happening again
Muda = Waste Goal is to eliminate waste in all areas of the business Eliminate activities that the customer does not want to pay for
Core Ideas of Lean Determine and create value What does the Customer want? Eliminate non-value added activities Use “pull” instead of “push” systems Avoid overproduction.  Inventories hide problems and inefficiencies. One piece flow Make the work “flow”, so that there are no interruptions and no wasted time or materials. Eliminate the seven speed bumps cause by waste The Six S’s – sort, straighten, shine, standardize, sustain, and safety. Use problem solving to eliminate defects
Lean vs Mass Production Lean Production Build to order Economies of speed Effective Pull (from Customer) Small lots Quick changeover Production cells Right-sized machines Fast to respond Adaptive General knowledge Mass Production Make and sell Economies of scale Efficient Push (to Customer) Large batches Changeover unimportant Functional silos Big, fast machines Slow to change Rigid, inflexible Specialized knowledge
Seven Speed Bumps of Lean Over production  (the most common type of waste) which creates inventories that take up space and capital. Excess inventory  caused by over production. Waiting  – Products waiting in line for the next process to start. Unnecessary movement  of work products.  Unnecessary movement  of employees. Unnecessary or incorrect processing . Defects  leading to repair, rework, or scrap.
Seven Speed Bumps of Lean for the Office Over production  - Copies, files, paperwork. Excess inventory  - Excess documentation, procedures, work backlogs. Waiting  - Cycle time versus lead time, signature approvals. Unnecessary movement  of work products - distribution.  Unnecessary movement  of employees - walking, reaching, bending. Unnecessary or incorrect processing . Defects  - passing on work that contains errors.
Another Speed Bump? Underutilized people
Lean Manufacturing Tools Six S’s (Five plus safety) Value Stream Mapping Kaizen Events Kanban (Visual Systems) Mistake Proofing Standard Work Instructions Changeover Time Improvement (SMED) Total Productive Maintenance Root Cause Analysis Pareto Charts Quality Improvement Five Why’s Cellular and Pull System Flow Plant Layout Redesign Just In Time Self Inspection Batch Size Reduction Point of Use Storage Change Management Empowered Teams TAKT Time Balanced Scorecard Autonomation
The Six S’s Antidote to Waste Report Card Grade B-C Safety – develop and sustain a safe work environment. C-D Sustain – maintain a stable workflow. D Standardize – develop systems and procedures to monitor conformance to the first three rules. B Shine – clean machines and work area to expose problems. C-D Straighten – A place for everything and everything in its place.  Establish standardized places for incoming raw materials, tools, etc. B-C Sort – keep only what is needed.  Pitch everything else.  The workplace often becomes cluttered with products, tools, and waste materials that don’t belong there.  Get rid of them.
What is Value Stream Mapping? Flowchart of a process A picture speaks a thousand words Follow the production path from beginning to end and draw a visual representation of every process in the material & information flows
Current State Map
Future State Map
Five Why’s The 5 why's typically refers to the practice of asking, five times, why the failure has occurred in order to get to the root cause/causes of the problem.  You are on your way home from work and your car stops: Why did your car stop? Because it ran out of gas. Why did it run out of gas? Because I didn't buy any gas on my way to work. Why didn't you buy any gas this morning? Because I didn't have any money. Why didn't you have any money? Because I lost it all last night in a poker game.
Visual Workplace A work environment that is self-explaining, self-ordering, and self-improving. Out-of-standard situation is immediately obvious and employees can easily correct.
TAKT Time Time required to produce a compenent or set of components to meet customer demand TAKT Time =  Total daily working time Total daily quantity of sales TAKT time is subject to change every month TAKT time determines rate of production
Lessons Learned What have we done well? Made a good start Changed mindset of team members 50% fewer employees doing same amount of business with less stress Improved profitability Improved teamwork – people don’t take things personally Focus on solving the problem Improved customer shipment time Improved customer satisfaction Pride in the workplace
Lessons Learned What could we have done better? High defect rate Focus on what gets us to the next step Streamline processes; standardize processes; cross-training How to help each other and share experiences? Find a way to sustain More employees involved in the process Still doing a lot of things that don’t need to be done Improved our reporting scoreboard Improve documentation Improve usage of existing tools (CRM, ERP)

Lean Manufacturing 2009 - By Jerry Helms

  • 1.
    Lean Manufacturing Areal-world case study
  • 2.
    Presentation Objectives Reviewthe objectives of Lean Manufacturing. What did we accomplish? Review some additional concepts and tools for Lean Manufacturing. Assess our lessons learned. Develop a set of next steps to focus on adding value for our Customers and eliminate additional waste.
  • 3.
    Objectives of LeanManufacturing Improve customer service Fast turnaround Fast delivery Increase sales Improve internal operating efficiencies and reduce expenses Improve profitability Improve product quality Reduce inventories Improve workplace safety
  • 4.
    Accomplishments Reduced inventorySame day shipping Reduced workload More efficient production scheduling Improved customer satisfaction Inventory accuracy Hot items are non-existent Got rid of clutter Organized warehouse Improved flow on production lines
  • 5.
  • 6.
  • 7.
    How To AchieveThese Goals? Focus on the needs of the Customer Make sure all business activities are value-added for the Customer Fundamental change in how we do business Operations Sales and Marketing Administration Employee involvement Continuous improvement It’s okay to make mistakes – we want to focus on how to prevent them from happening again
  • 8.
    Muda = WasteGoal is to eliminate waste in all areas of the business Eliminate activities that the customer does not want to pay for
  • 9.
    Core Ideas ofLean Determine and create value What does the Customer want? Eliminate non-value added activities Use “pull” instead of “push” systems Avoid overproduction. Inventories hide problems and inefficiencies. One piece flow Make the work “flow”, so that there are no interruptions and no wasted time or materials. Eliminate the seven speed bumps cause by waste The Six S’s – sort, straighten, shine, standardize, sustain, and safety. Use problem solving to eliminate defects
  • 10.
    Lean vs MassProduction Lean Production Build to order Economies of speed Effective Pull (from Customer) Small lots Quick changeover Production cells Right-sized machines Fast to respond Adaptive General knowledge Mass Production Make and sell Economies of scale Efficient Push (to Customer) Large batches Changeover unimportant Functional silos Big, fast machines Slow to change Rigid, inflexible Specialized knowledge
  • 11.
    Seven Speed Bumpsof Lean Over production (the most common type of waste) which creates inventories that take up space and capital. Excess inventory caused by over production. Waiting – Products waiting in line for the next process to start. Unnecessary movement of work products. Unnecessary movement of employees. Unnecessary or incorrect processing . Defects leading to repair, rework, or scrap.
  • 12.
    Seven Speed Bumpsof Lean for the Office Over production - Copies, files, paperwork. Excess inventory - Excess documentation, procedures, work backlogs. Waiting - Cycle time versus lead time, signature approvals. Unnecessary movement of work products - distribution. Unnecessary movement of employees - walking, reaching, bending. Unnecessary or incorrect processing . Defects - passing on work that contains errors.
  • 13.
    Another Speed Bump?Underutilized people
  • 14.
    Lean Manufacturing ToolsSix S’s (Five plus safety) Value Stream Mapping Kaizen Events Kanban (Visual Systems) Mistake Proofing Standard Work Instructions Changeover Time Improvement (SMED) Total Productive Maintenance Root Cause Analysis Pareto Charts Quality Improvement Five Why’s Cellular and Pull System Flow Plant Layout Redesign Just In Time Self Inspection Batch Size Reduction Point of Use Storage Change Management Empowered Teams TAKT Time Balanced Scorecard Autonomation
  • 15.
    The Six S’sAntidote to Waste Report Card Grade B-C Safety – develop and sustain a safe work environment. C-D Sustain – maintain a stable workflow. D Standardize – develop systems and procedures to monitor conformance to the first three rules. B Shine – clean machines and work area to expose problems. C-D Straighten – A place for everything and everything in its place. Establish standardized places for incoming raw materials, tools, etc. B-C Sort – keep only what is needed. Pitch everything else. The workplace often becomes cluttered with products, tools, and waste materials that don’t belong there. Get rid of them.
  • 16.
    What is ValueStream Mapping? Flowchart of a process A picture speaks a thousand words Follow the production path from beginning to end and draw a visual representation of every process in the material & information flows
  • 17.
  • 18.
  • 19.
    Five Why’s The5 why's typically refers to the practice of asking, five times, why the failure has occurred in order to get to the root cause/causes of the problem. You are on your way home from work and your car stops: Why did your car stop? Because it ran out of gas. Why did it run out of gas? Because I didn't buy any gas on my way to work. Why didn't you buy any gas this morning? Because I didn't have any money. Why didn't you have any money? Because I lost it all last night in a poker game.
  • 20.
    Visual Workplace Awork environment that is self-explaining, self-ordering, and self-improving. Out-of-standard situation is immediately obvious and employees can easily correct.
  • 21.
    TAKT Time Timerequired to produce a compenent or set of components to meet customer demand TAKT Time = Total daily working time Total daily quantity of sales TAKT time is subject to change every month TAKT time determines rate of production
  • 22.
    Lessons Learned Whathave we done well? Made a good start Changed mindset of team members 50% fewer employees doing same amount of business with less stress Improved profitability Improved teamwork – people don’t take things personally Focus on solving the problem Improved customer shipment time Improved customer satisfaction Pride in the workplace
  • 23.
    Lessons Learned Whatcould we have done better? High defect rate Focus on what gets us to the next step Streamline processes; standardize processes; cross-training How to help each other and share experiences? Find a way to sustain More employees involved in the process Still doing a lot of things that don’t need to be done Improved our reporting scoreboard Improve documentation Improve usage of existing tools (CRM, ERP)