Downloaded 311 times


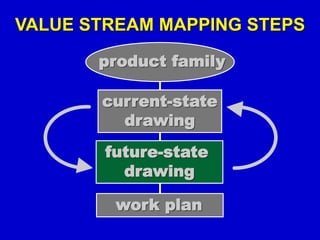
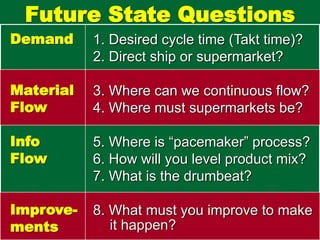
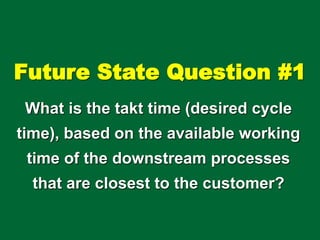
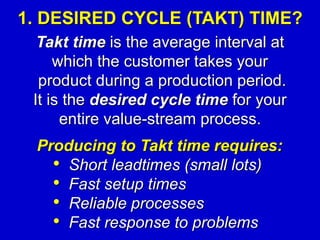
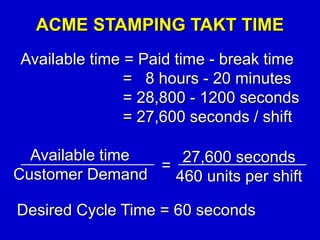

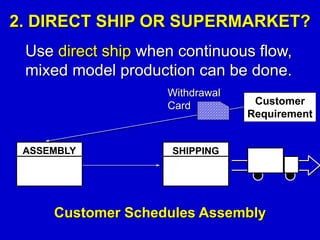
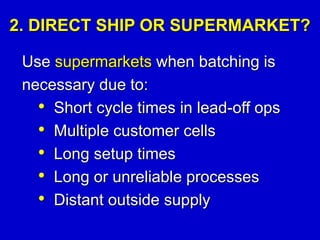
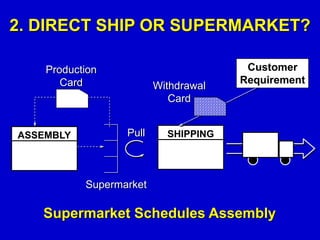
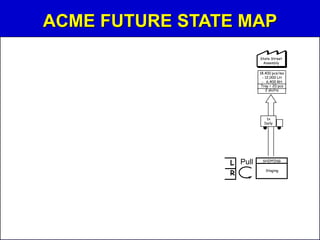

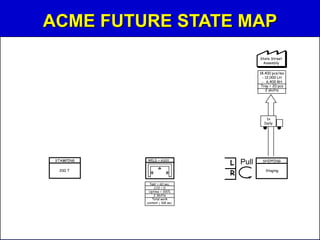

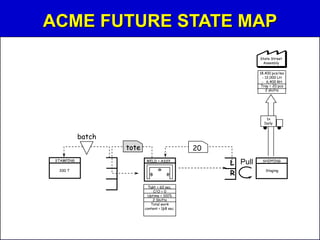
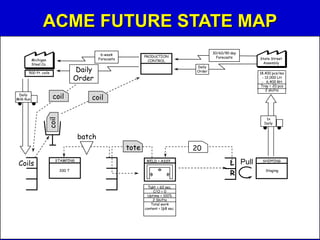

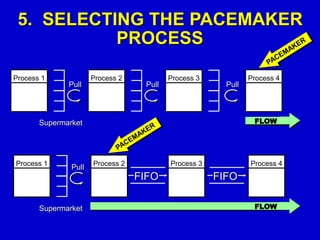

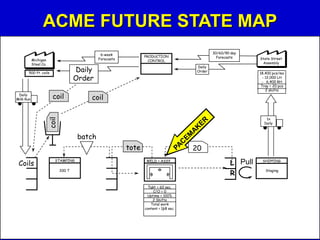

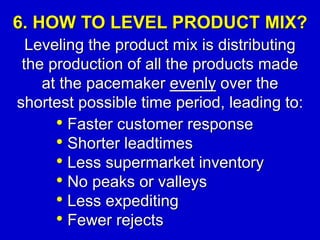
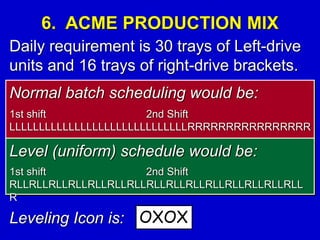
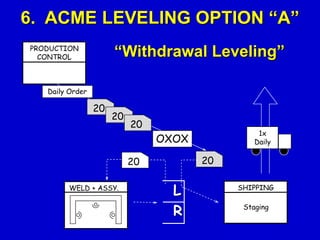
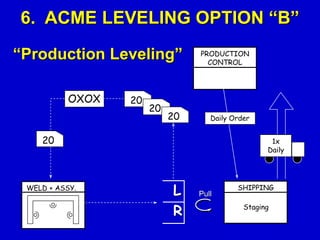

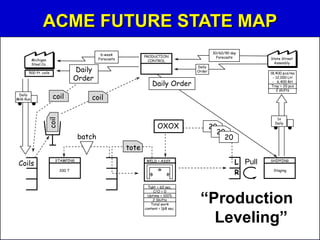

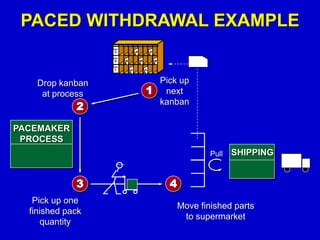
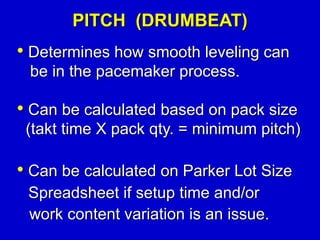
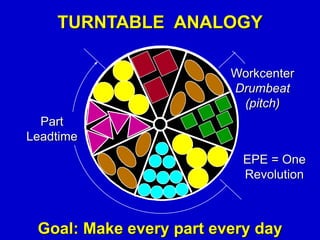


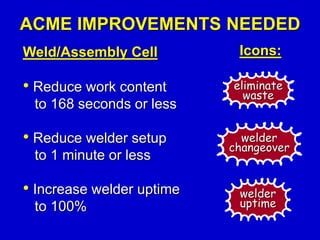
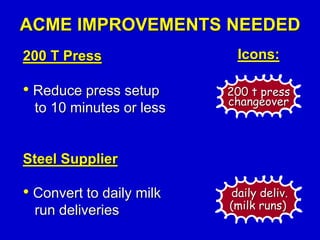
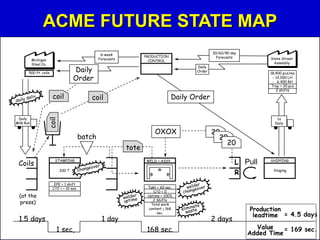
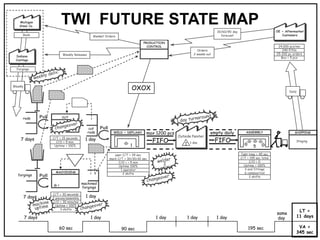

The document outlines steps for creating a future state map including identifying the desired cycle time, determining if a direct ship or supermarket pull system will be used, where continuous flow can be implemented, where supermarkets are needed, identifying the pacemaker process, how to level the production mix, establishing the drumbeat or pitch, and what process improvements are necessary. For Acme Stamping, the future state map shows the weld and assembly cell operating with a 60 second takt time, the pacemaker being stamping, production being leveled with a 20 minute drumbeat, and needed improvements such as reducing stamping changeover time and converting the steel supplier to daily deliveries.


