Downloaded 107 times


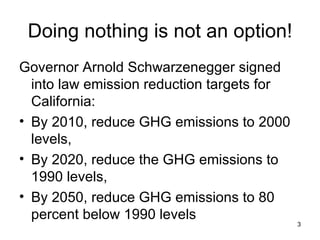
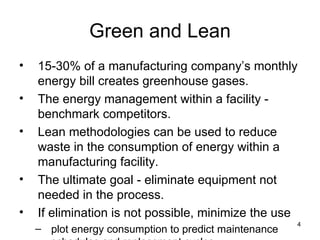

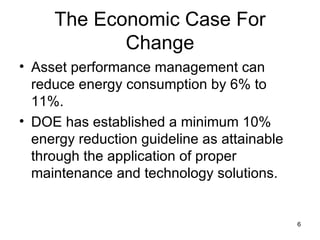
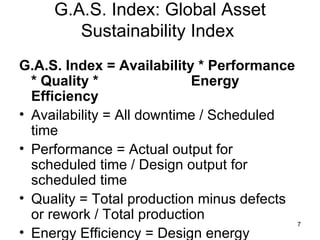


The document outlines strategies for reducing greenhouse gas emissions in manufacturing through lean practices, emphasizing waste elimination and energy efficiency. It describes the importance of energy management, highlights lean methodologies to improve production processes, and suggests a systematic approach for demand reduction and conservation. Additionally, it stresses the need for leadership, clear processes, and a focus on value-added activities to achieve these goals.


