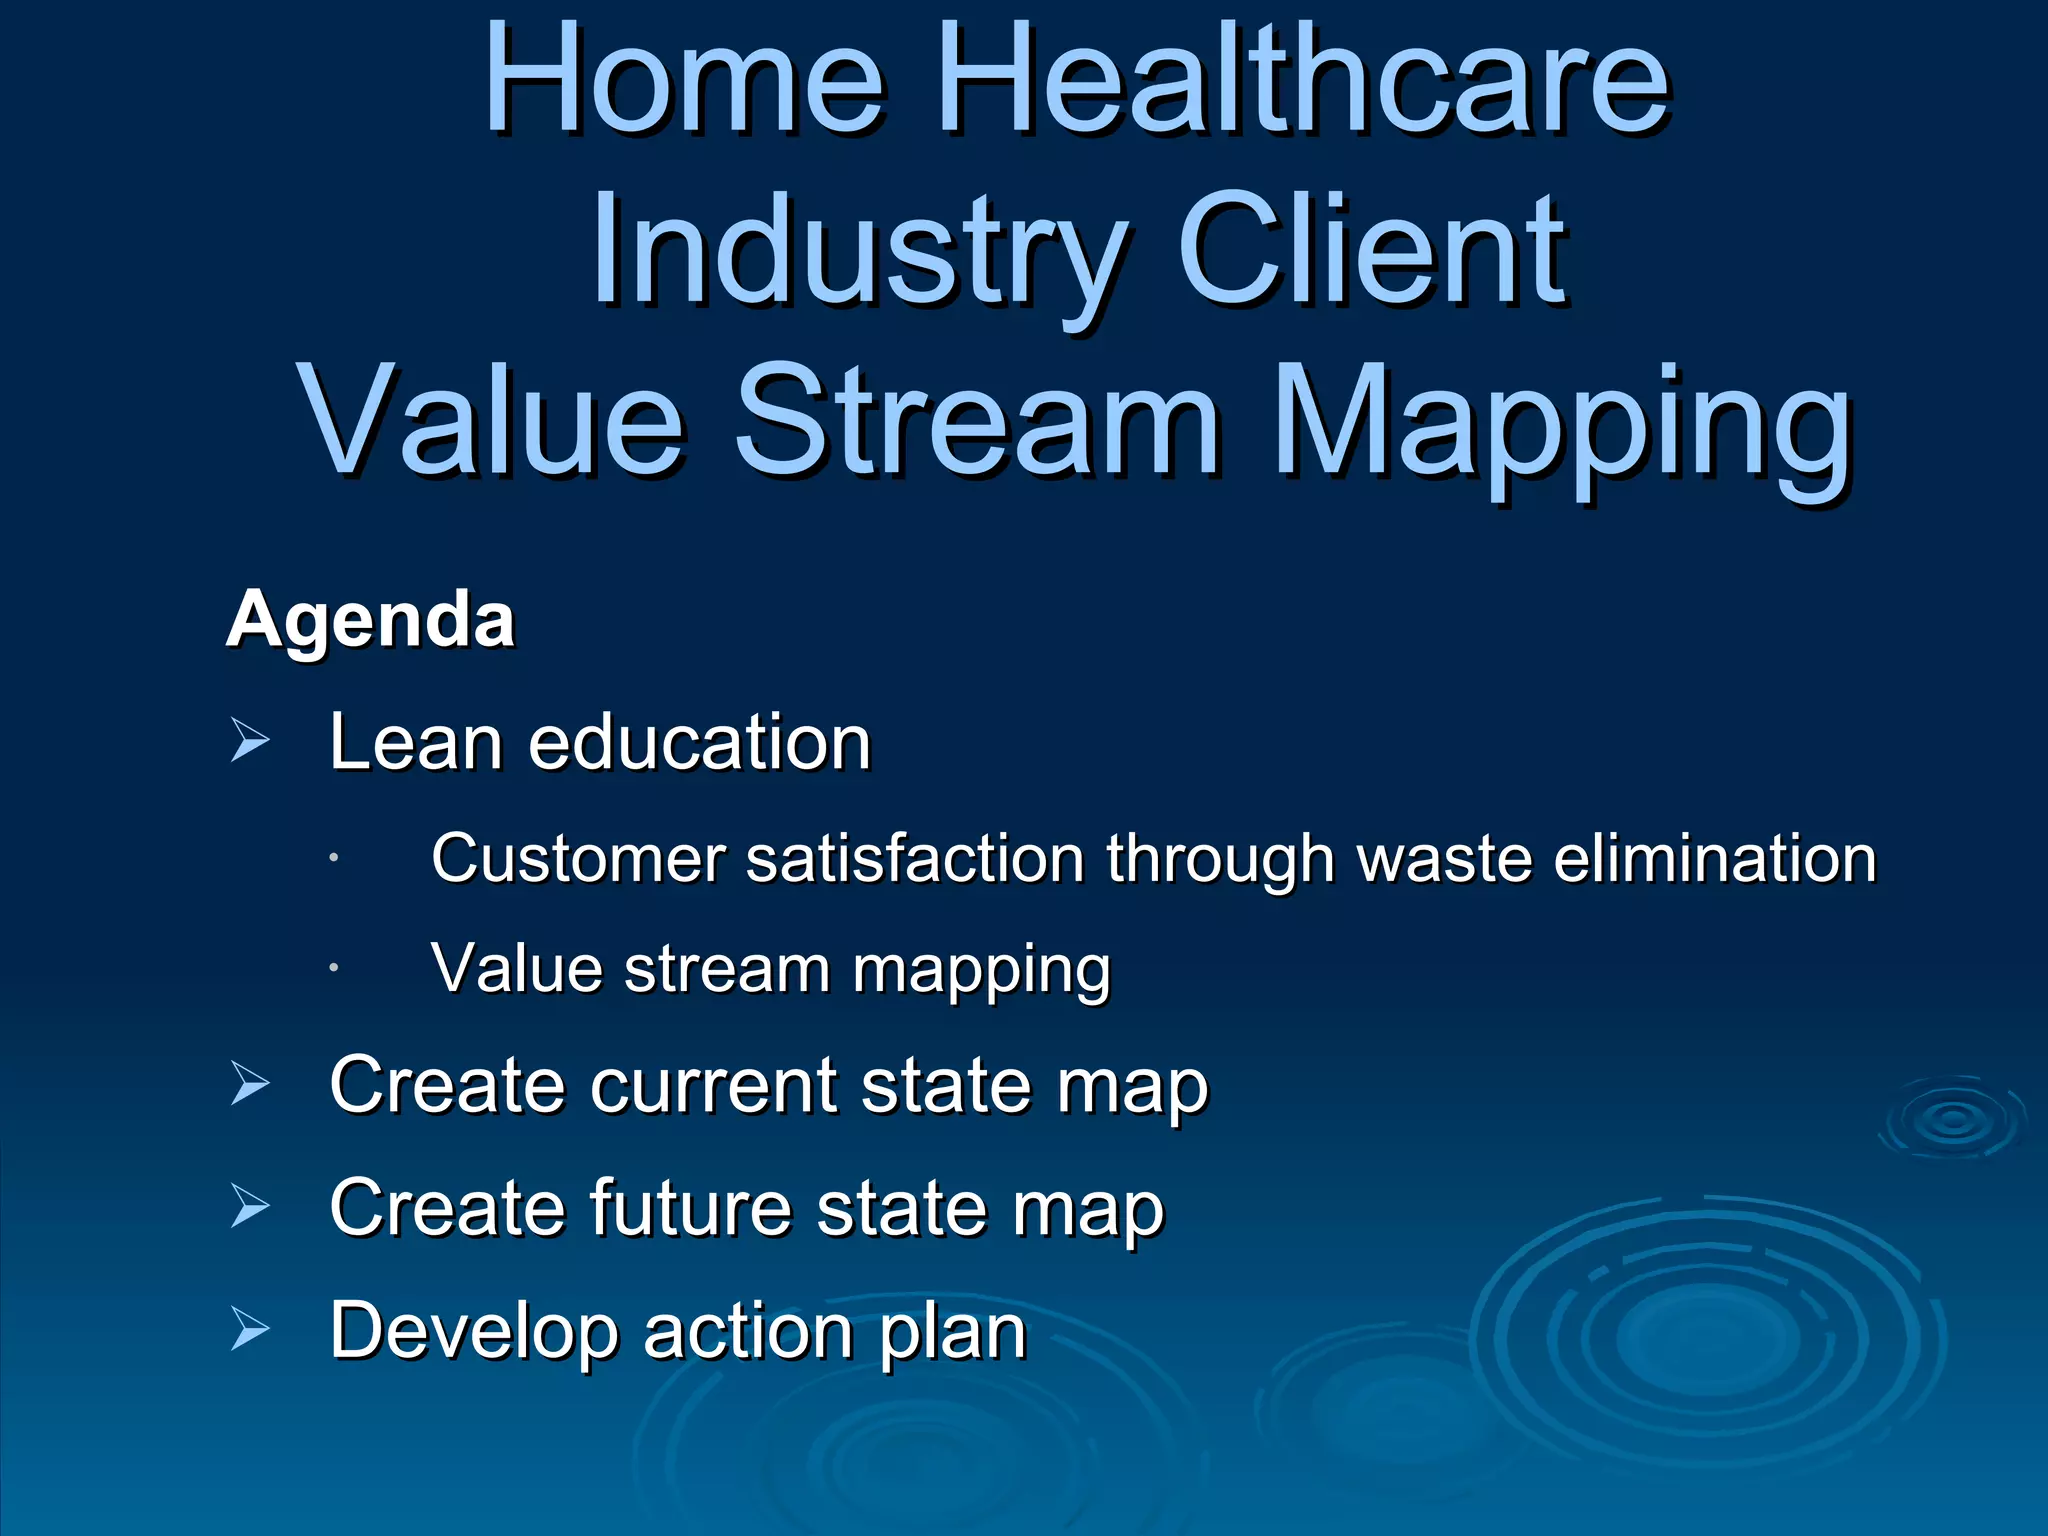
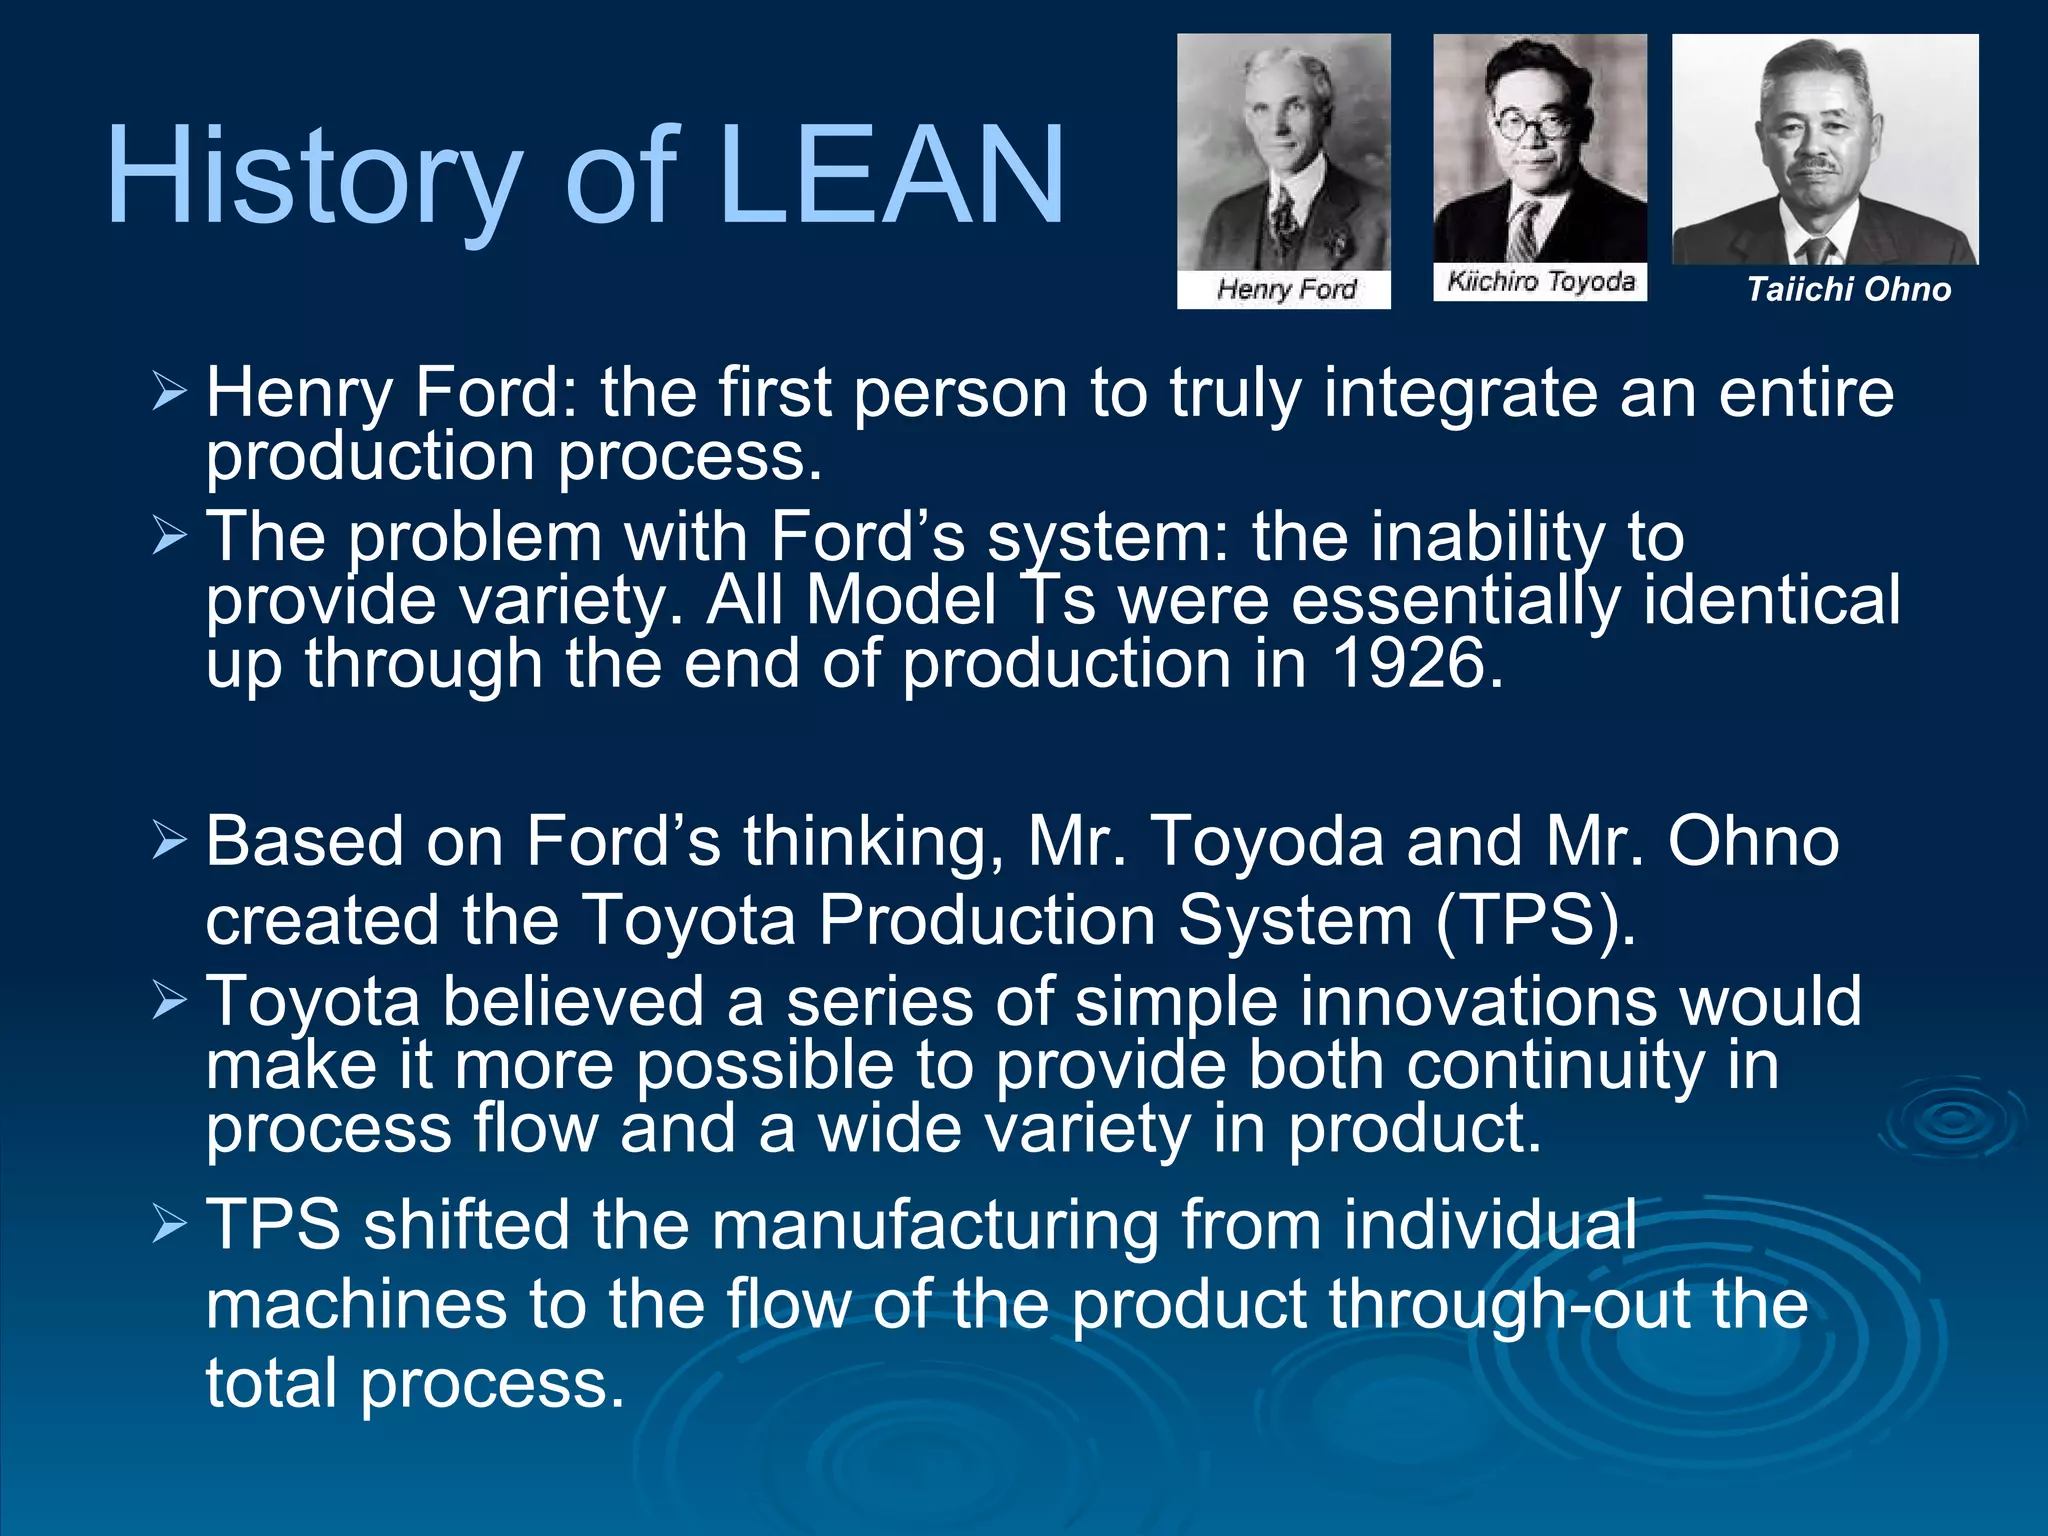
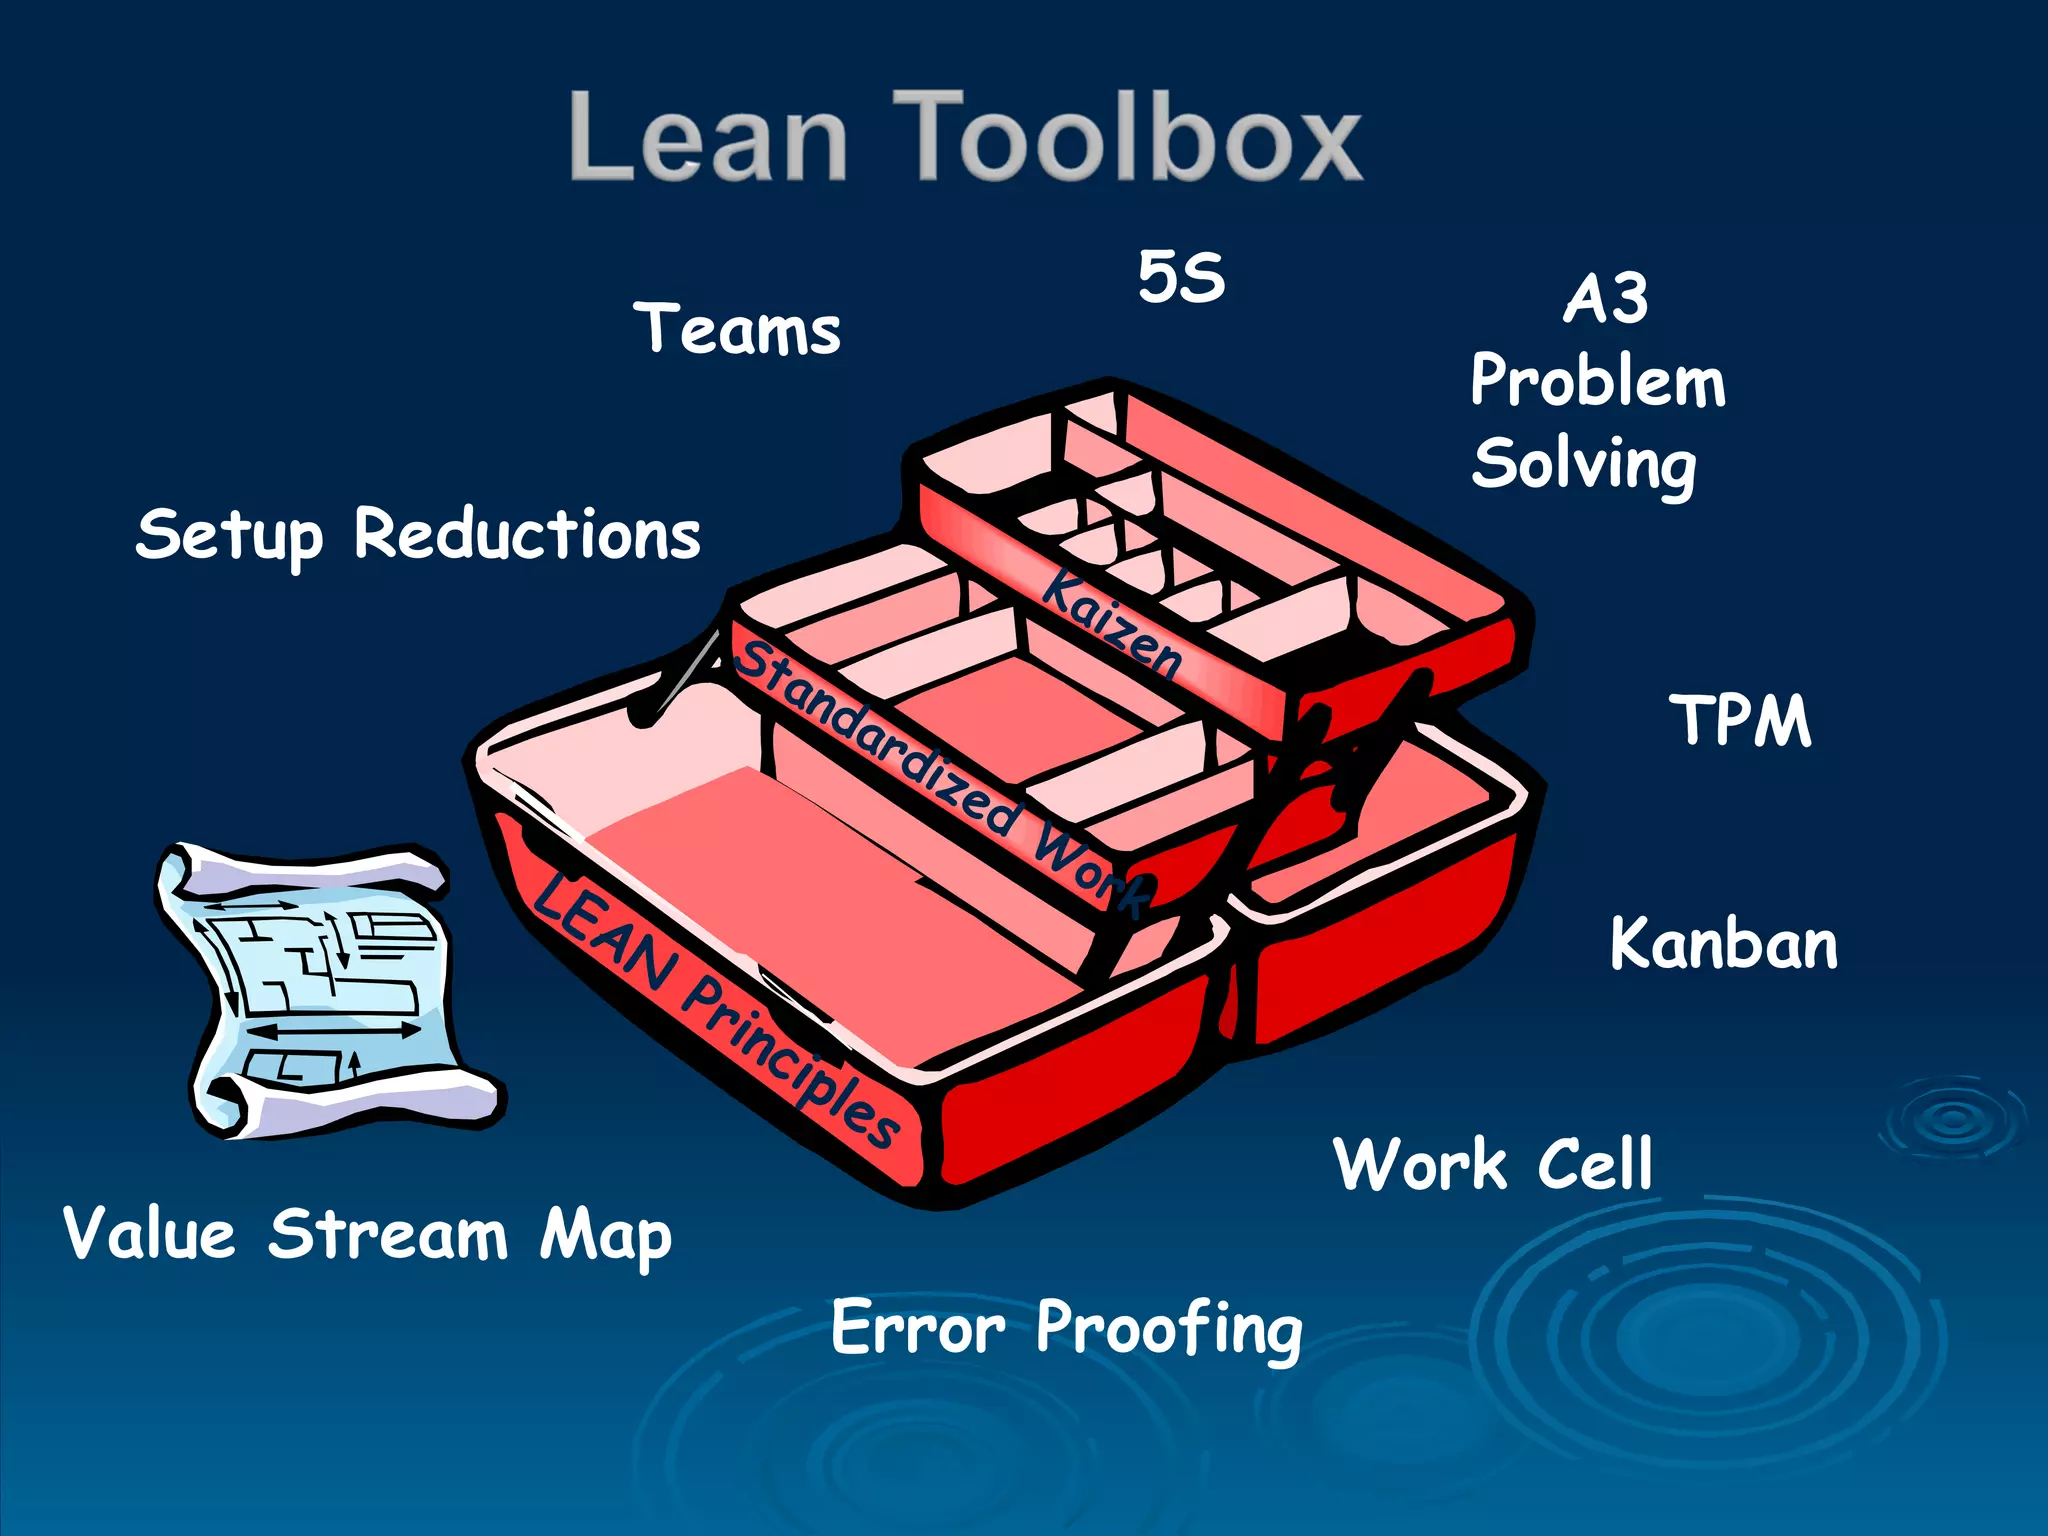
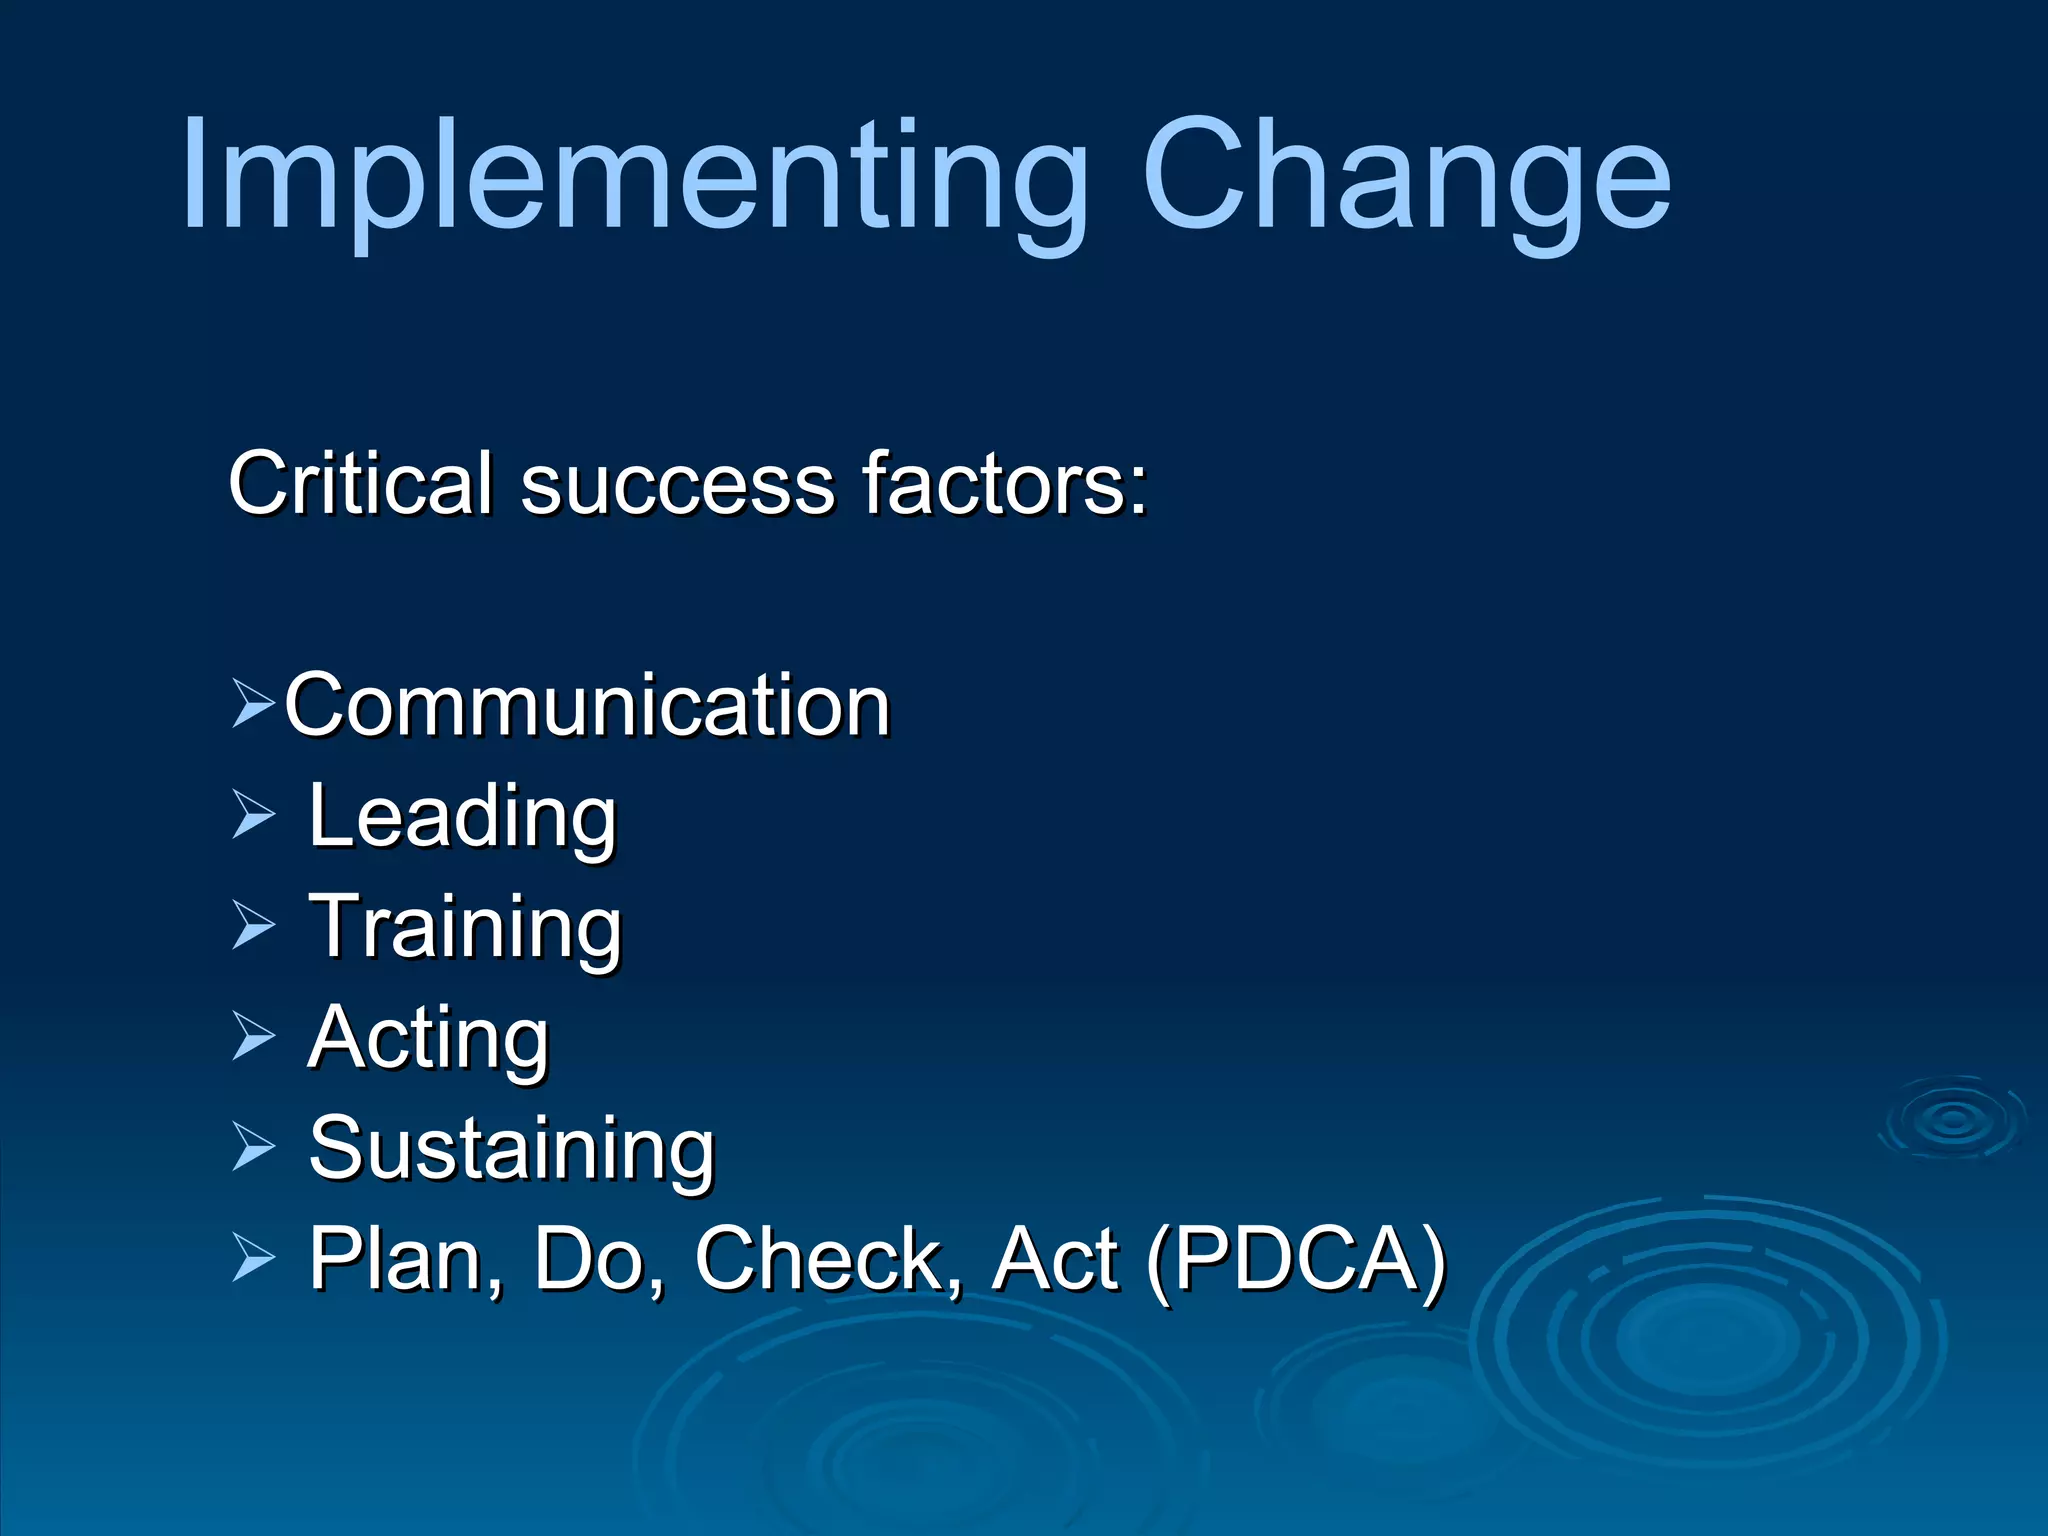
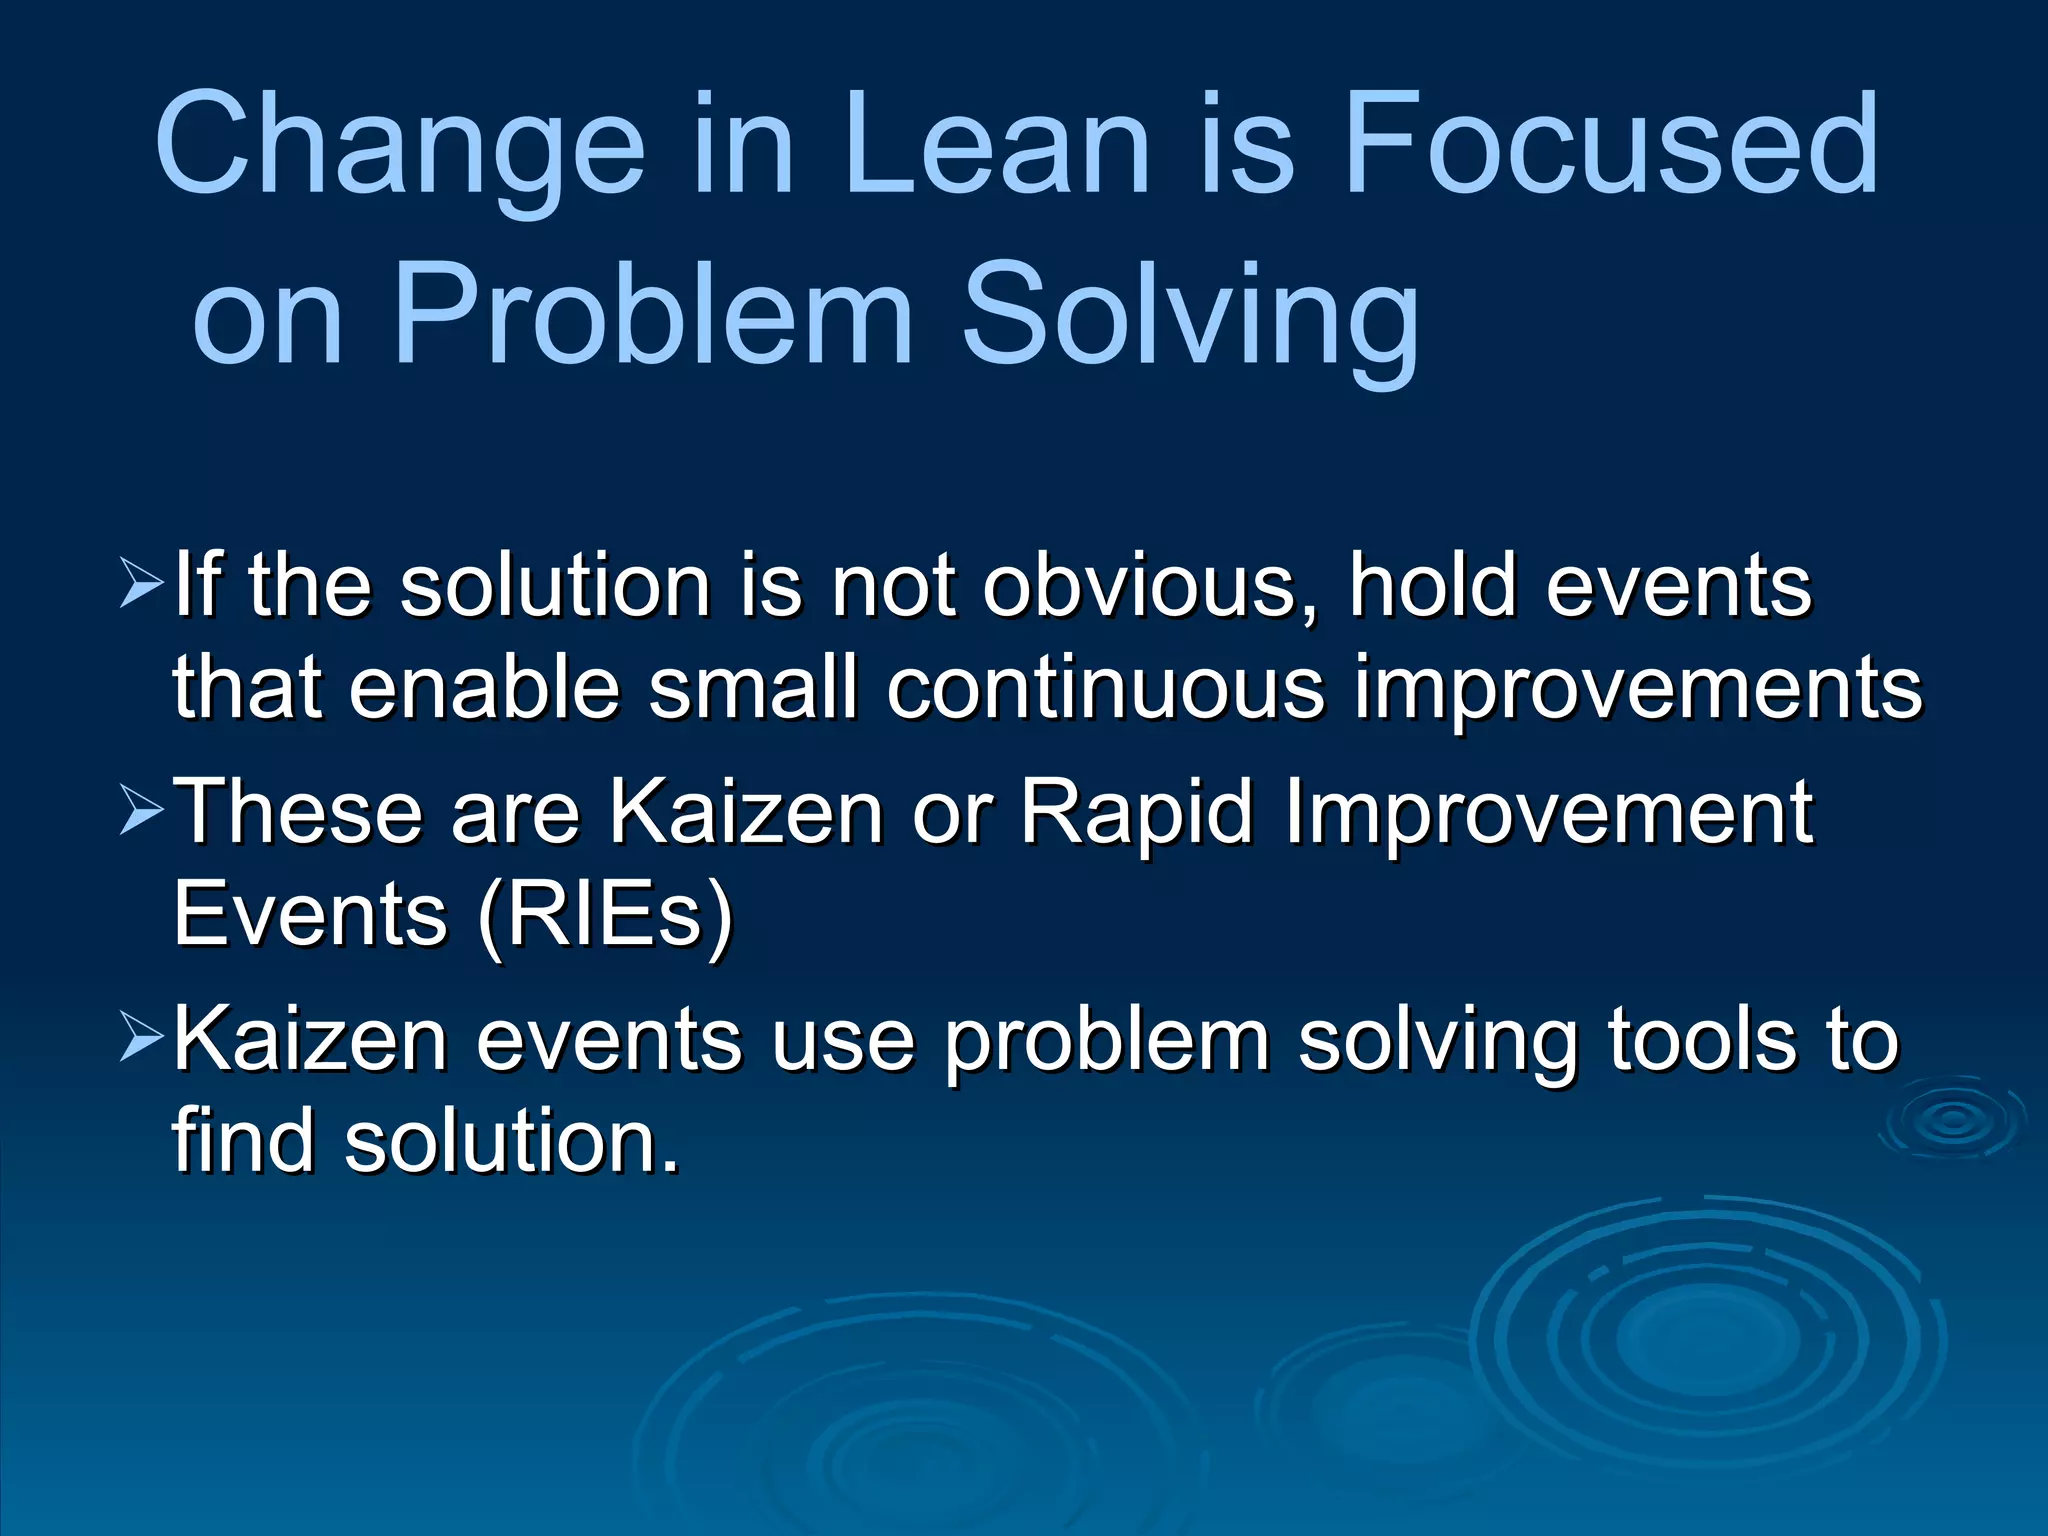
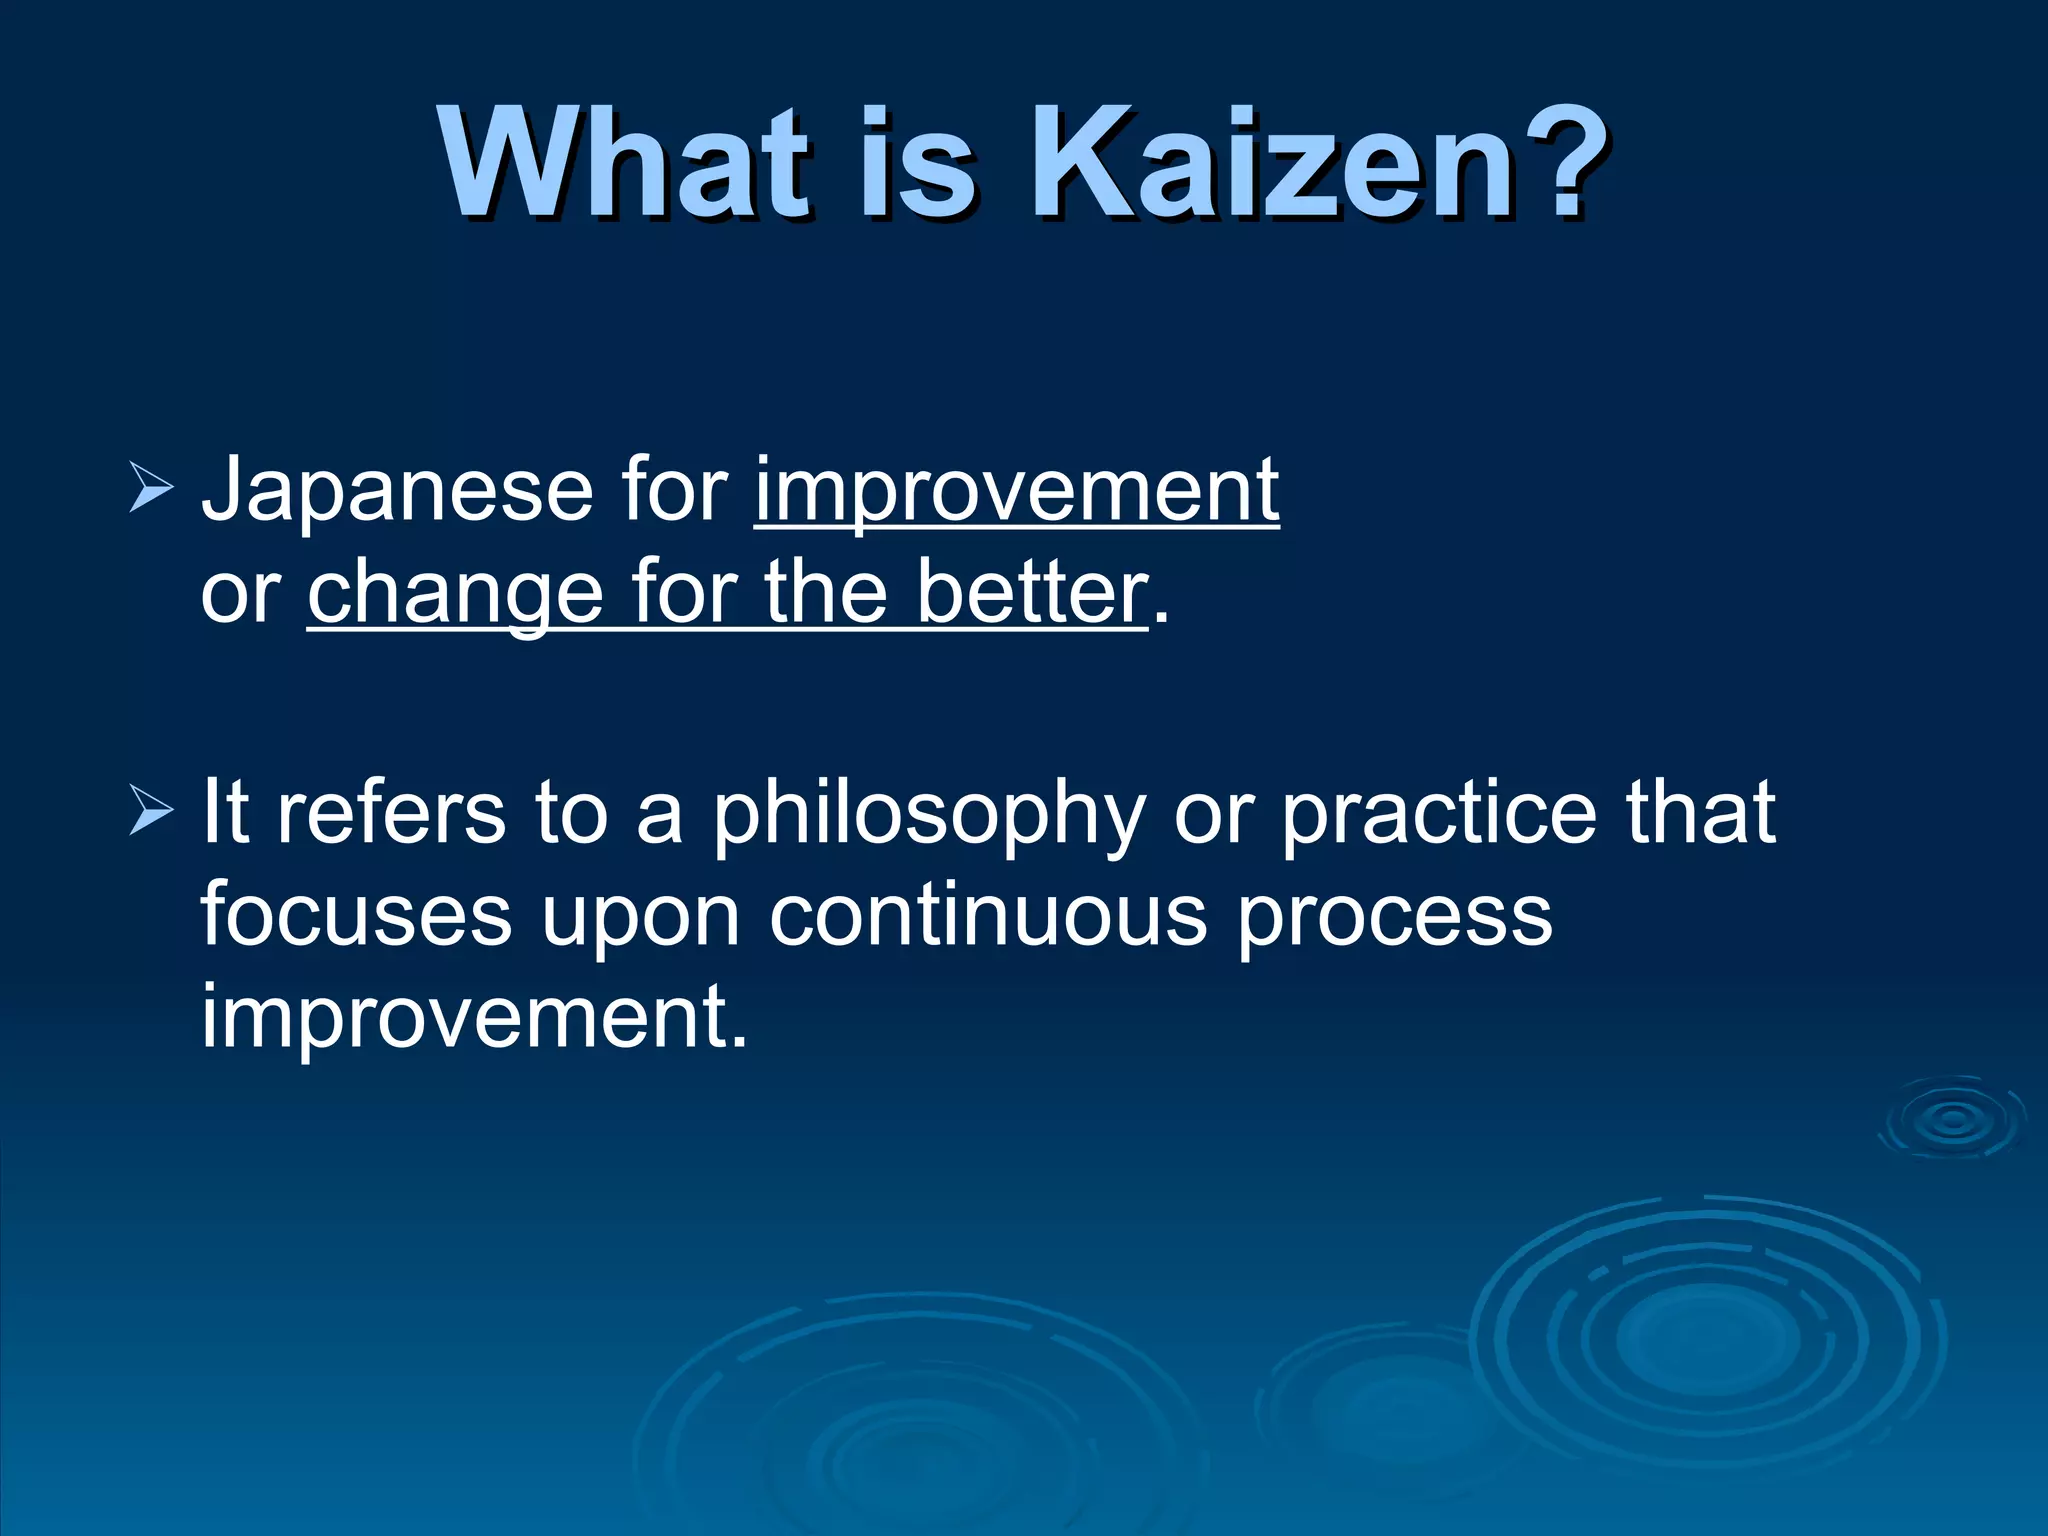
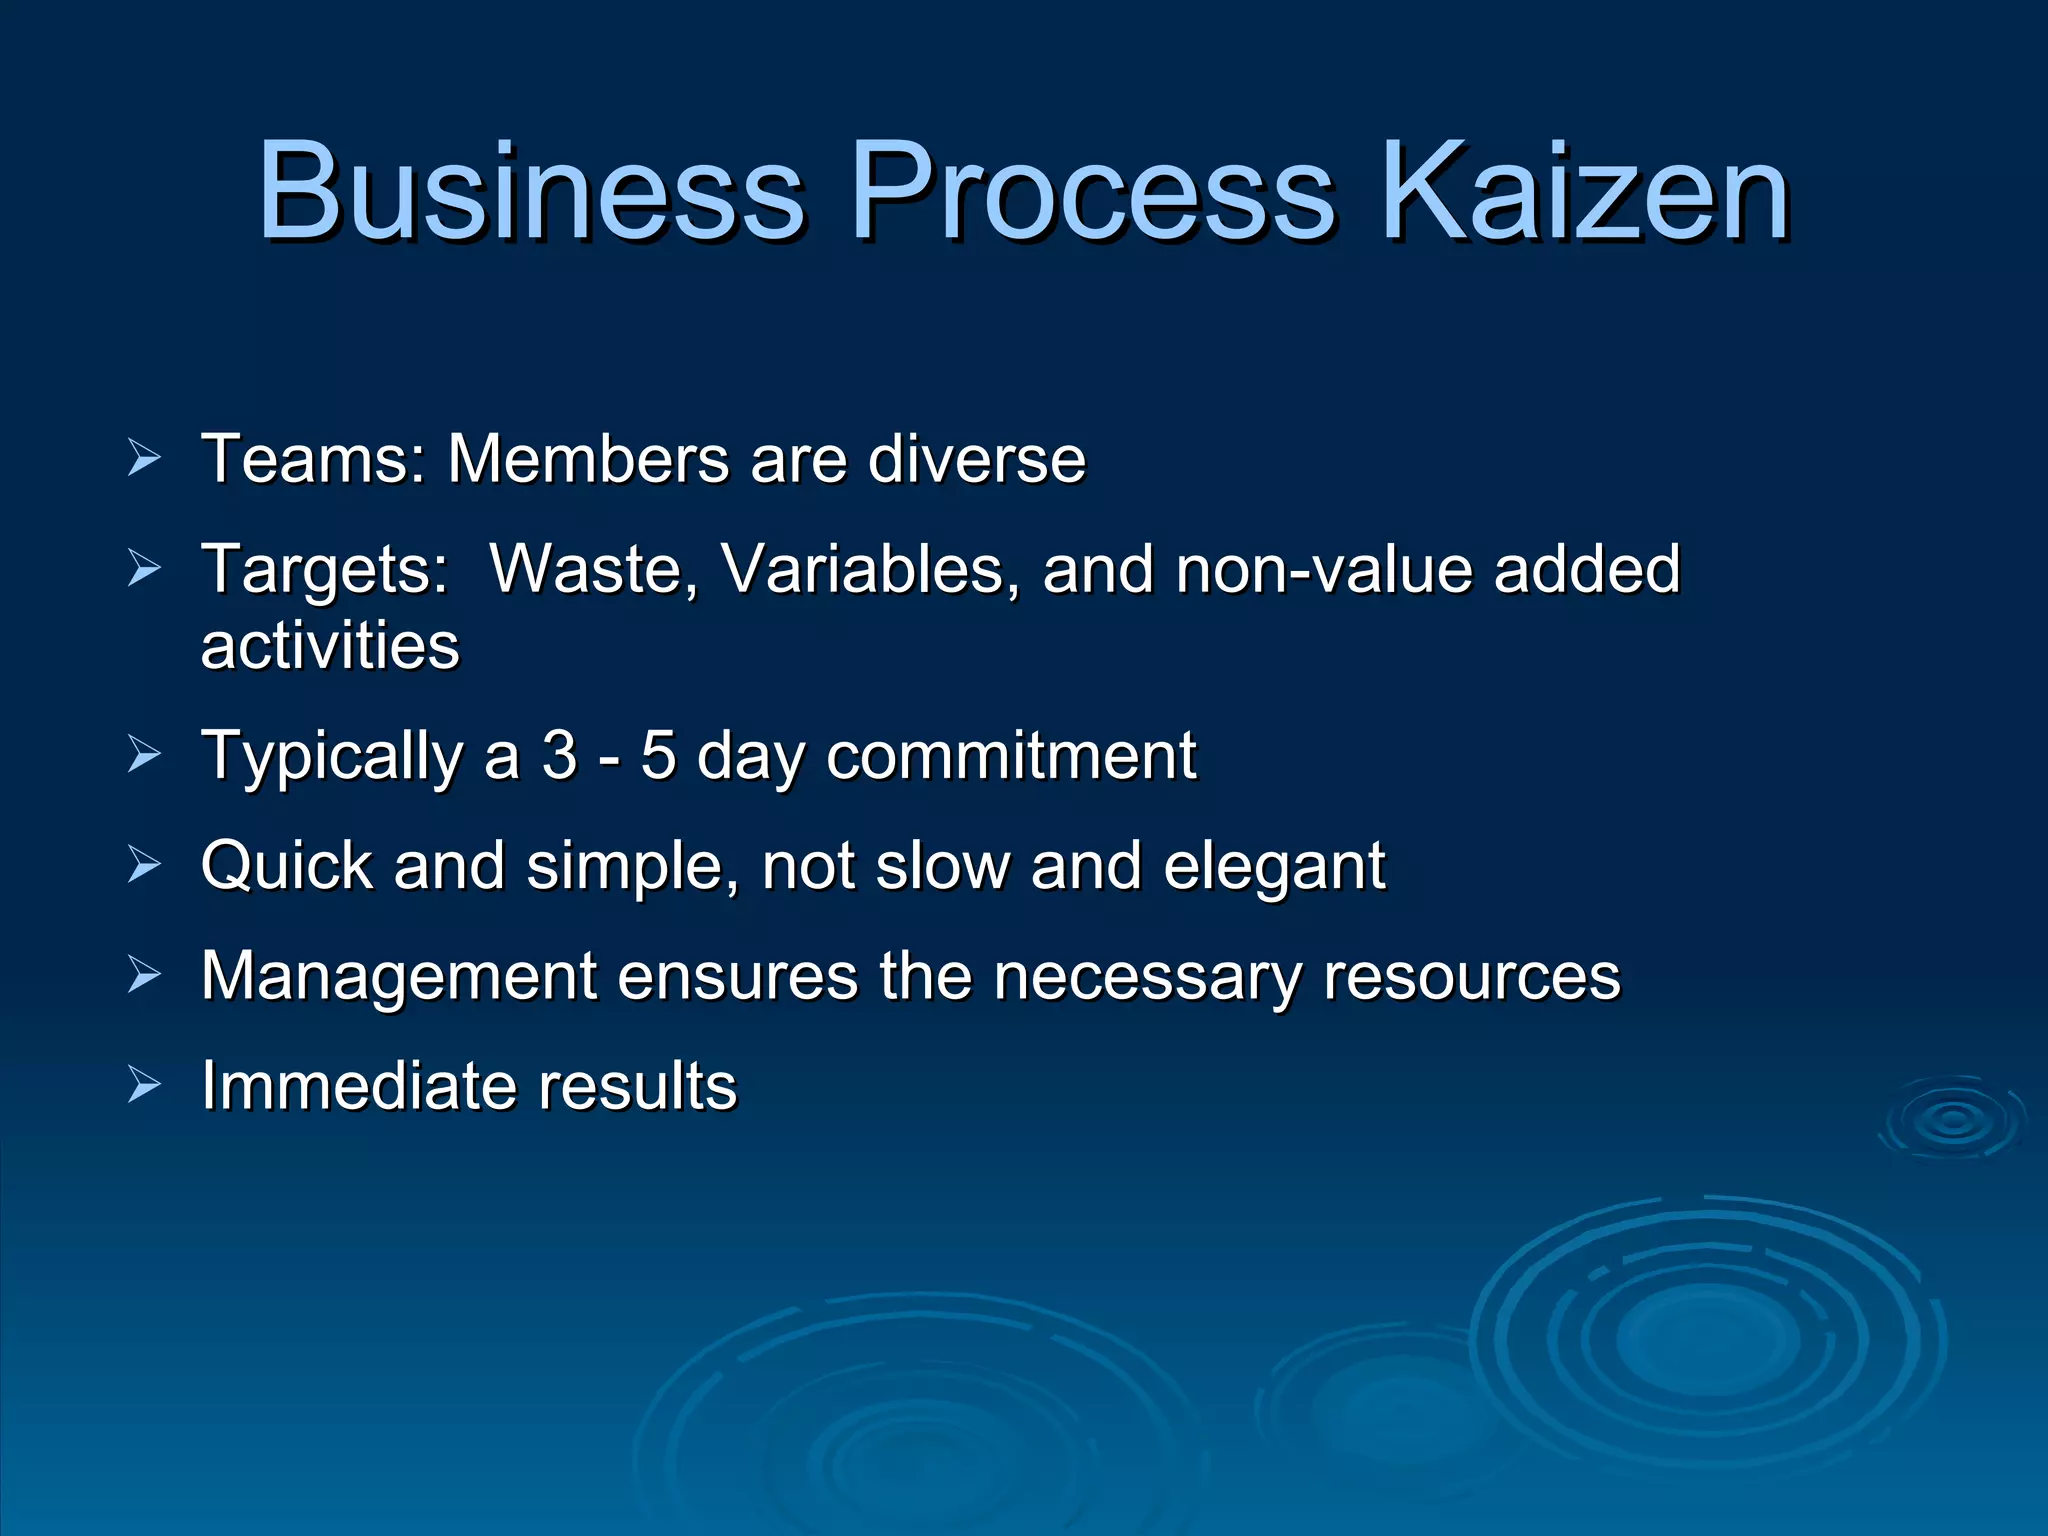
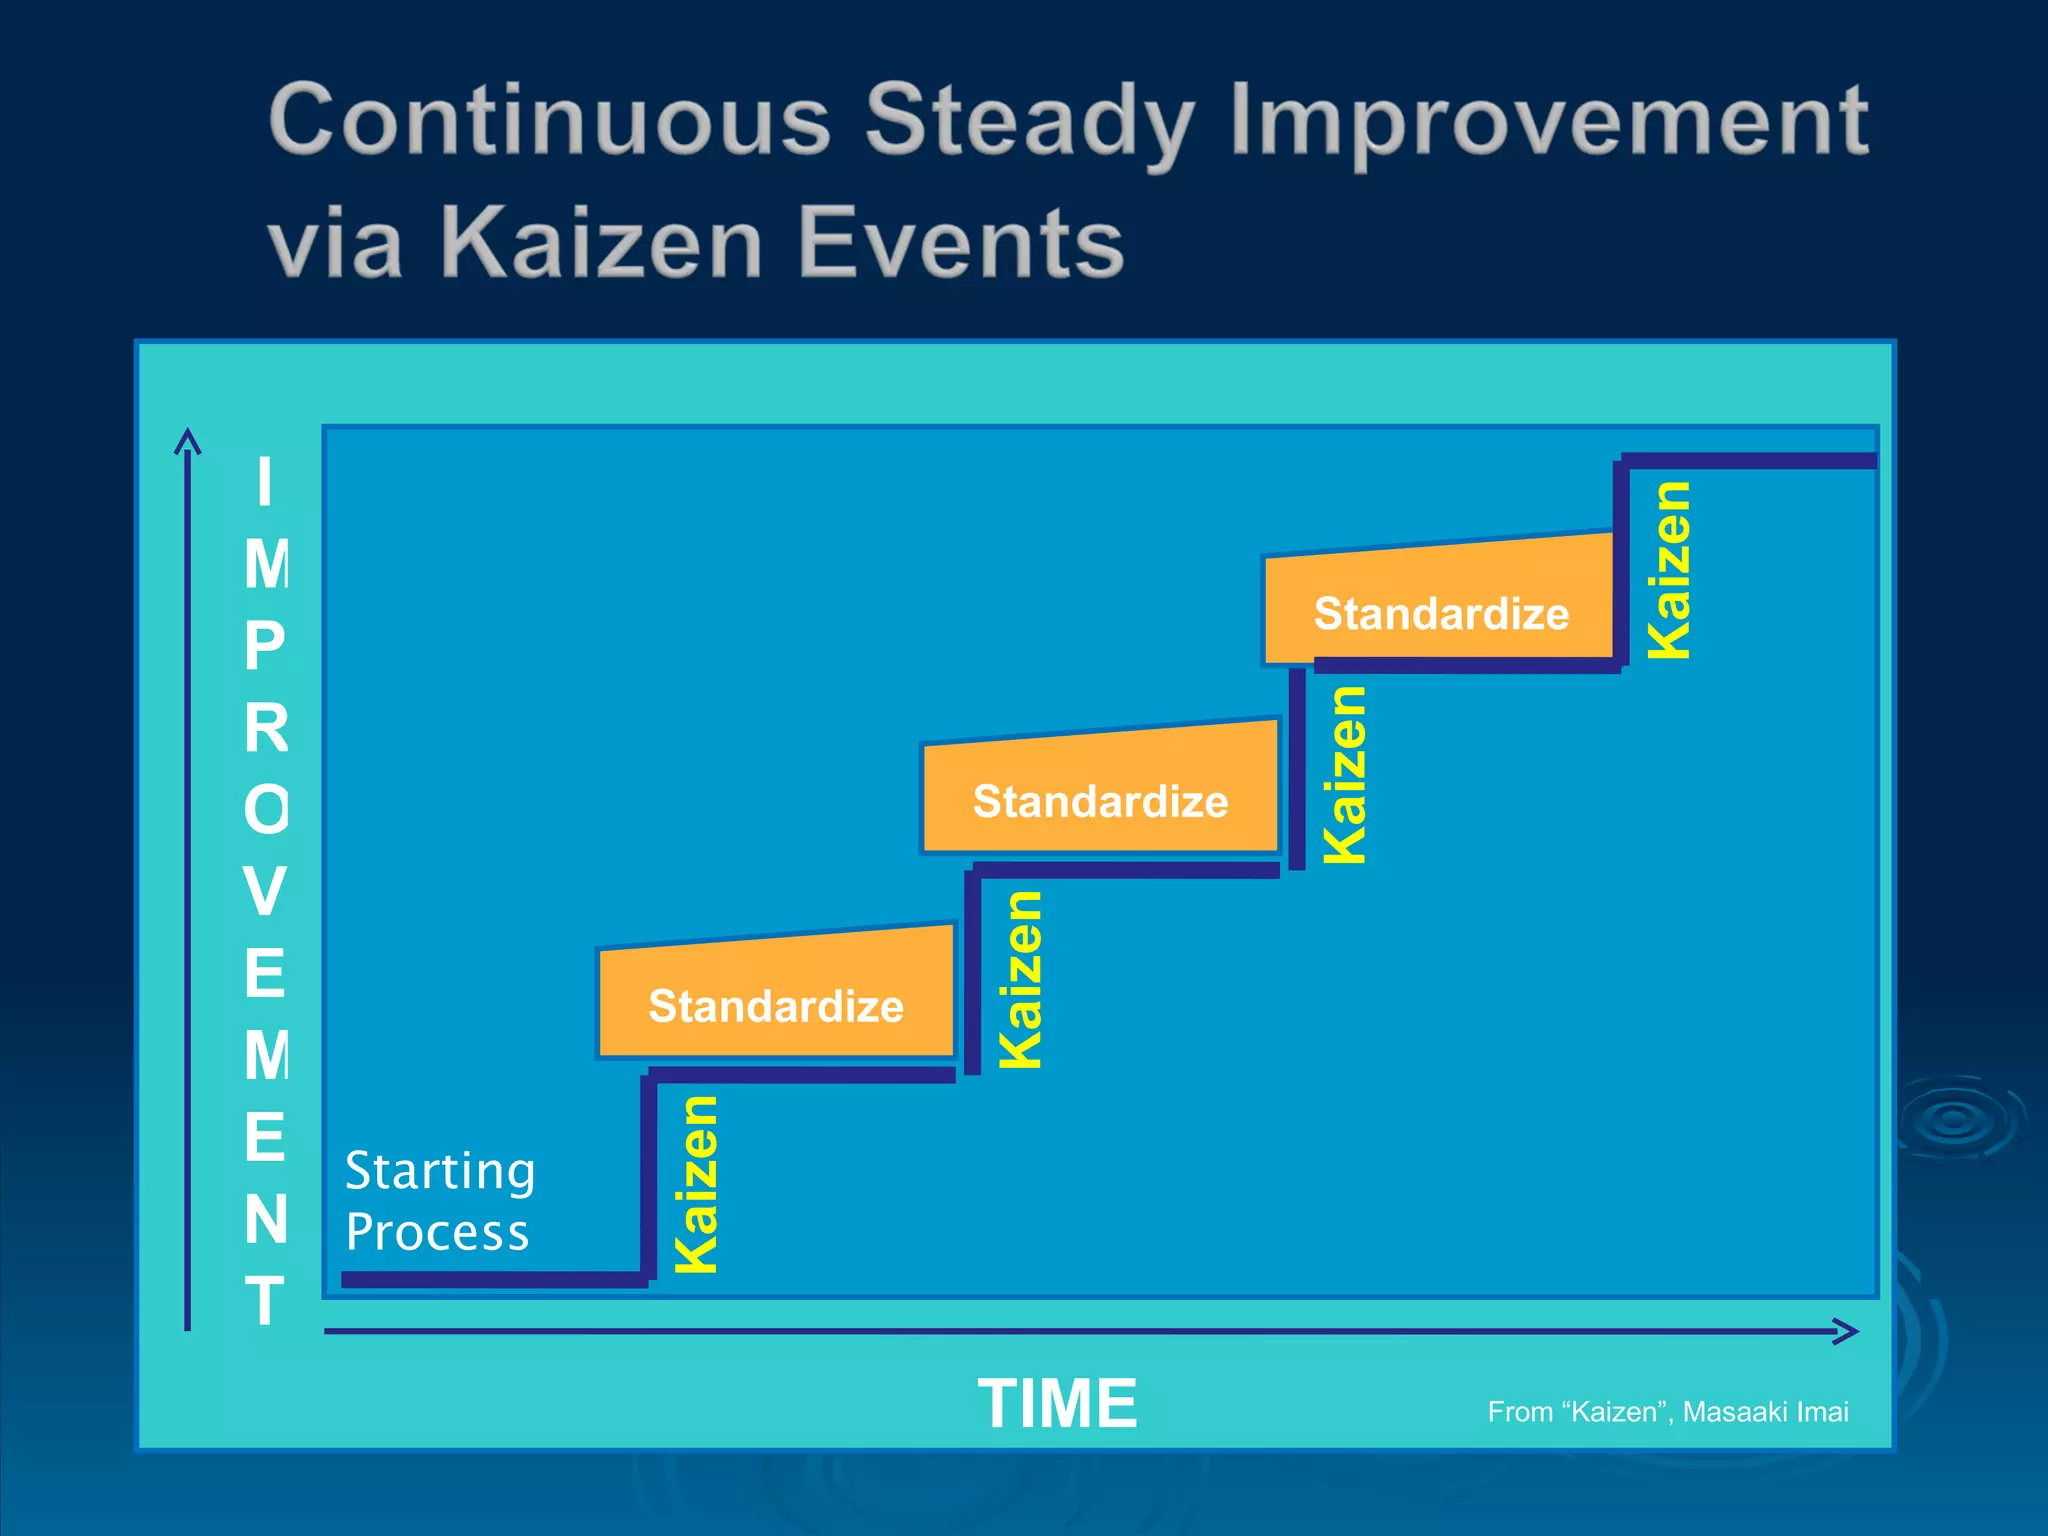
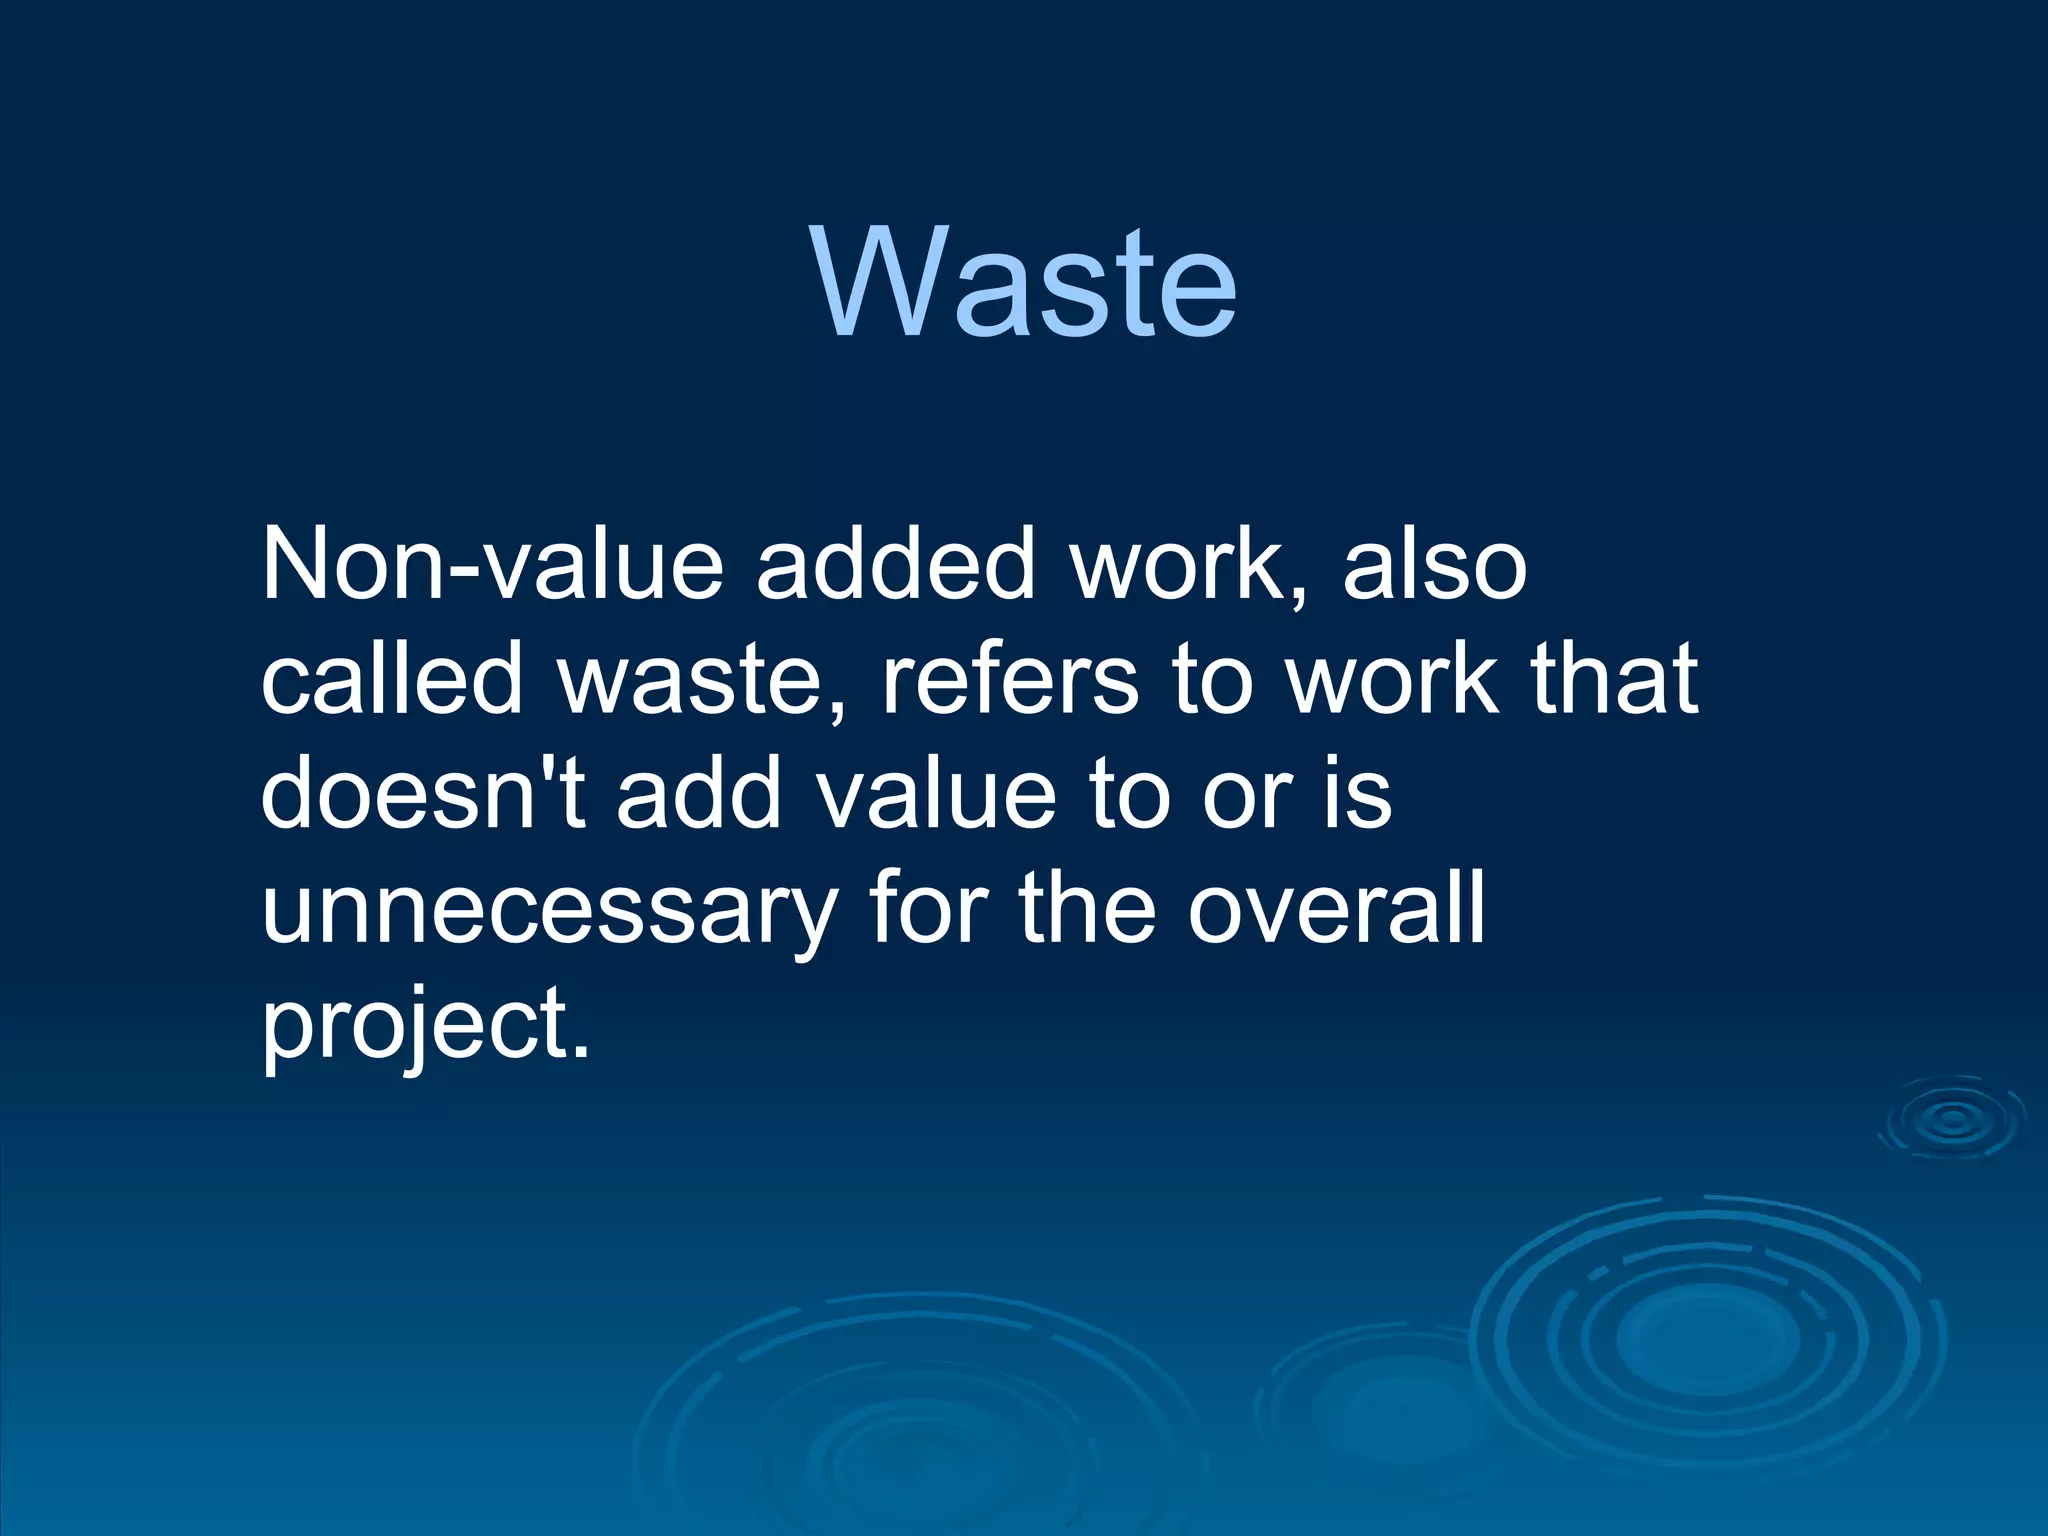
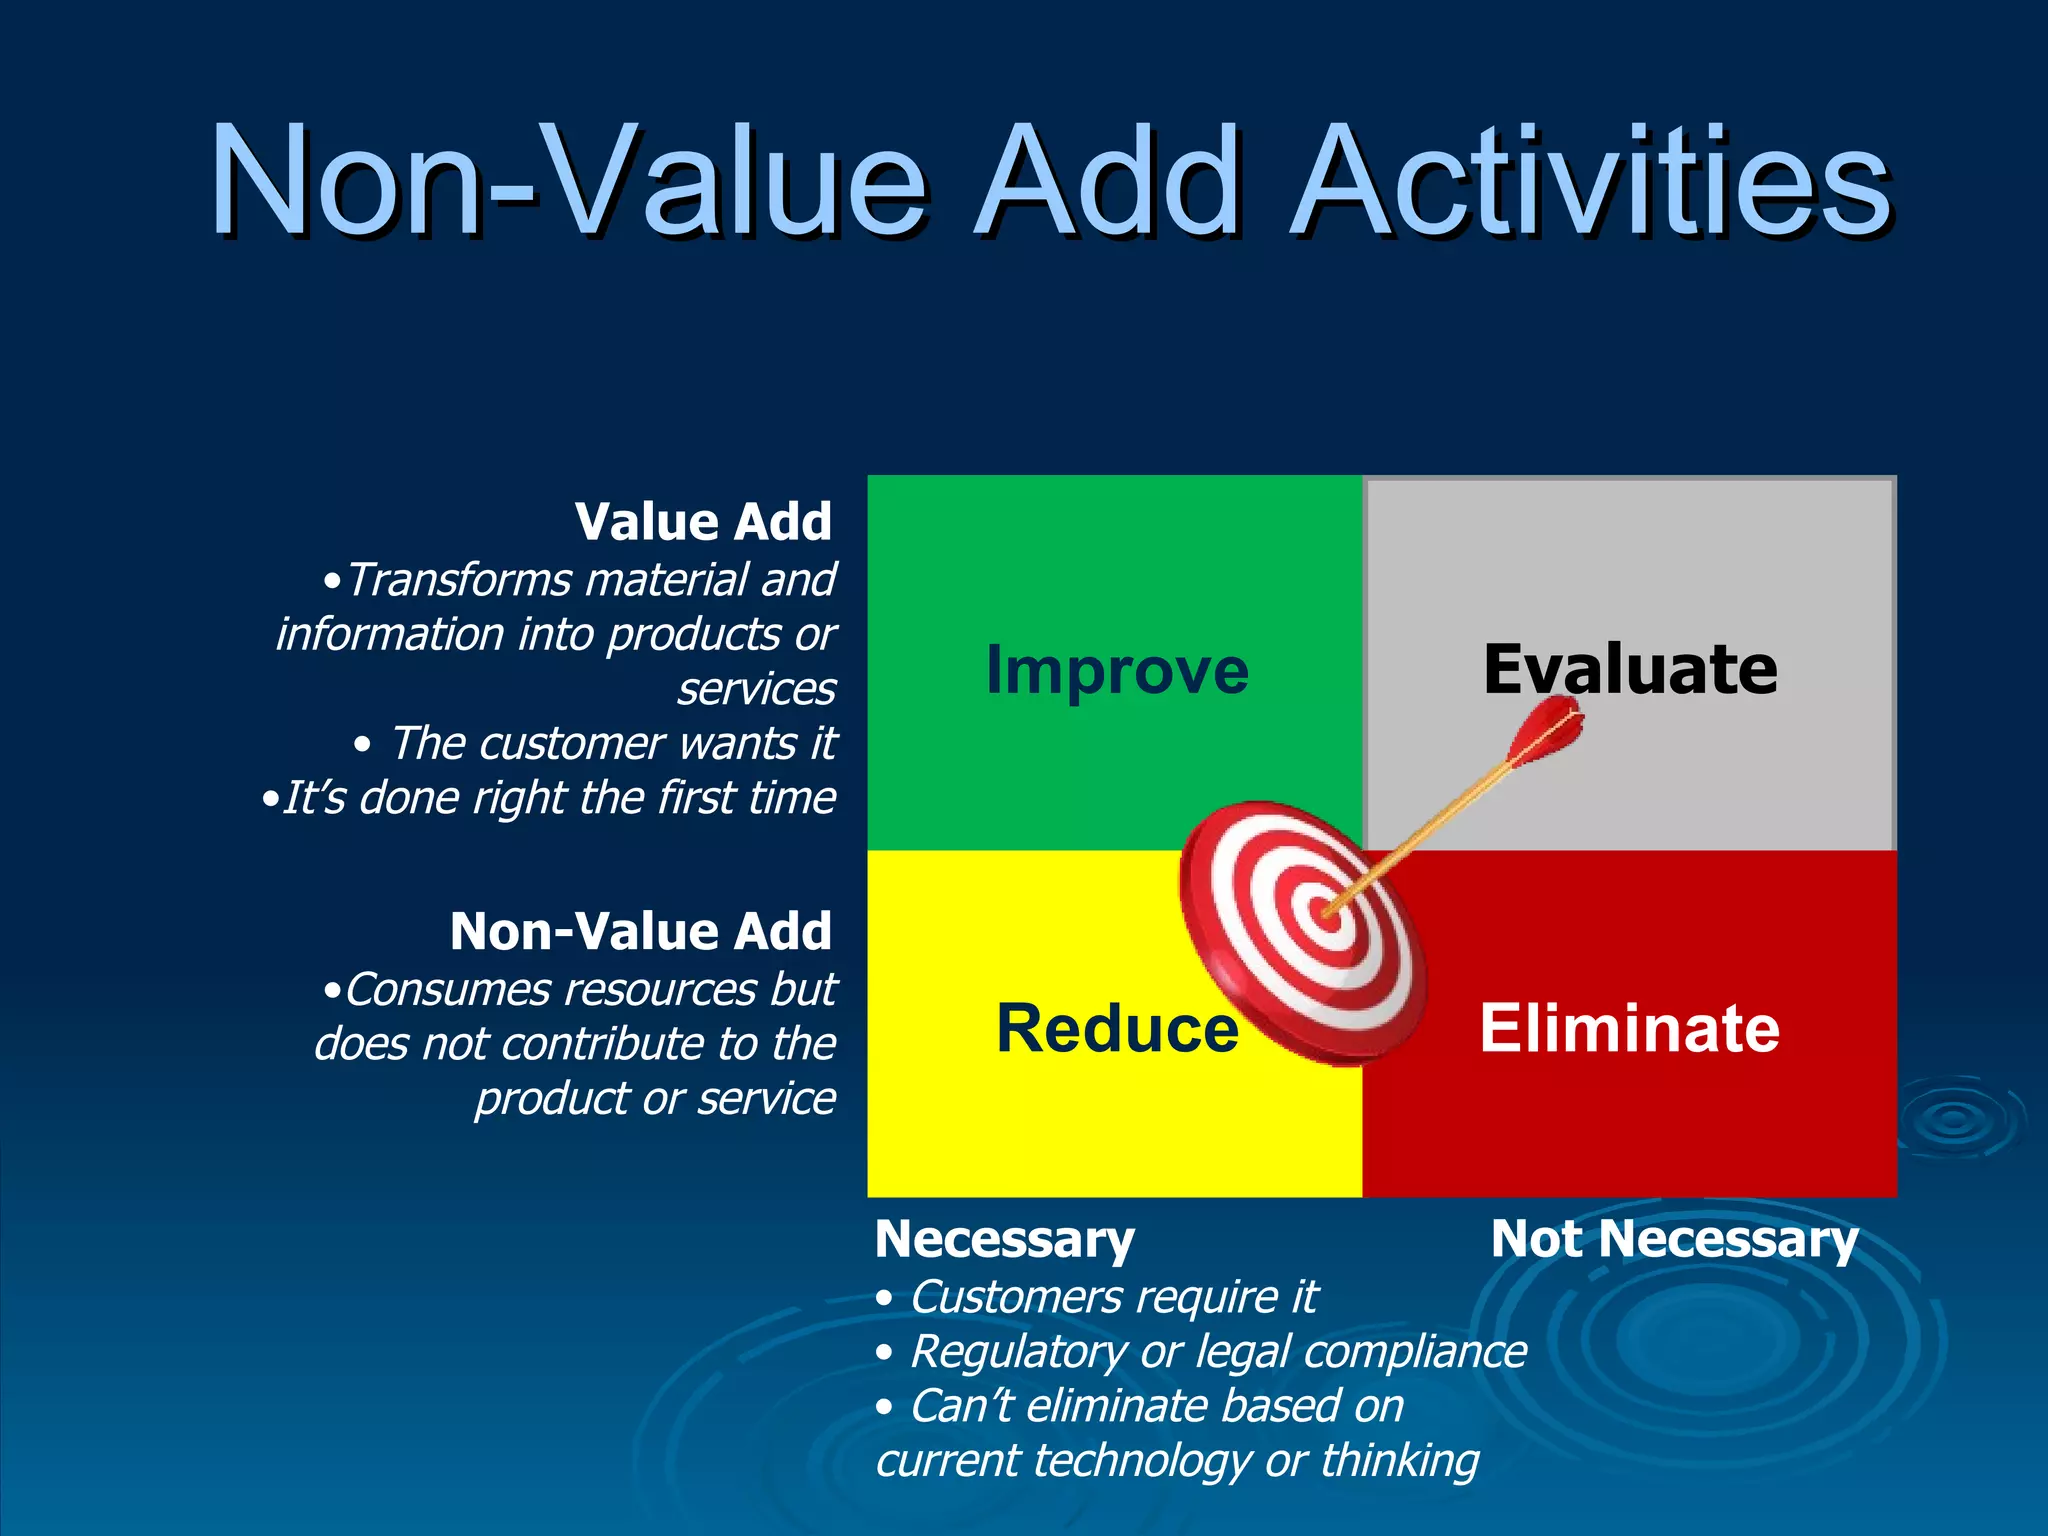
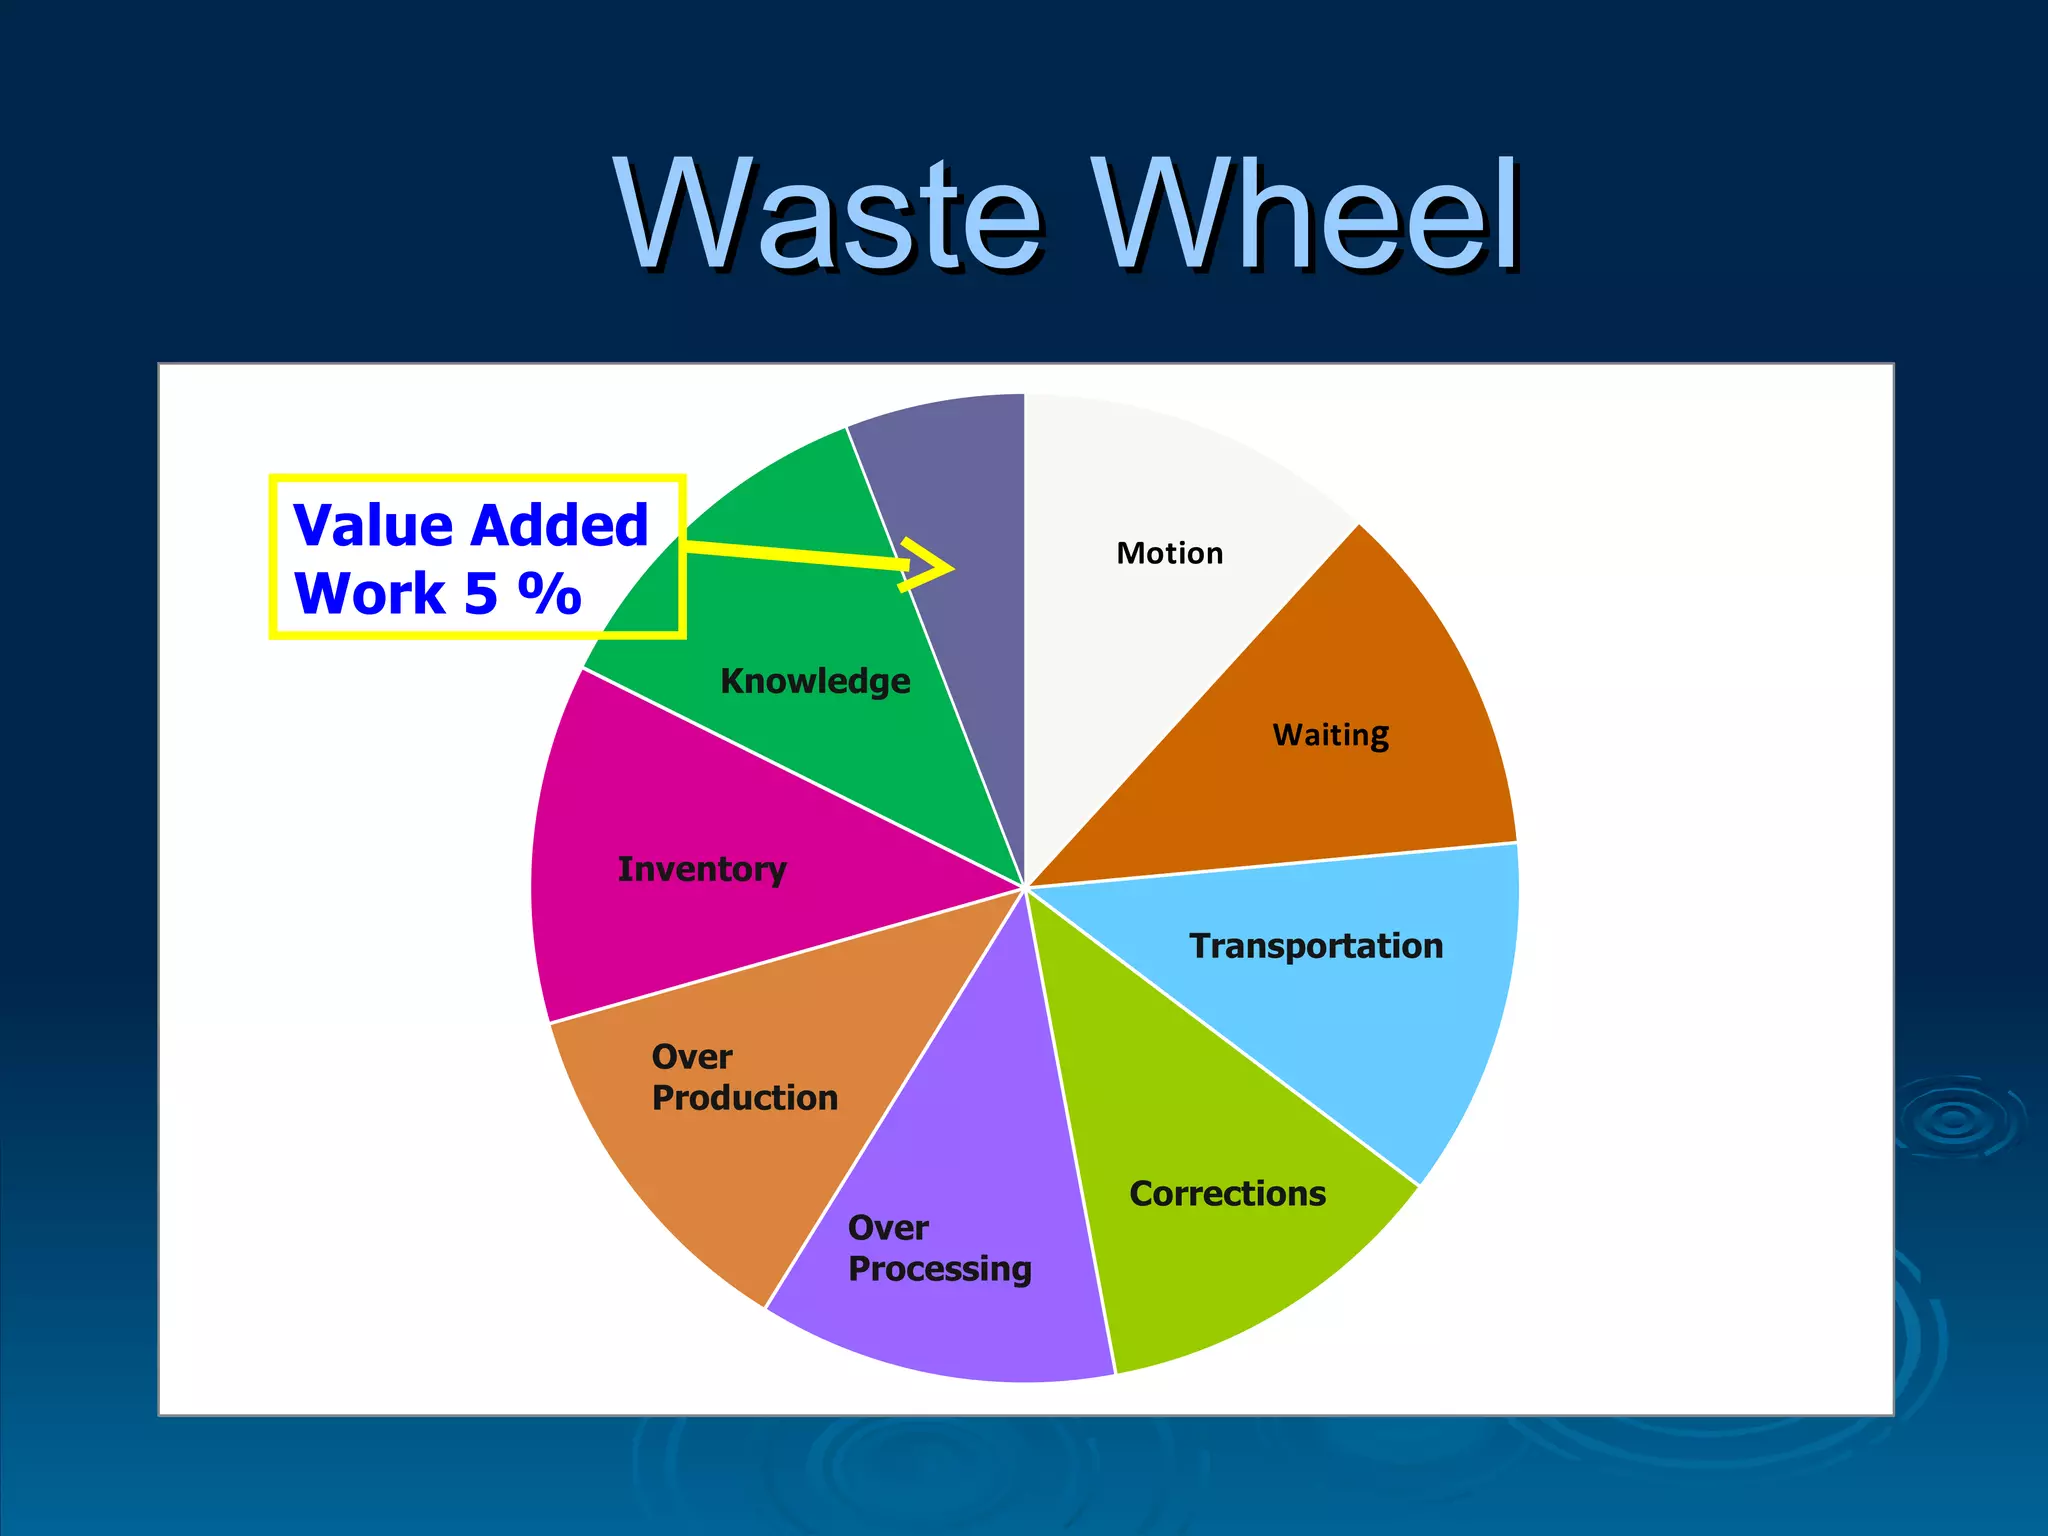
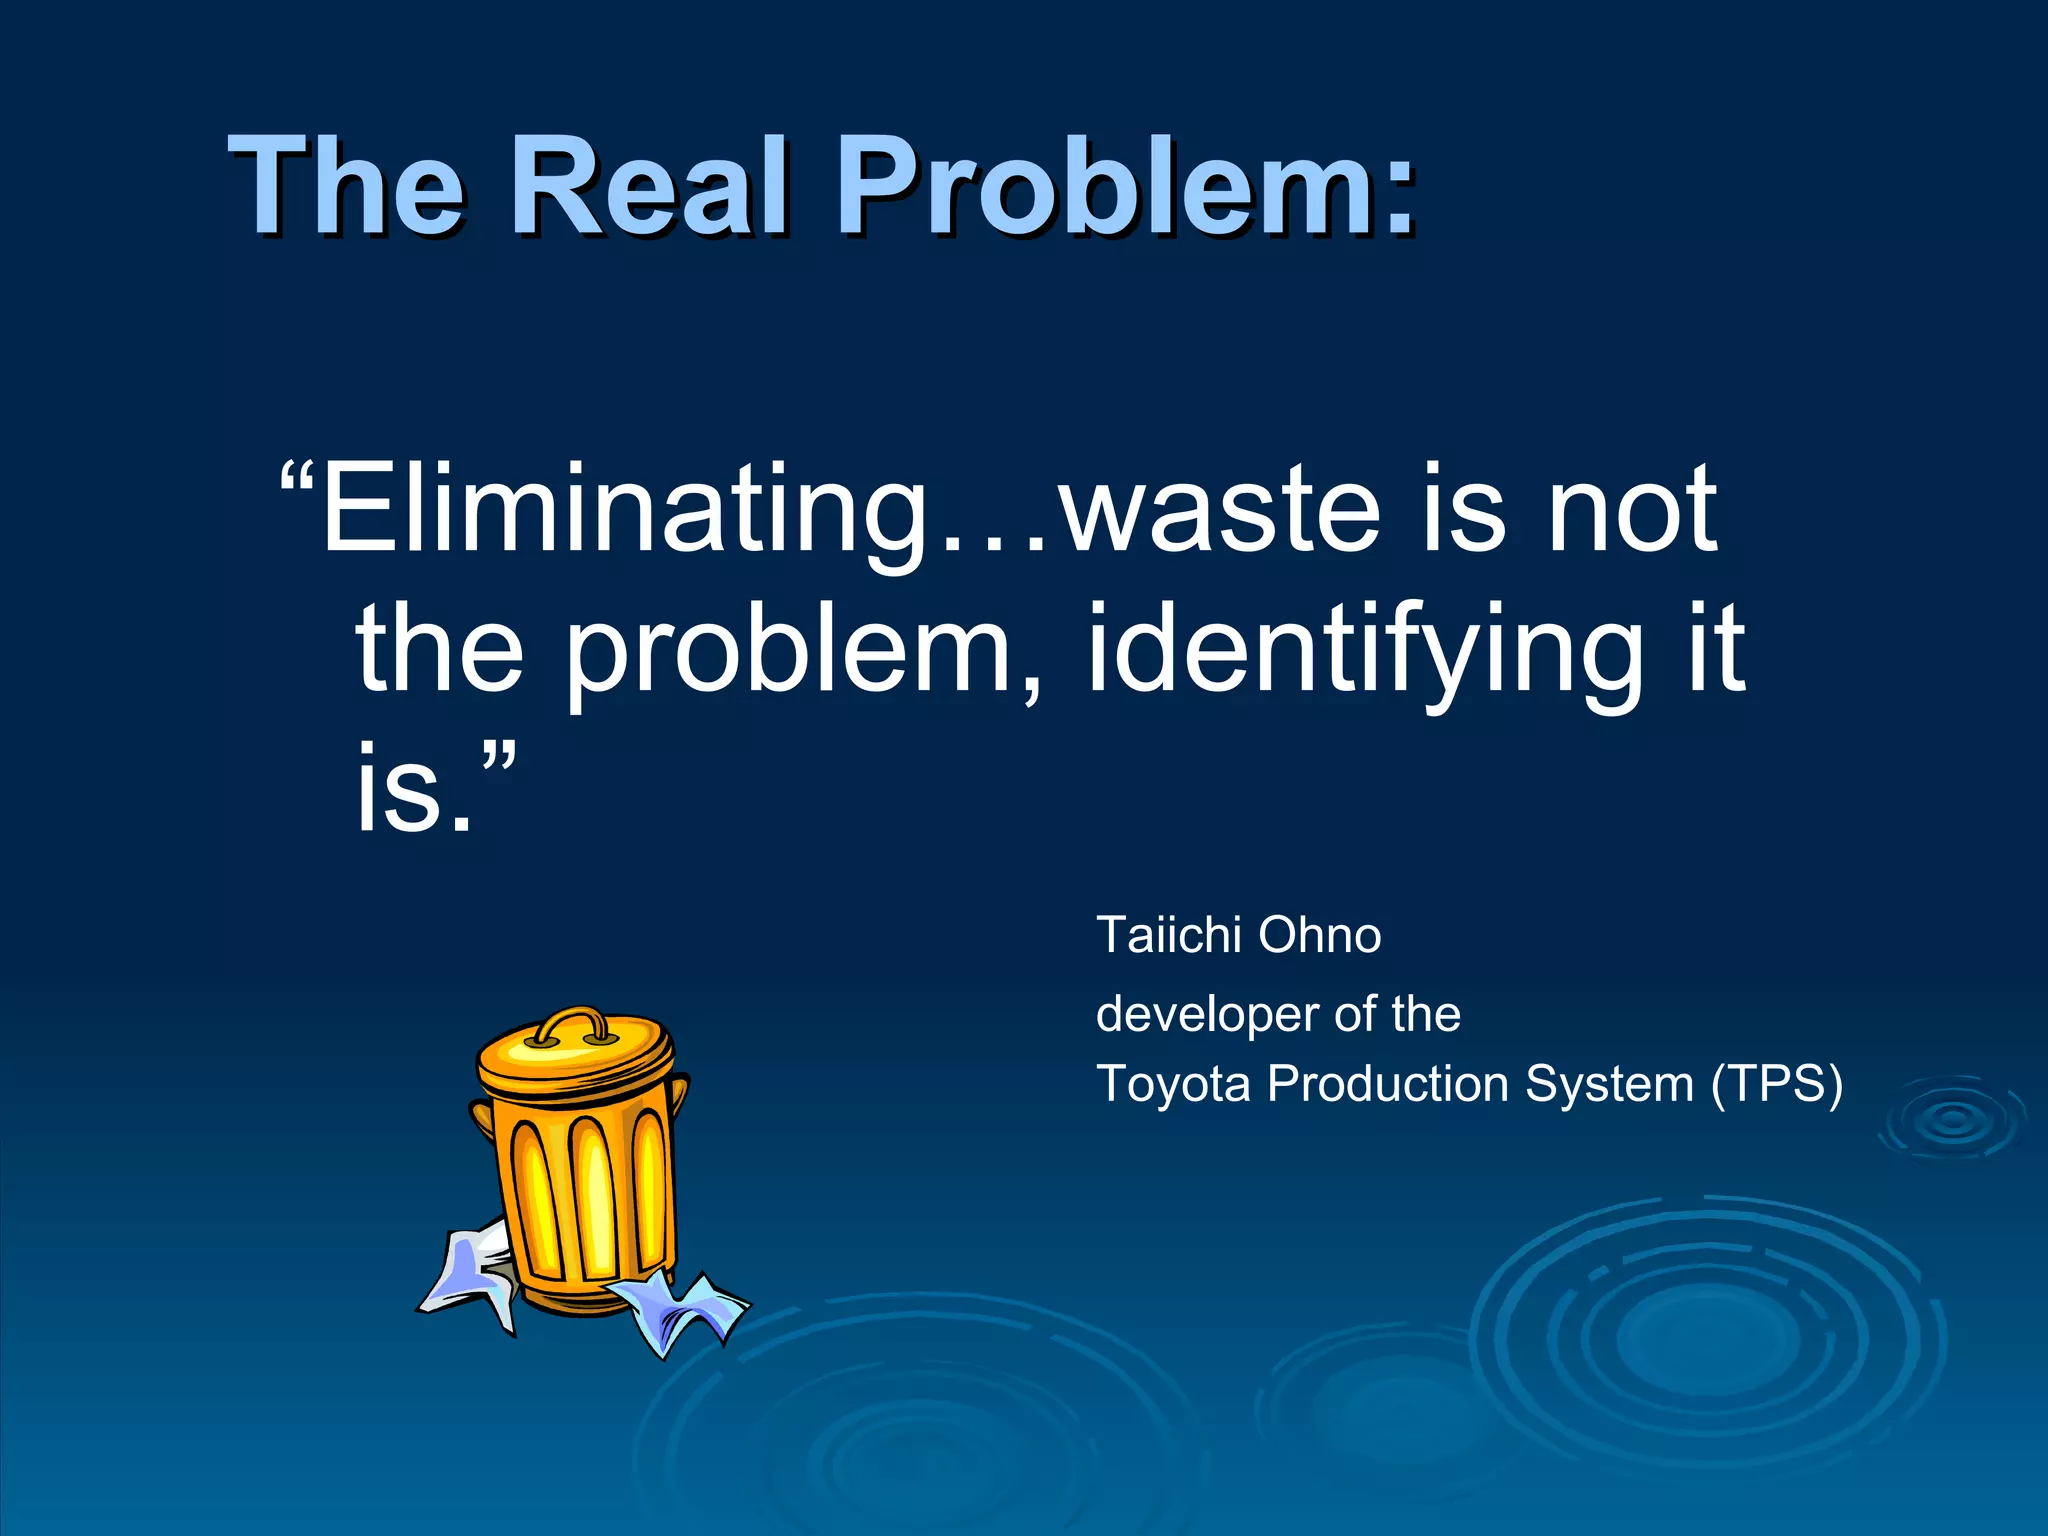
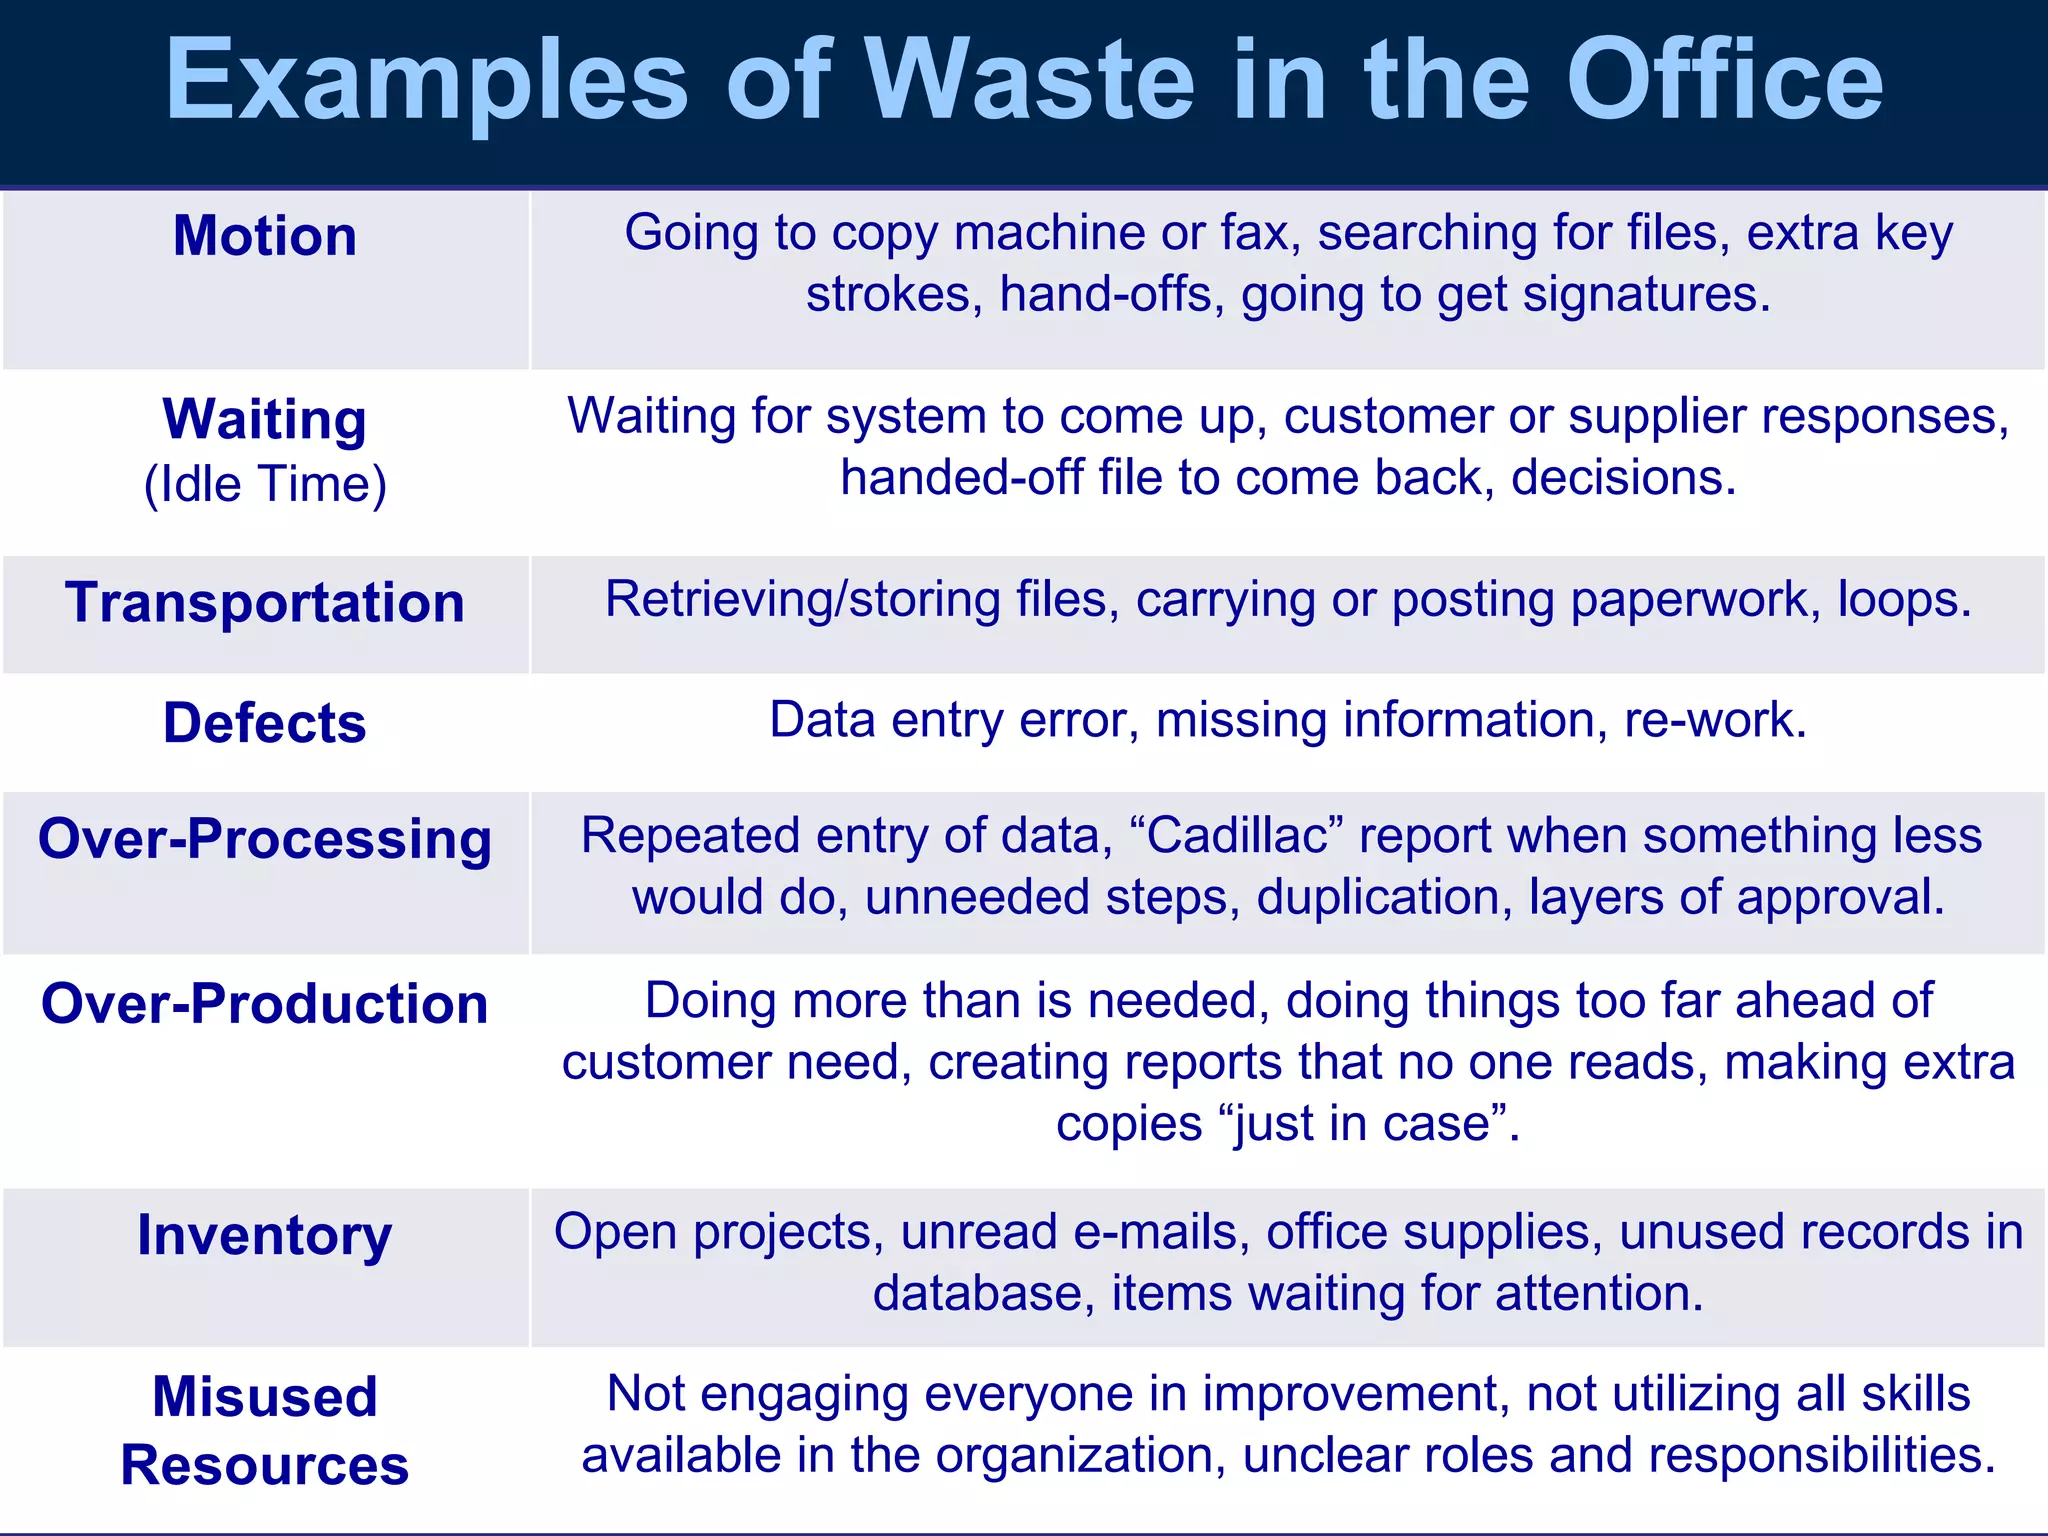
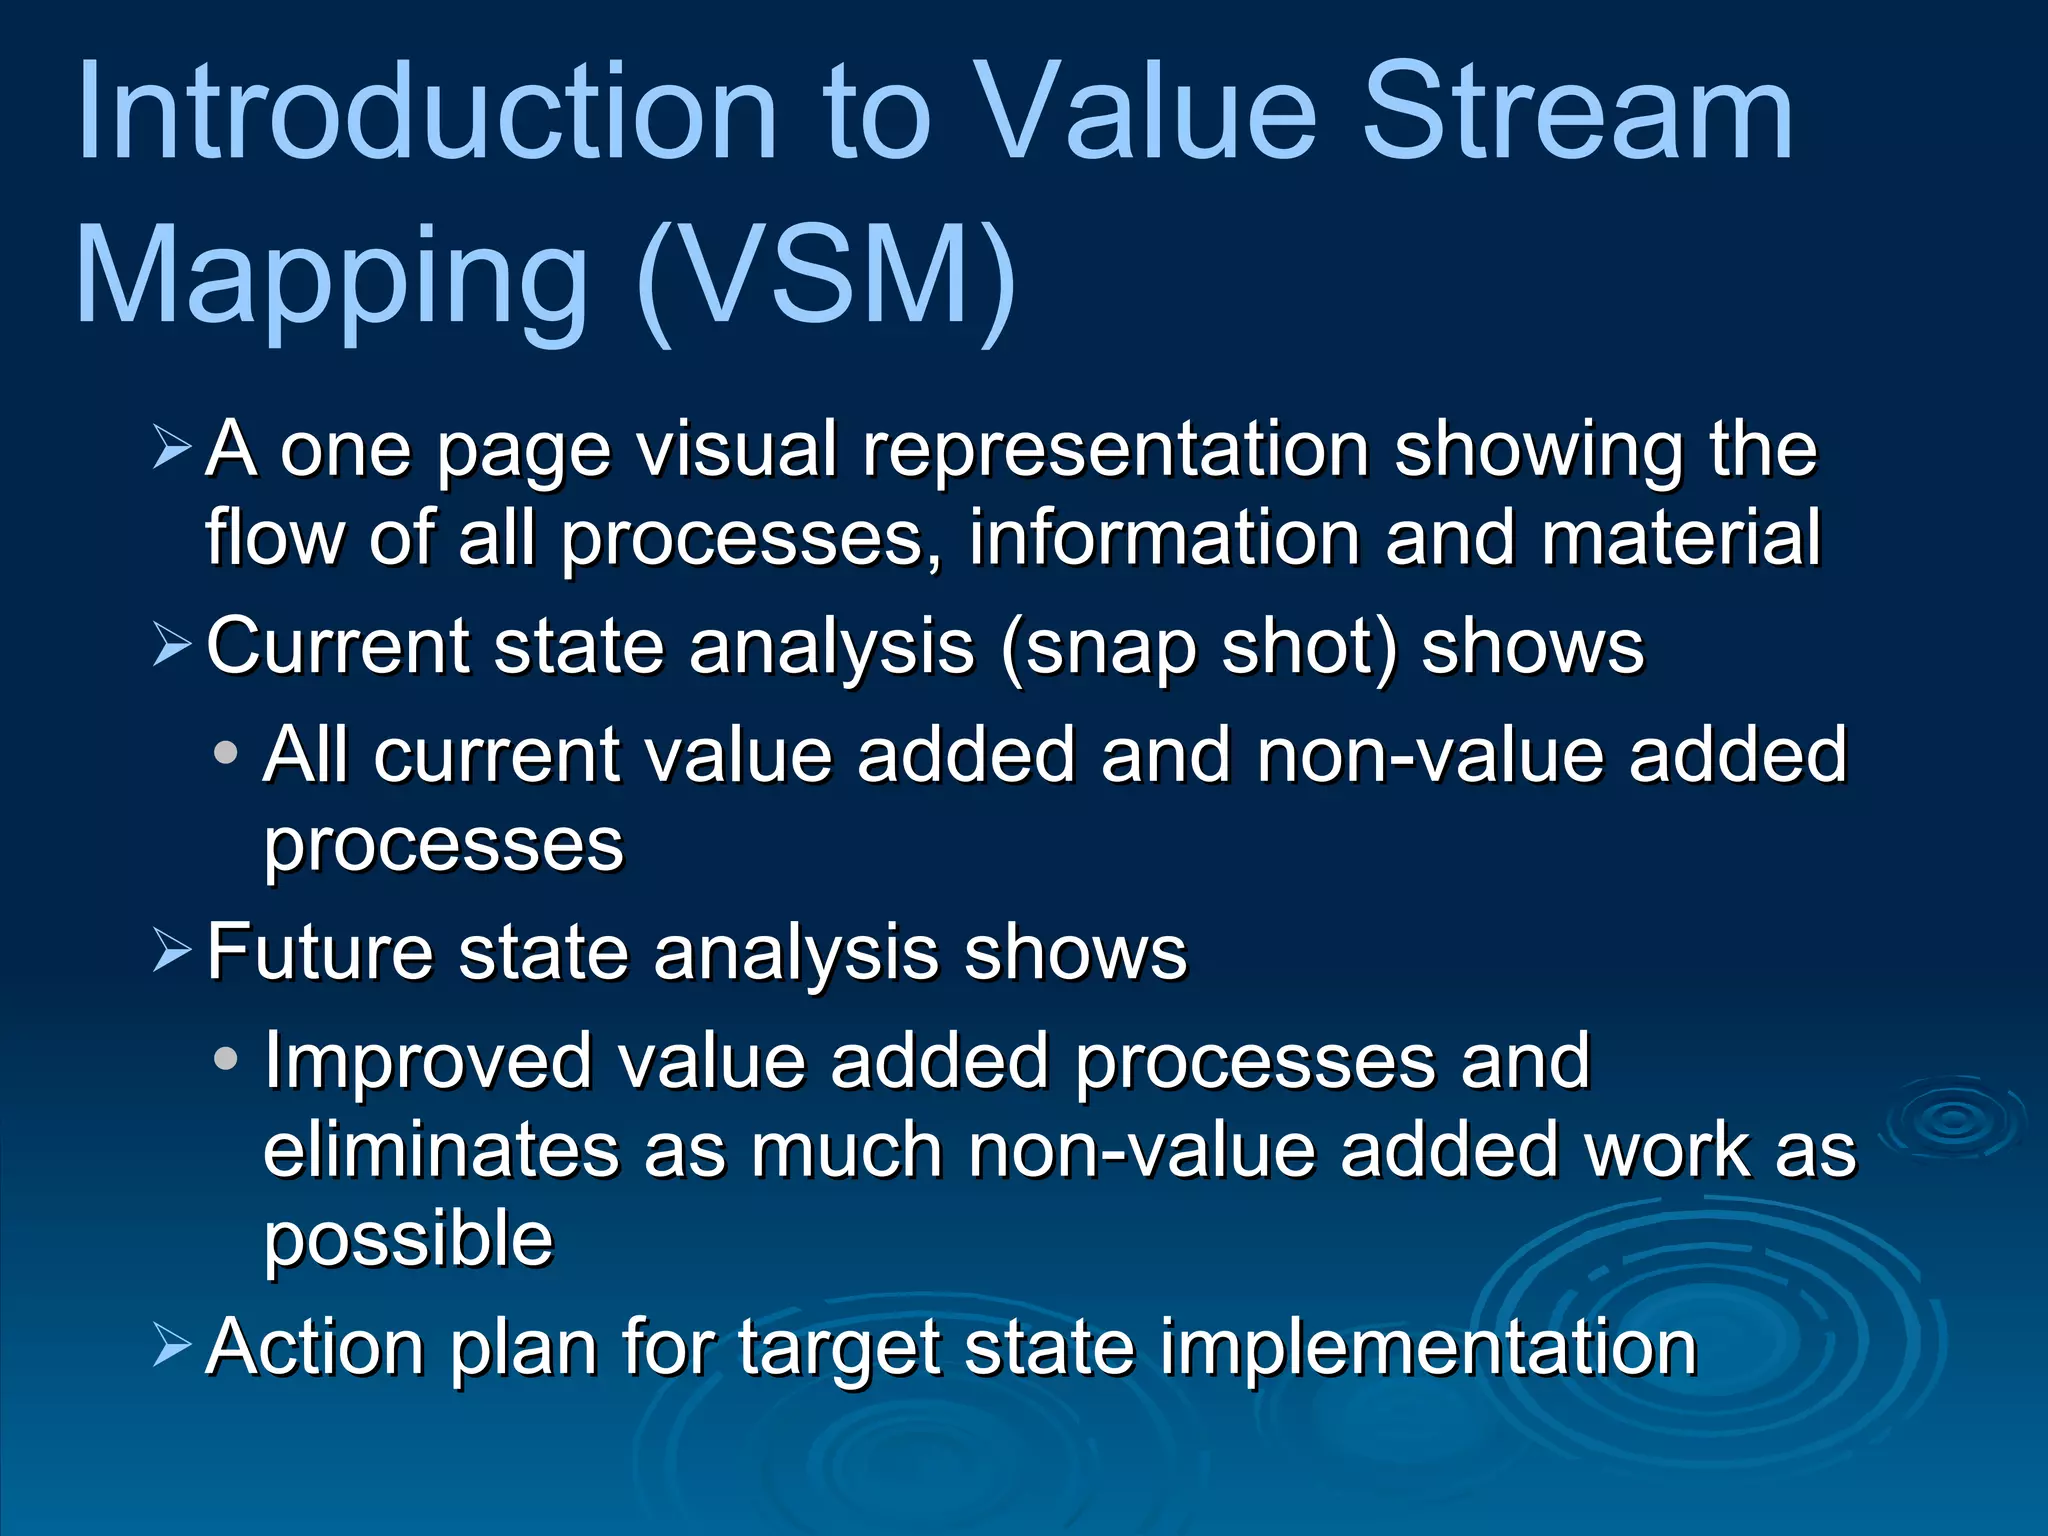
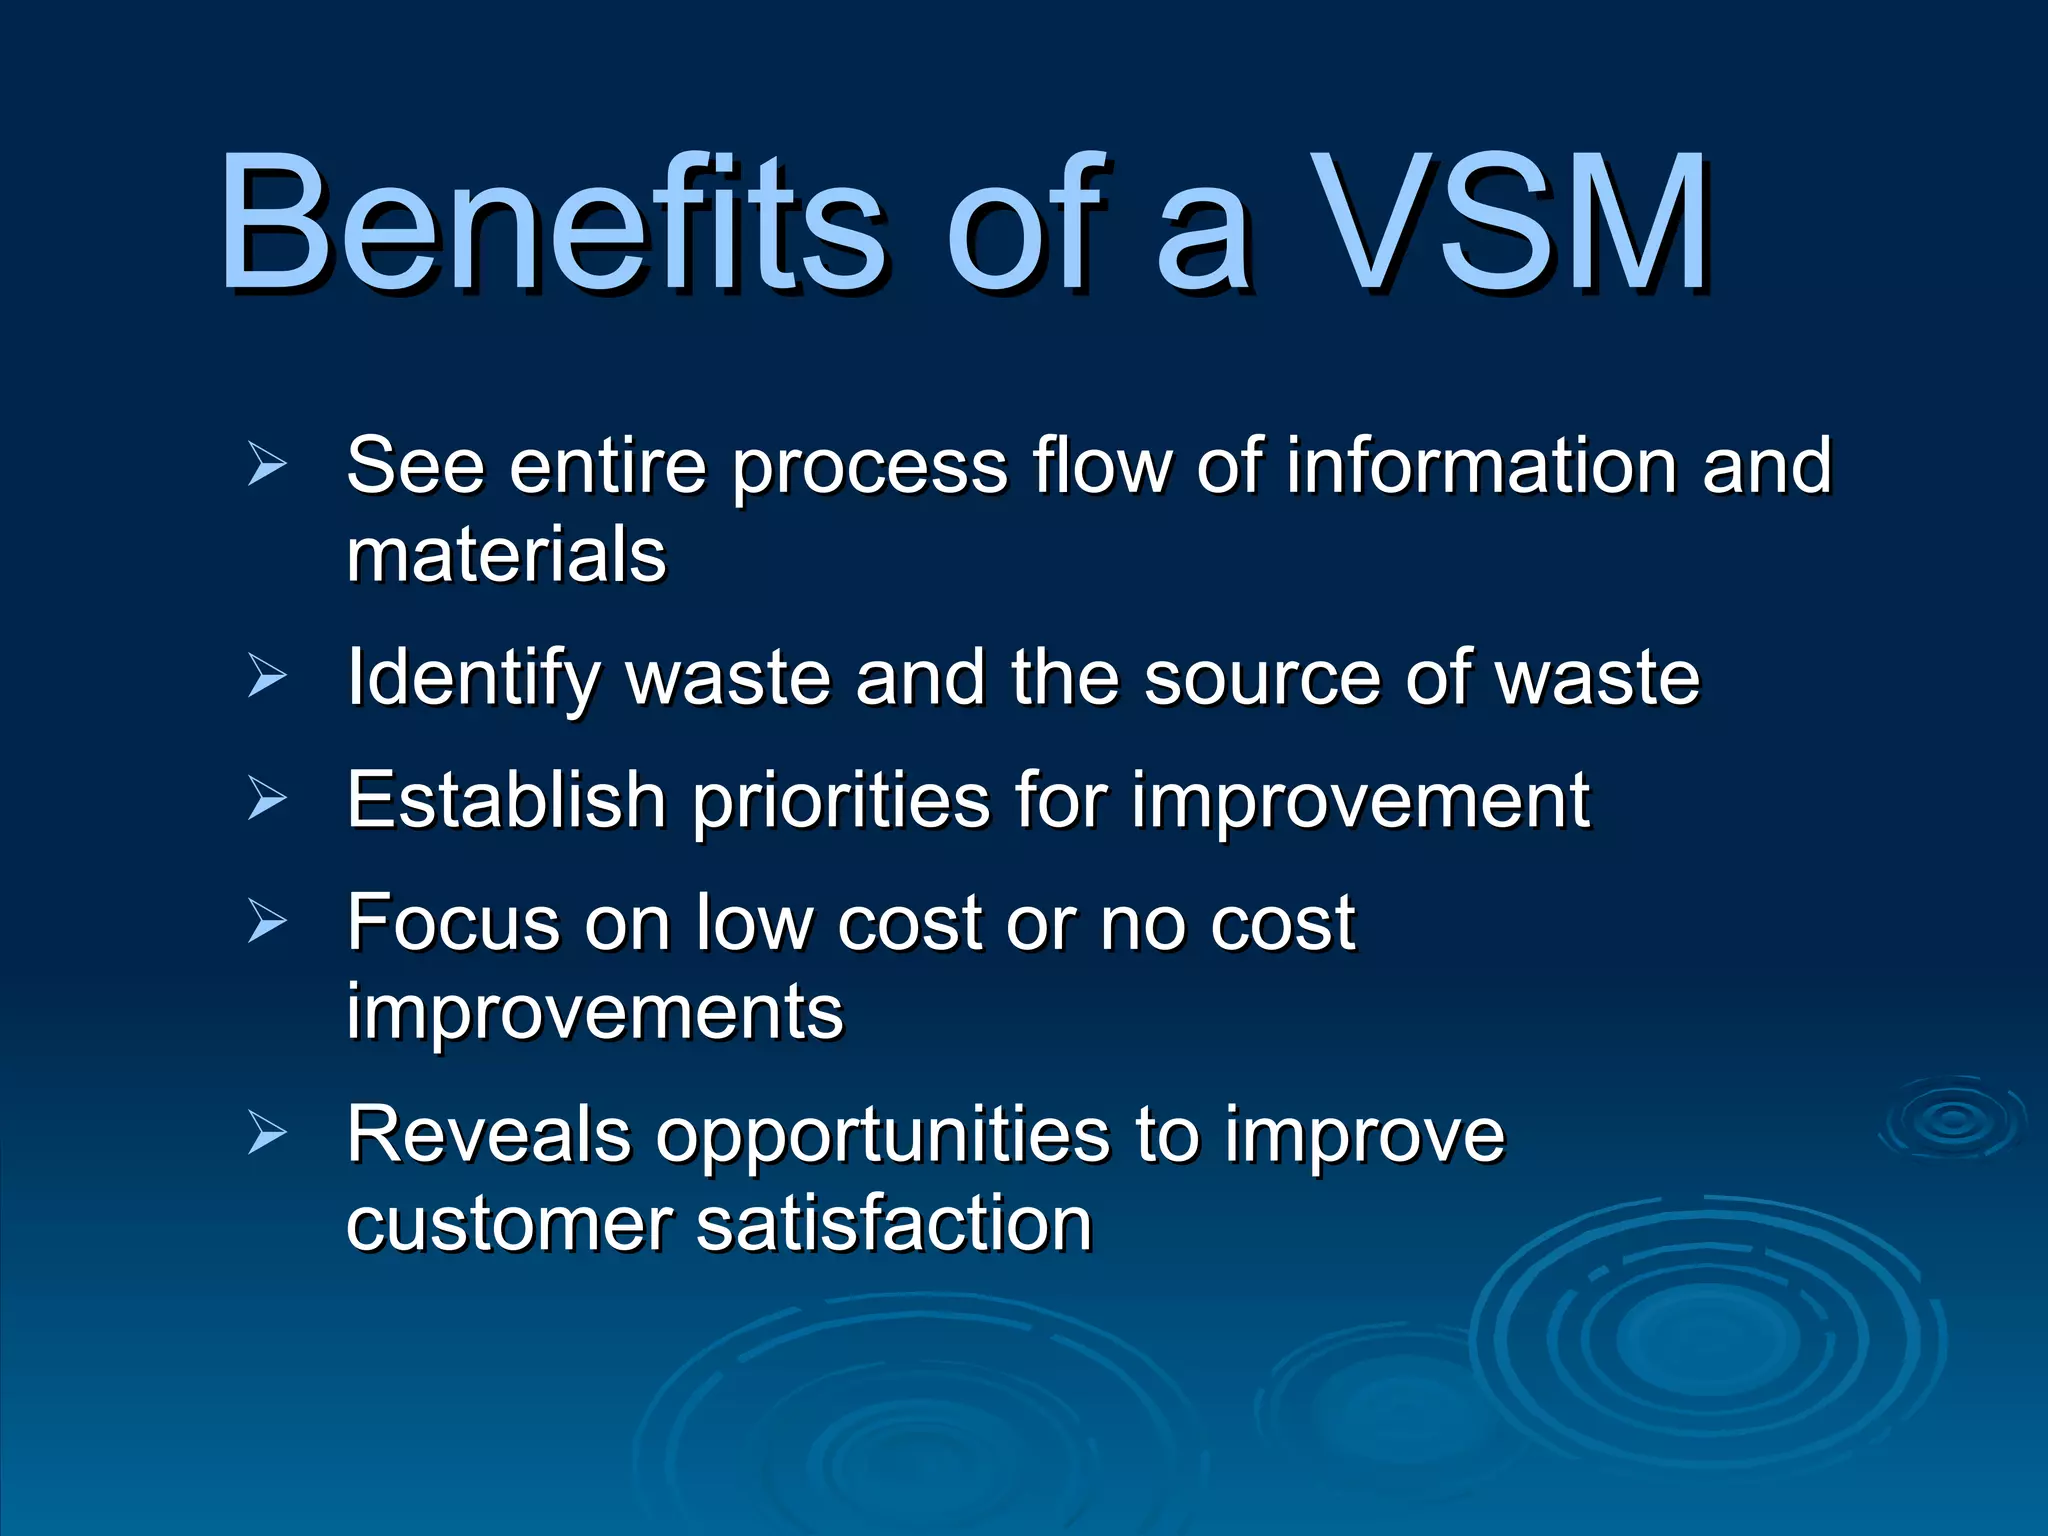
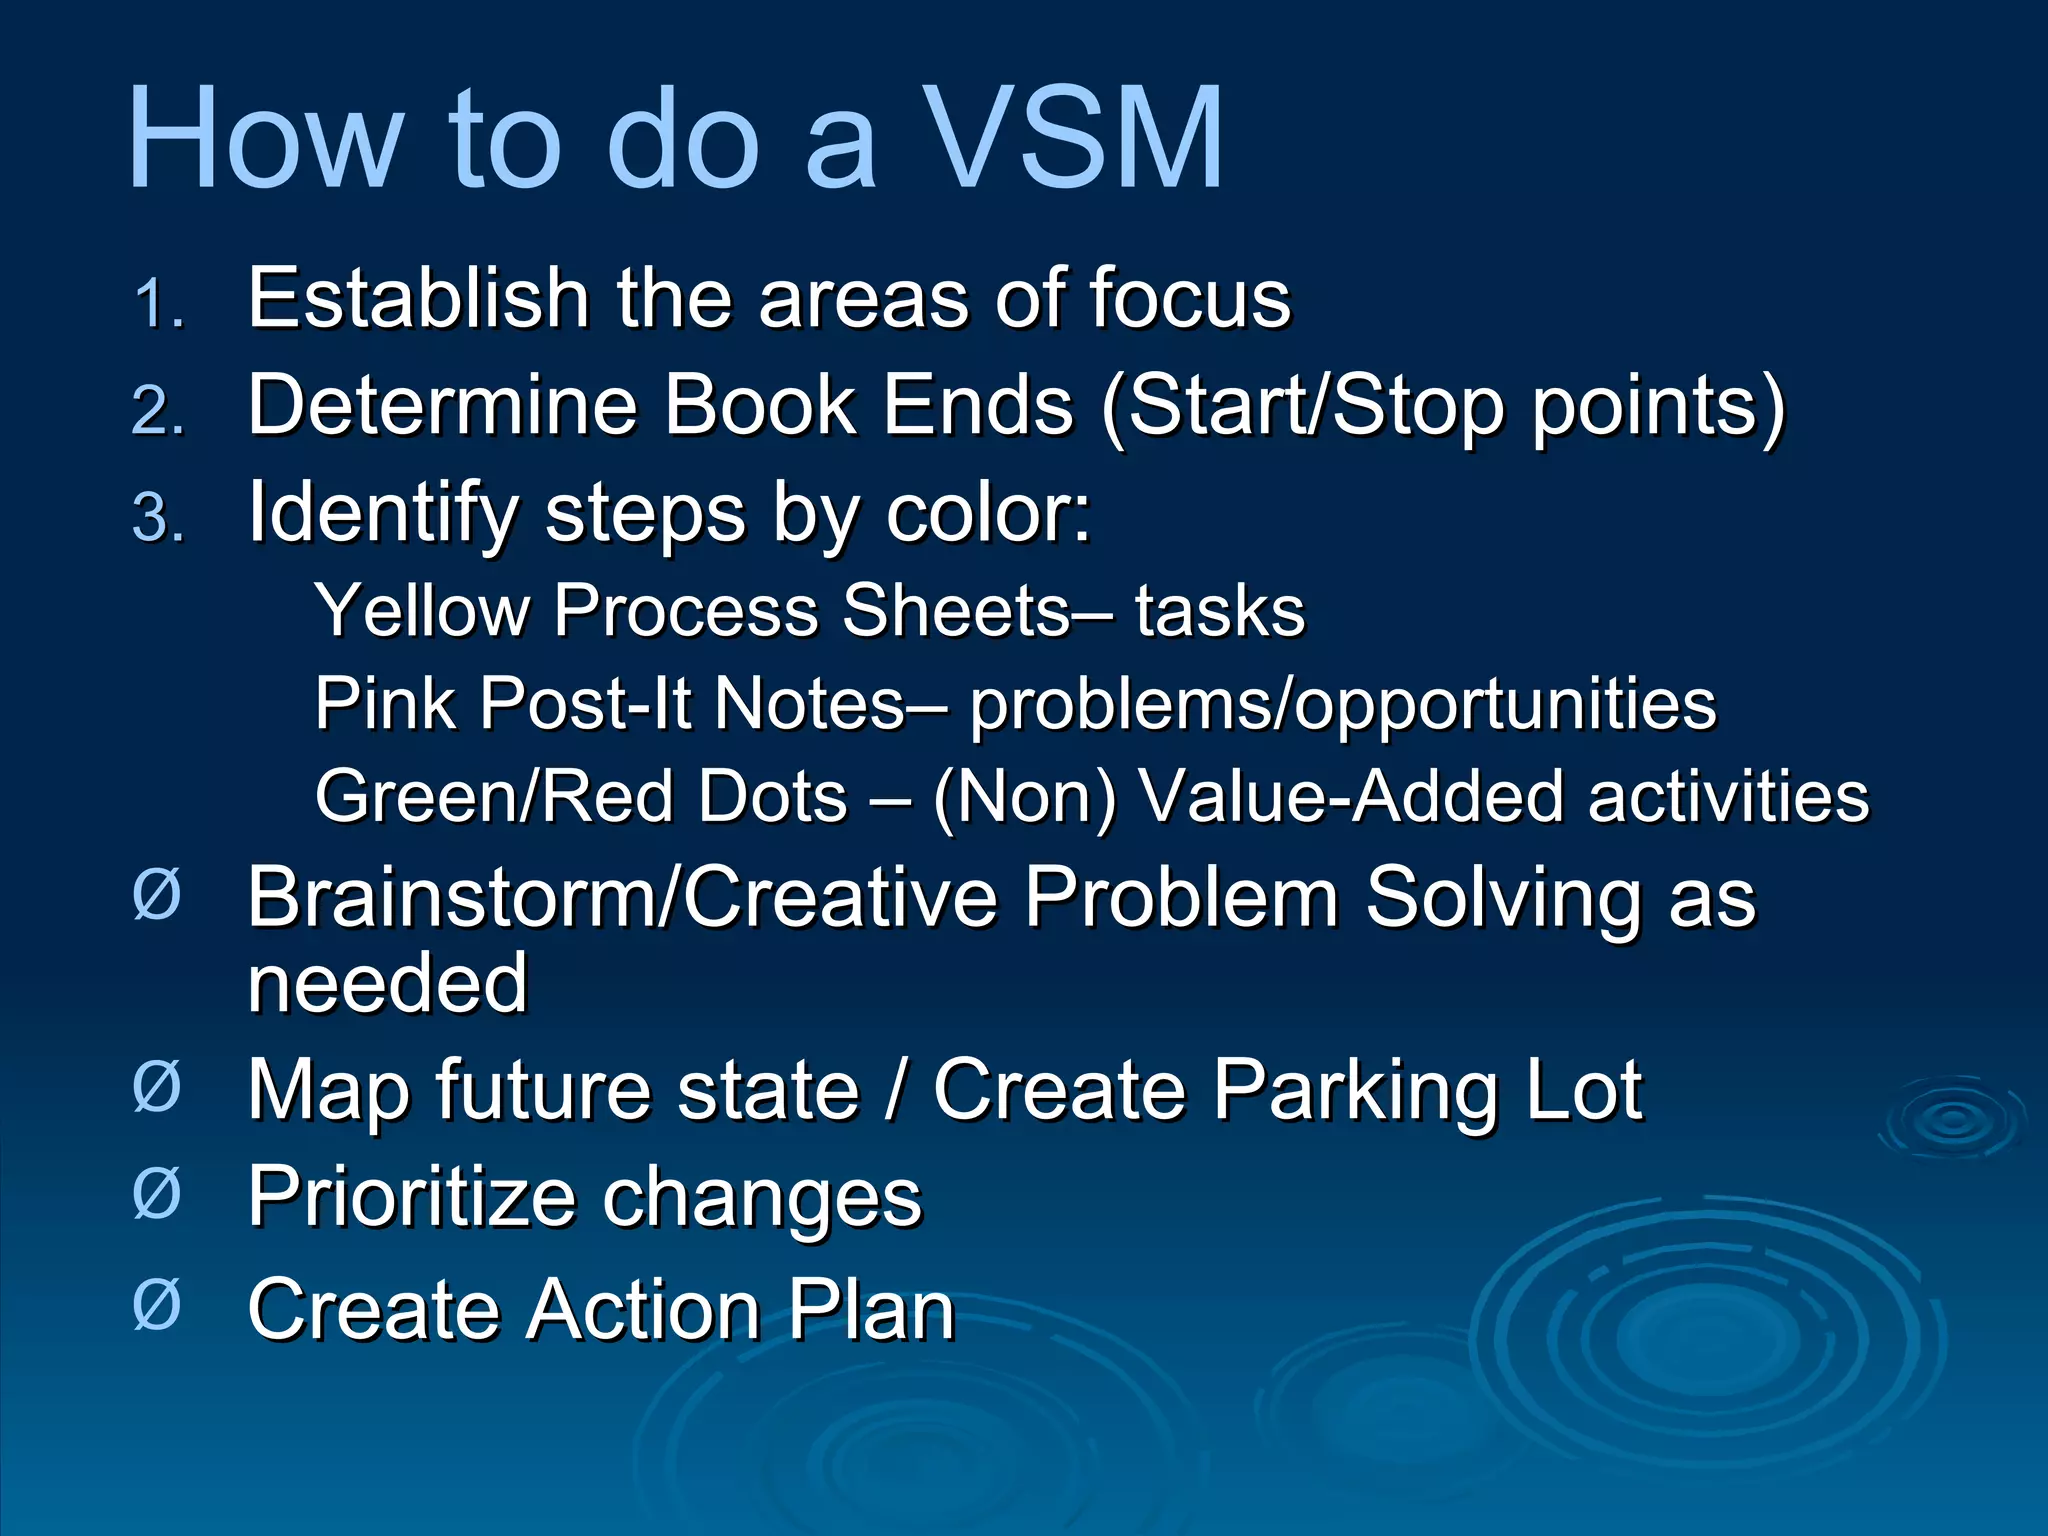
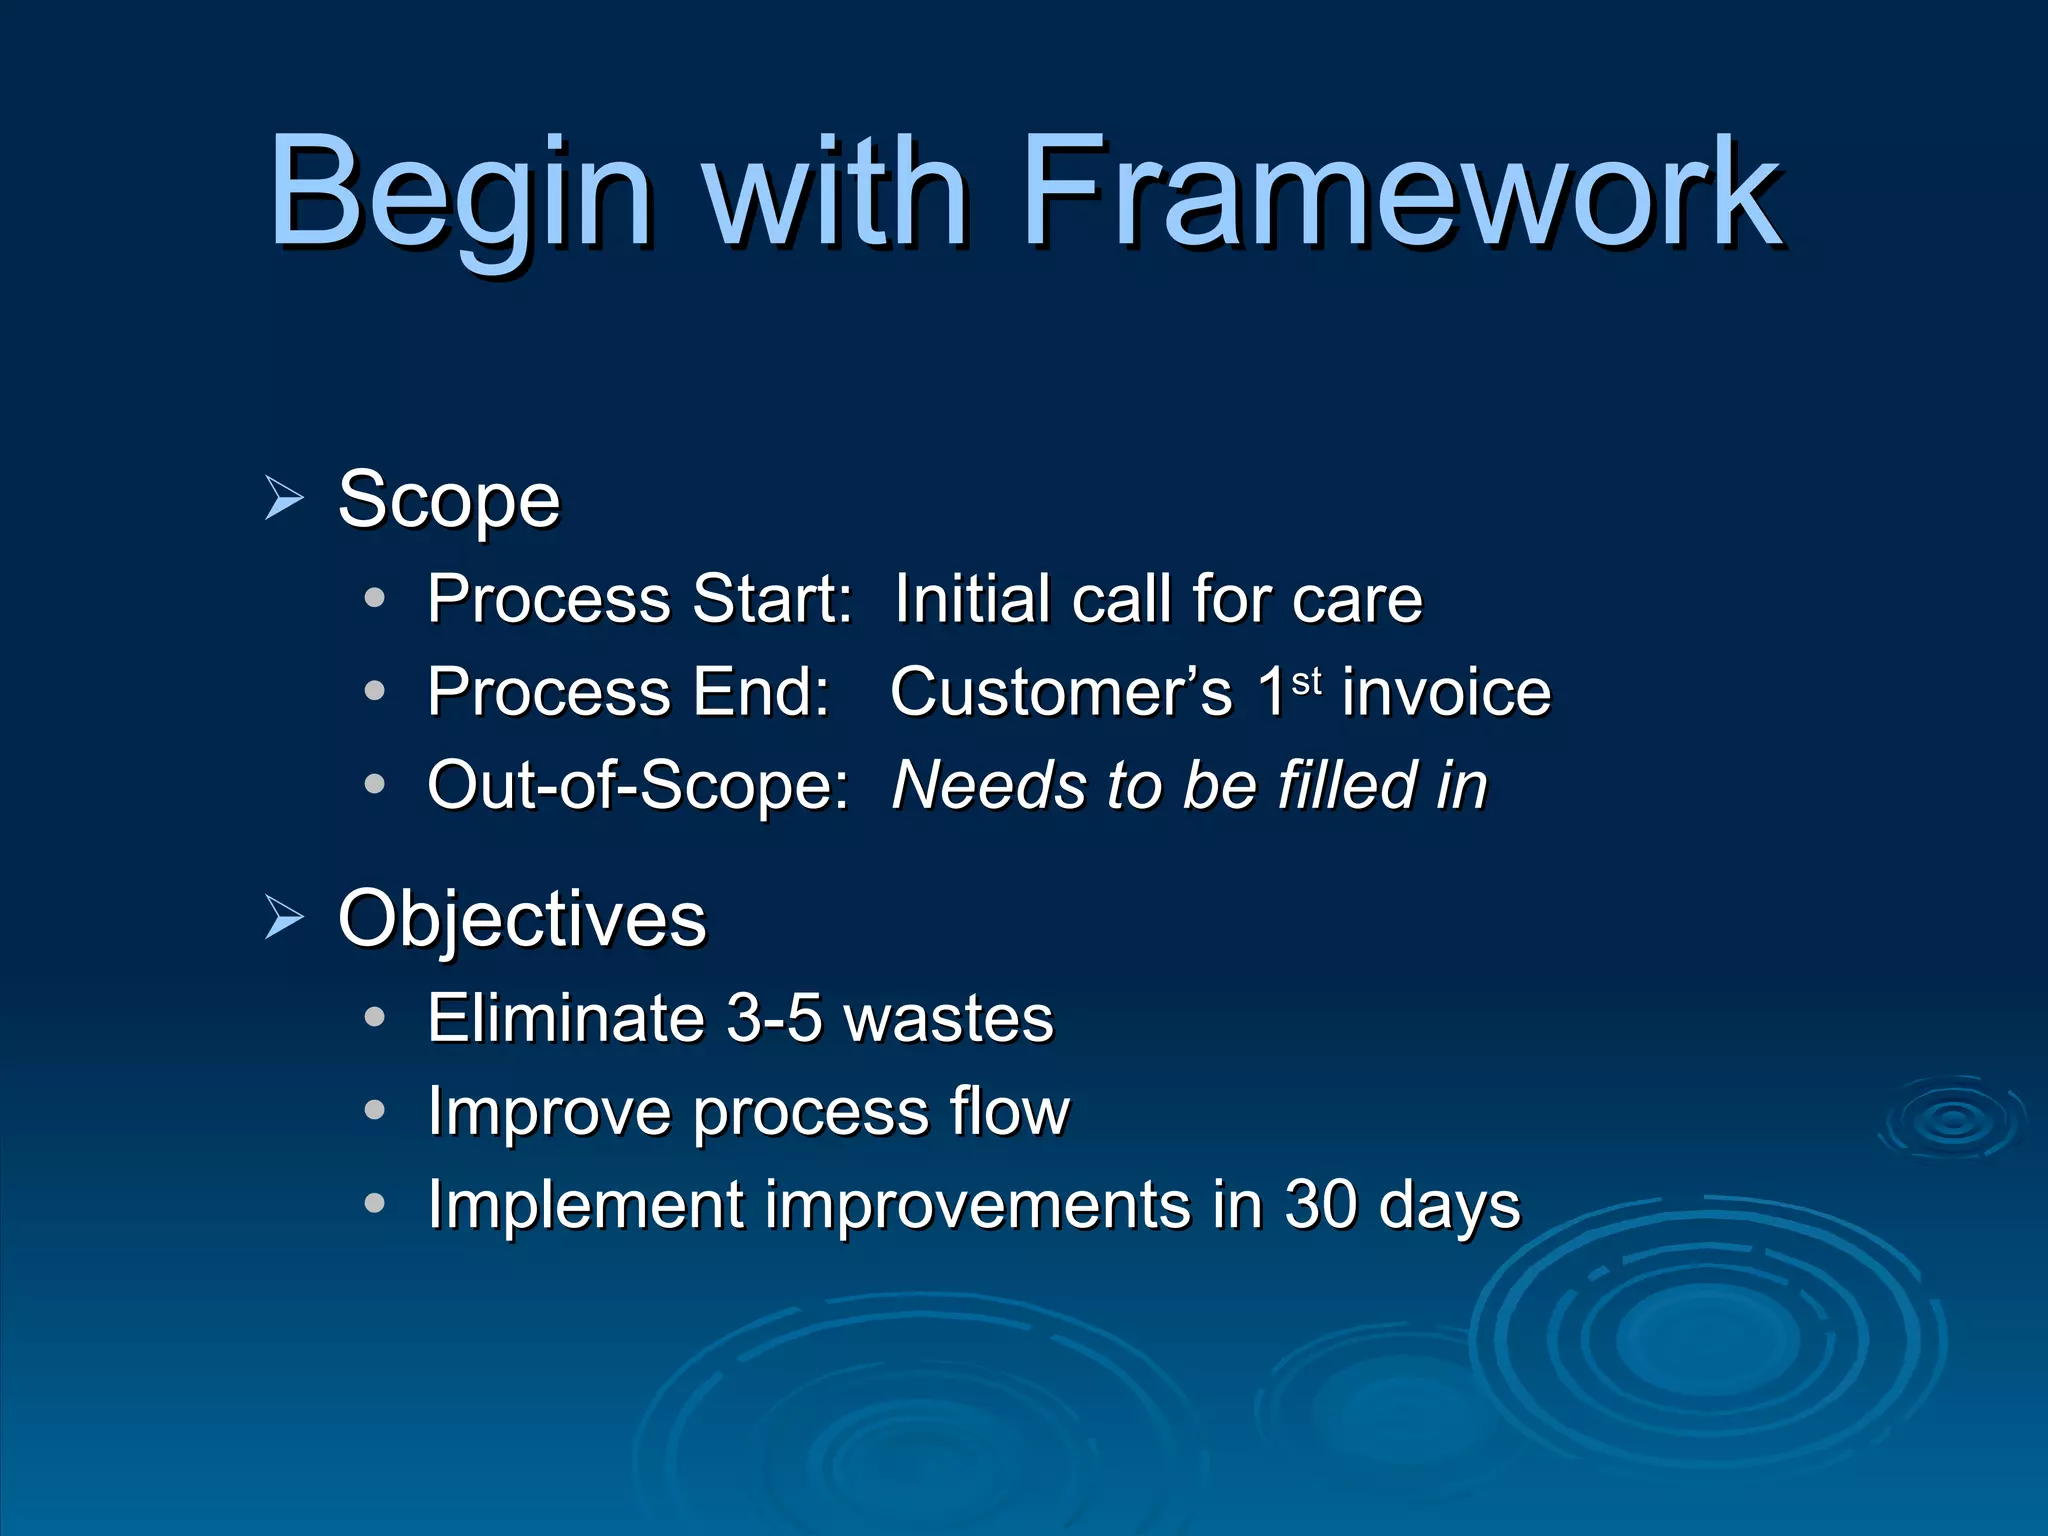
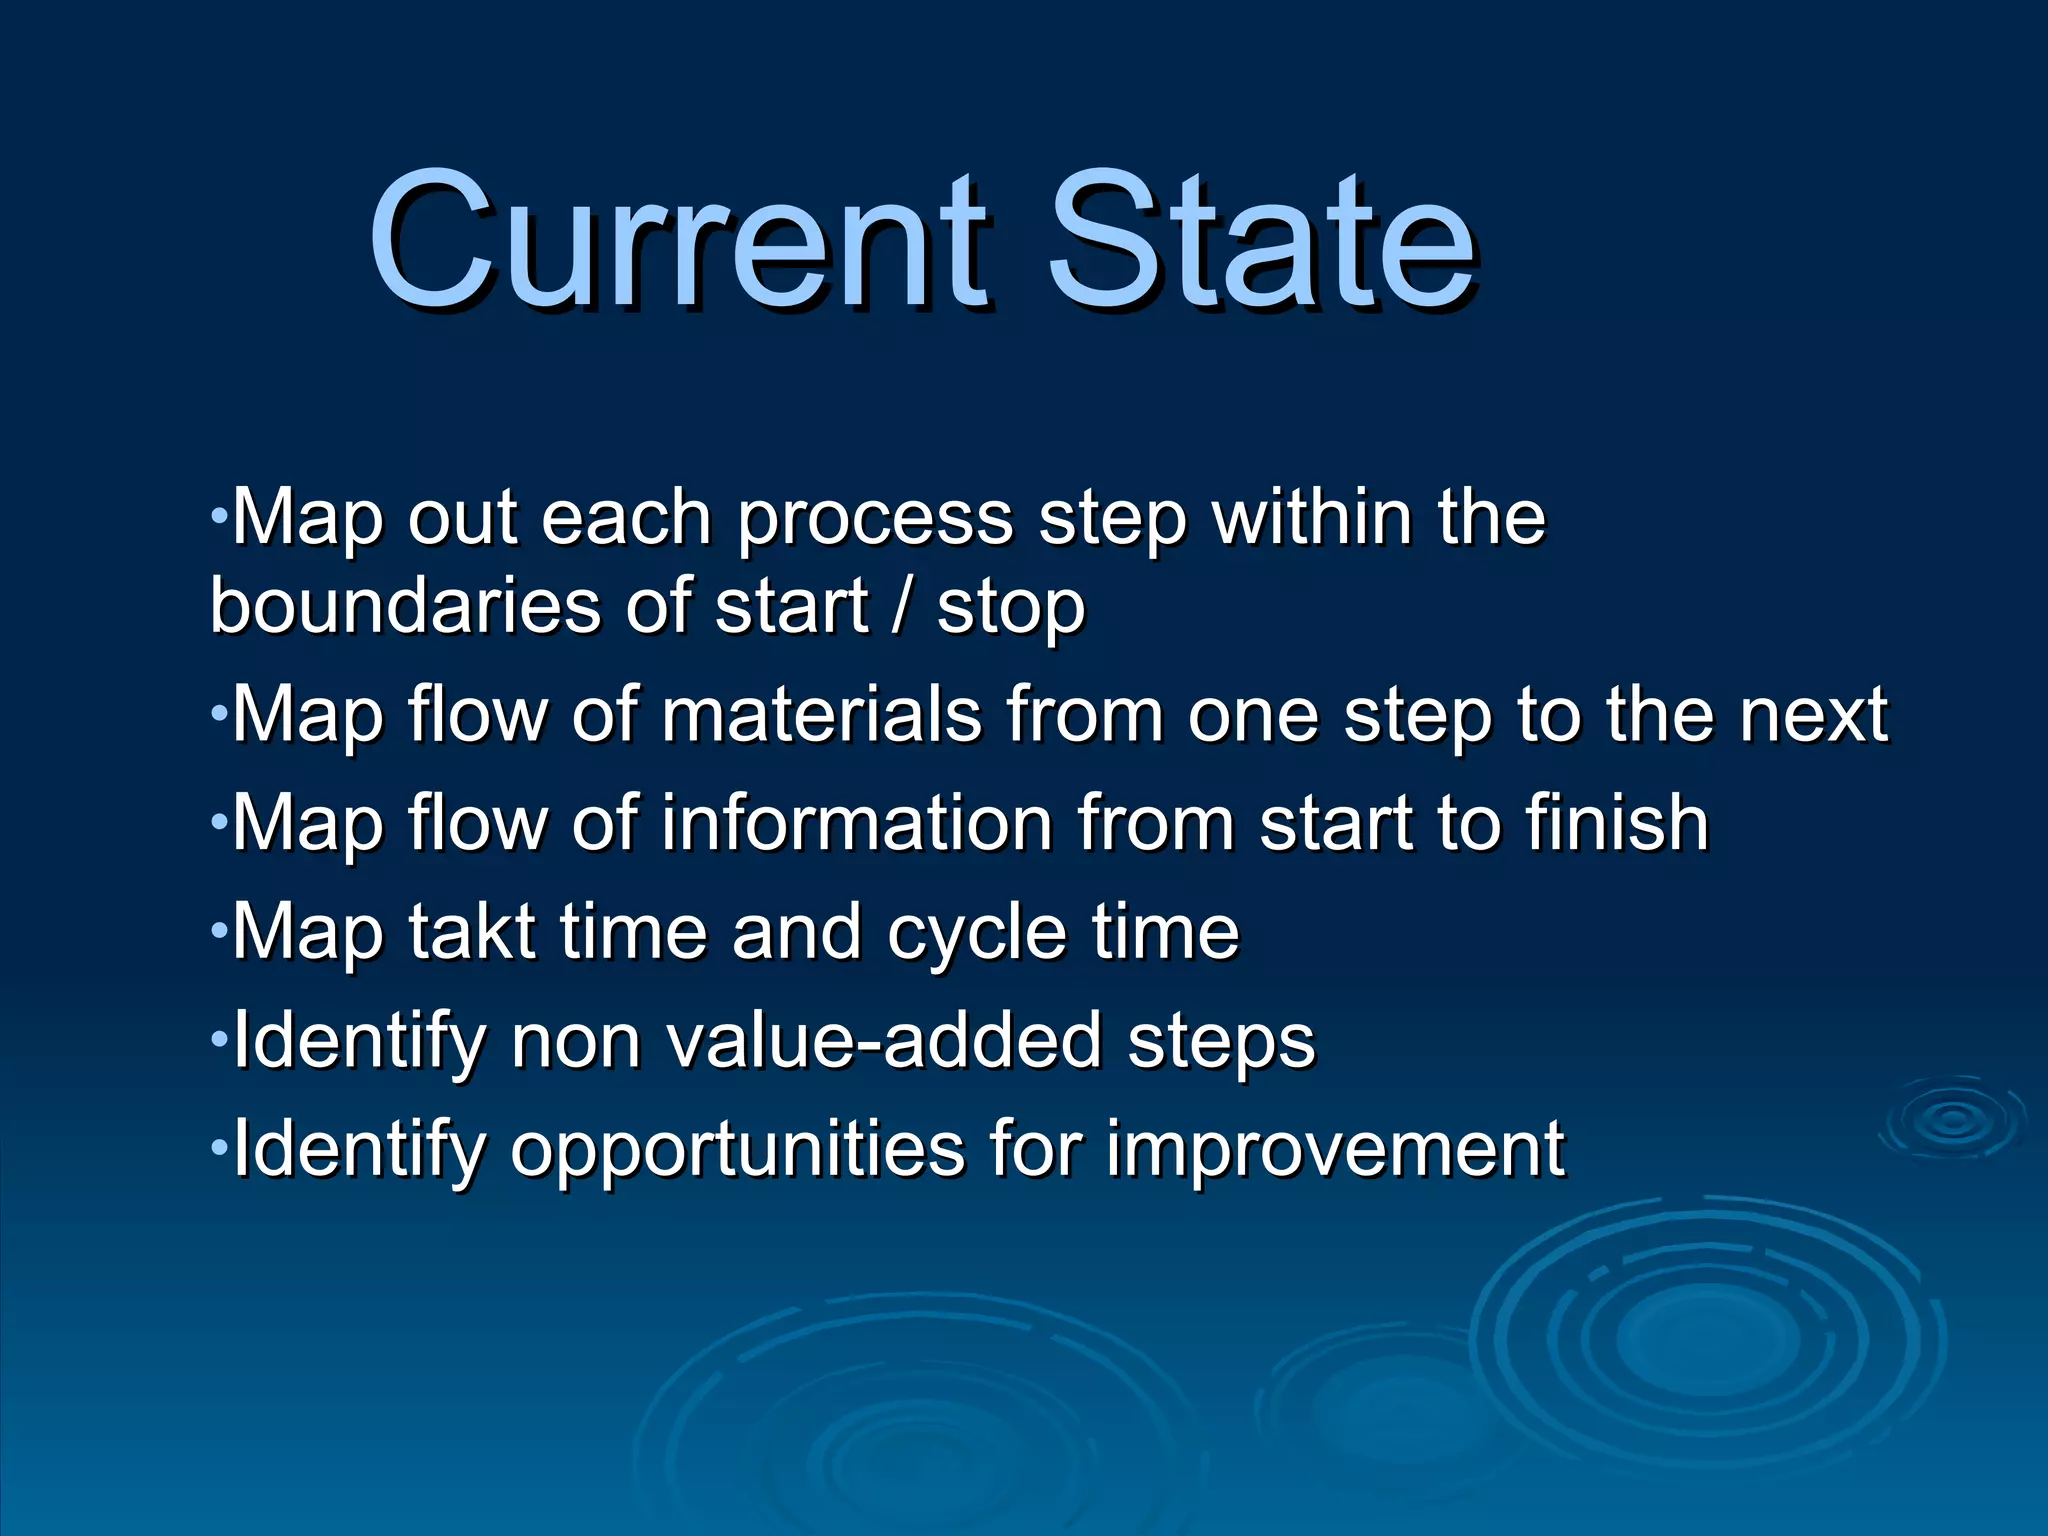
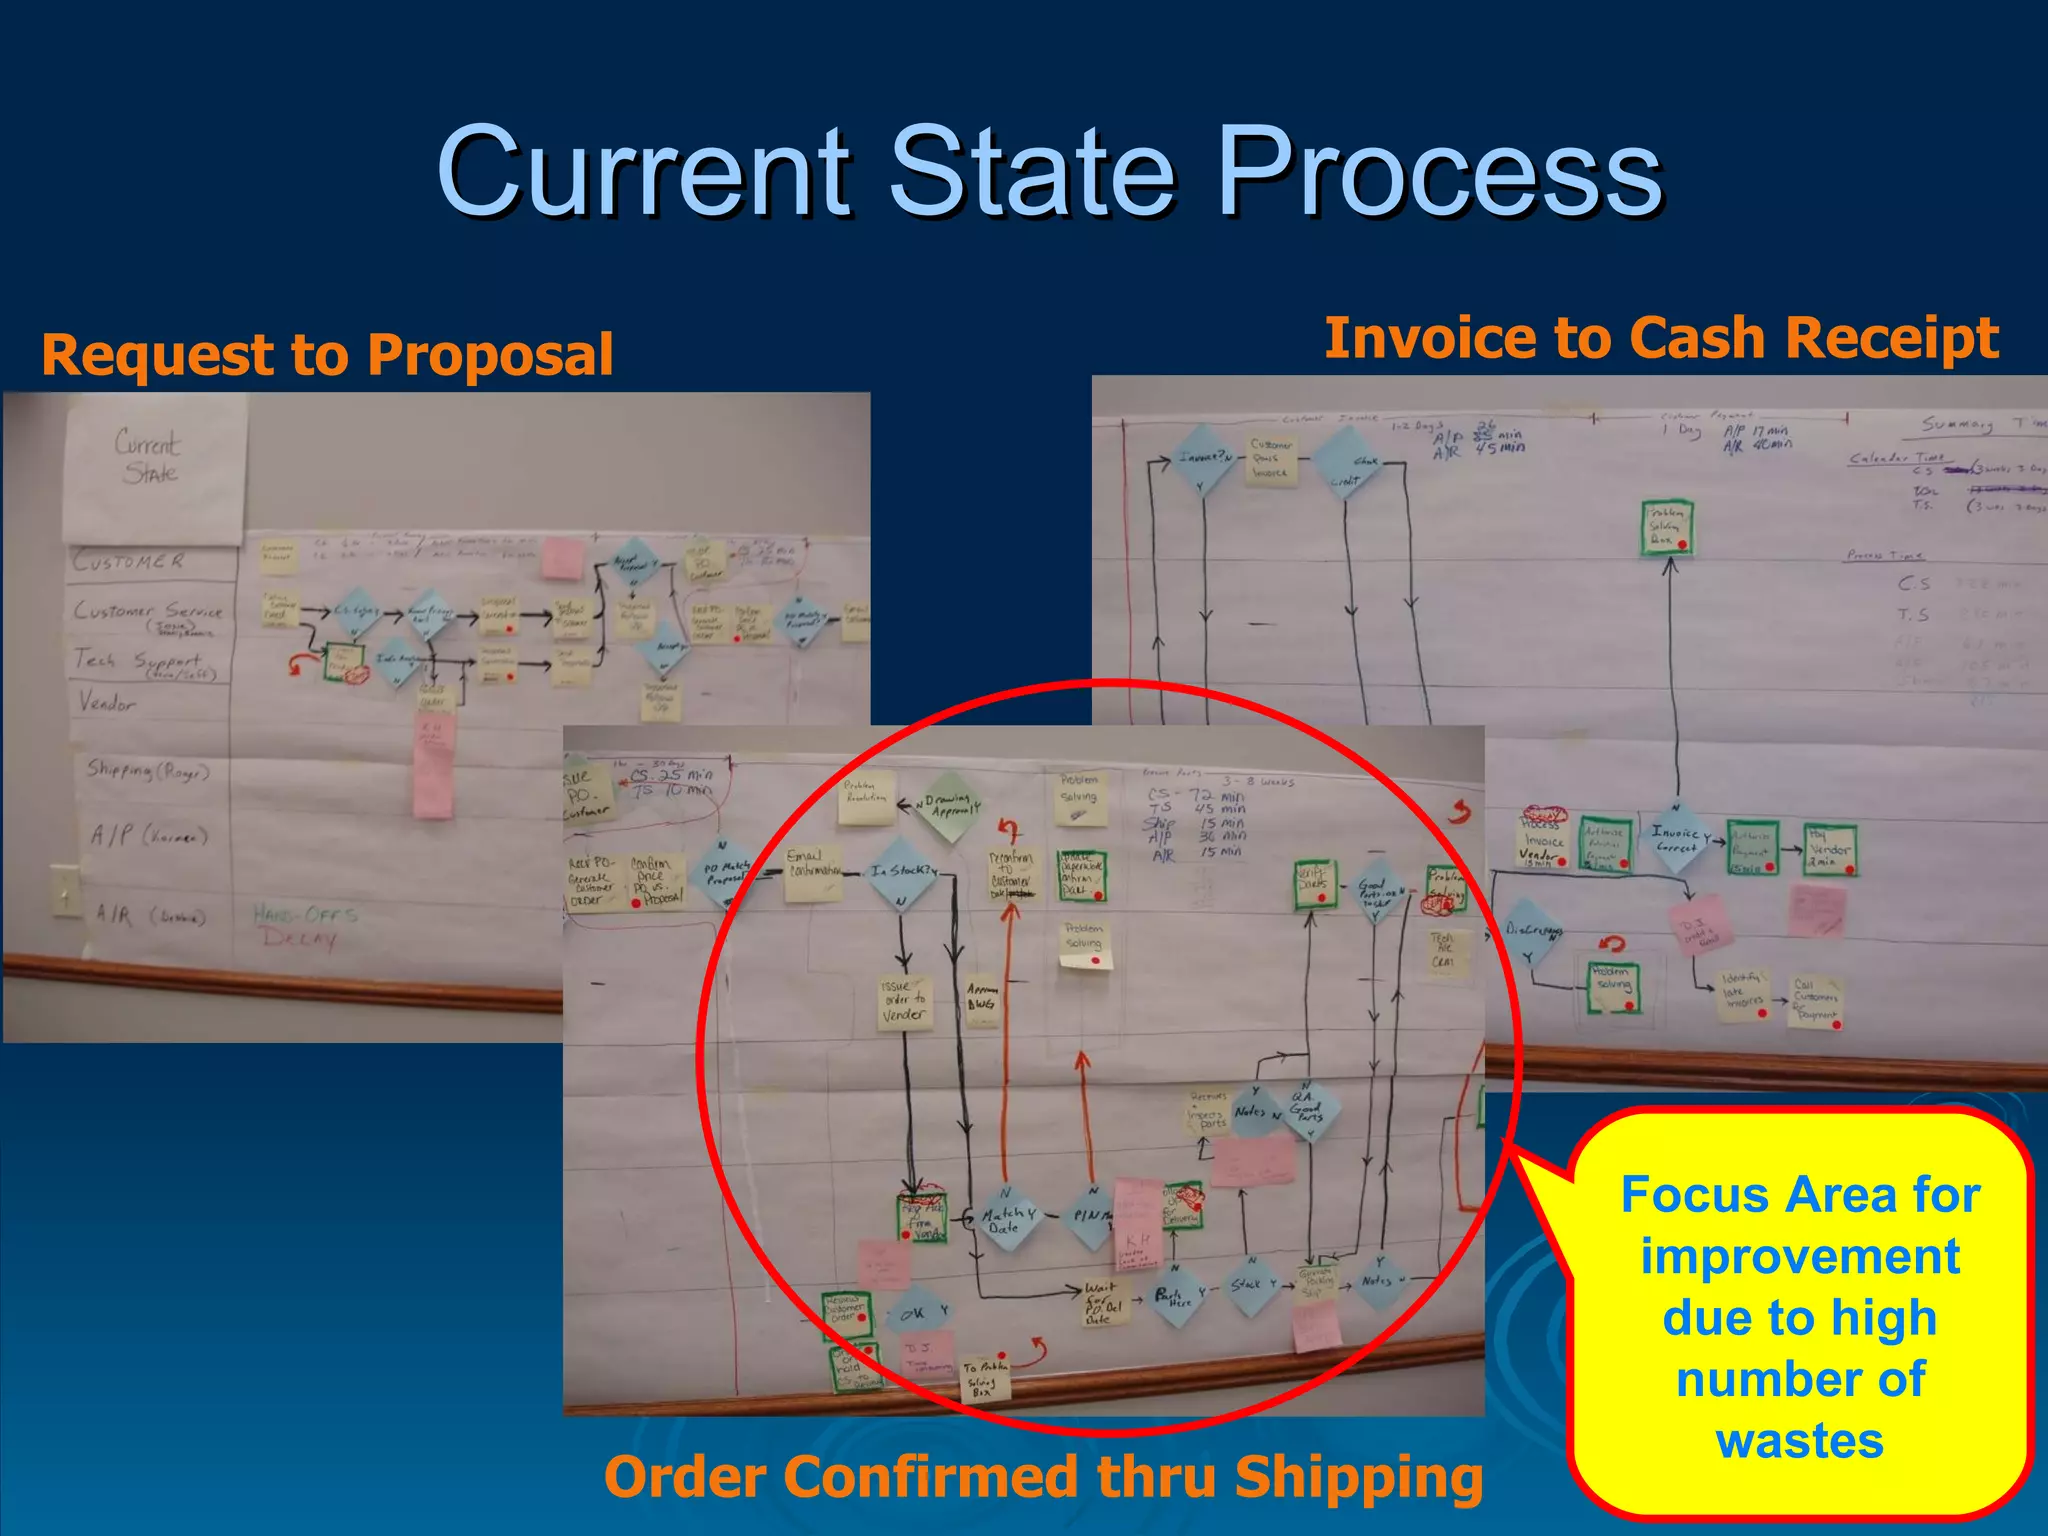
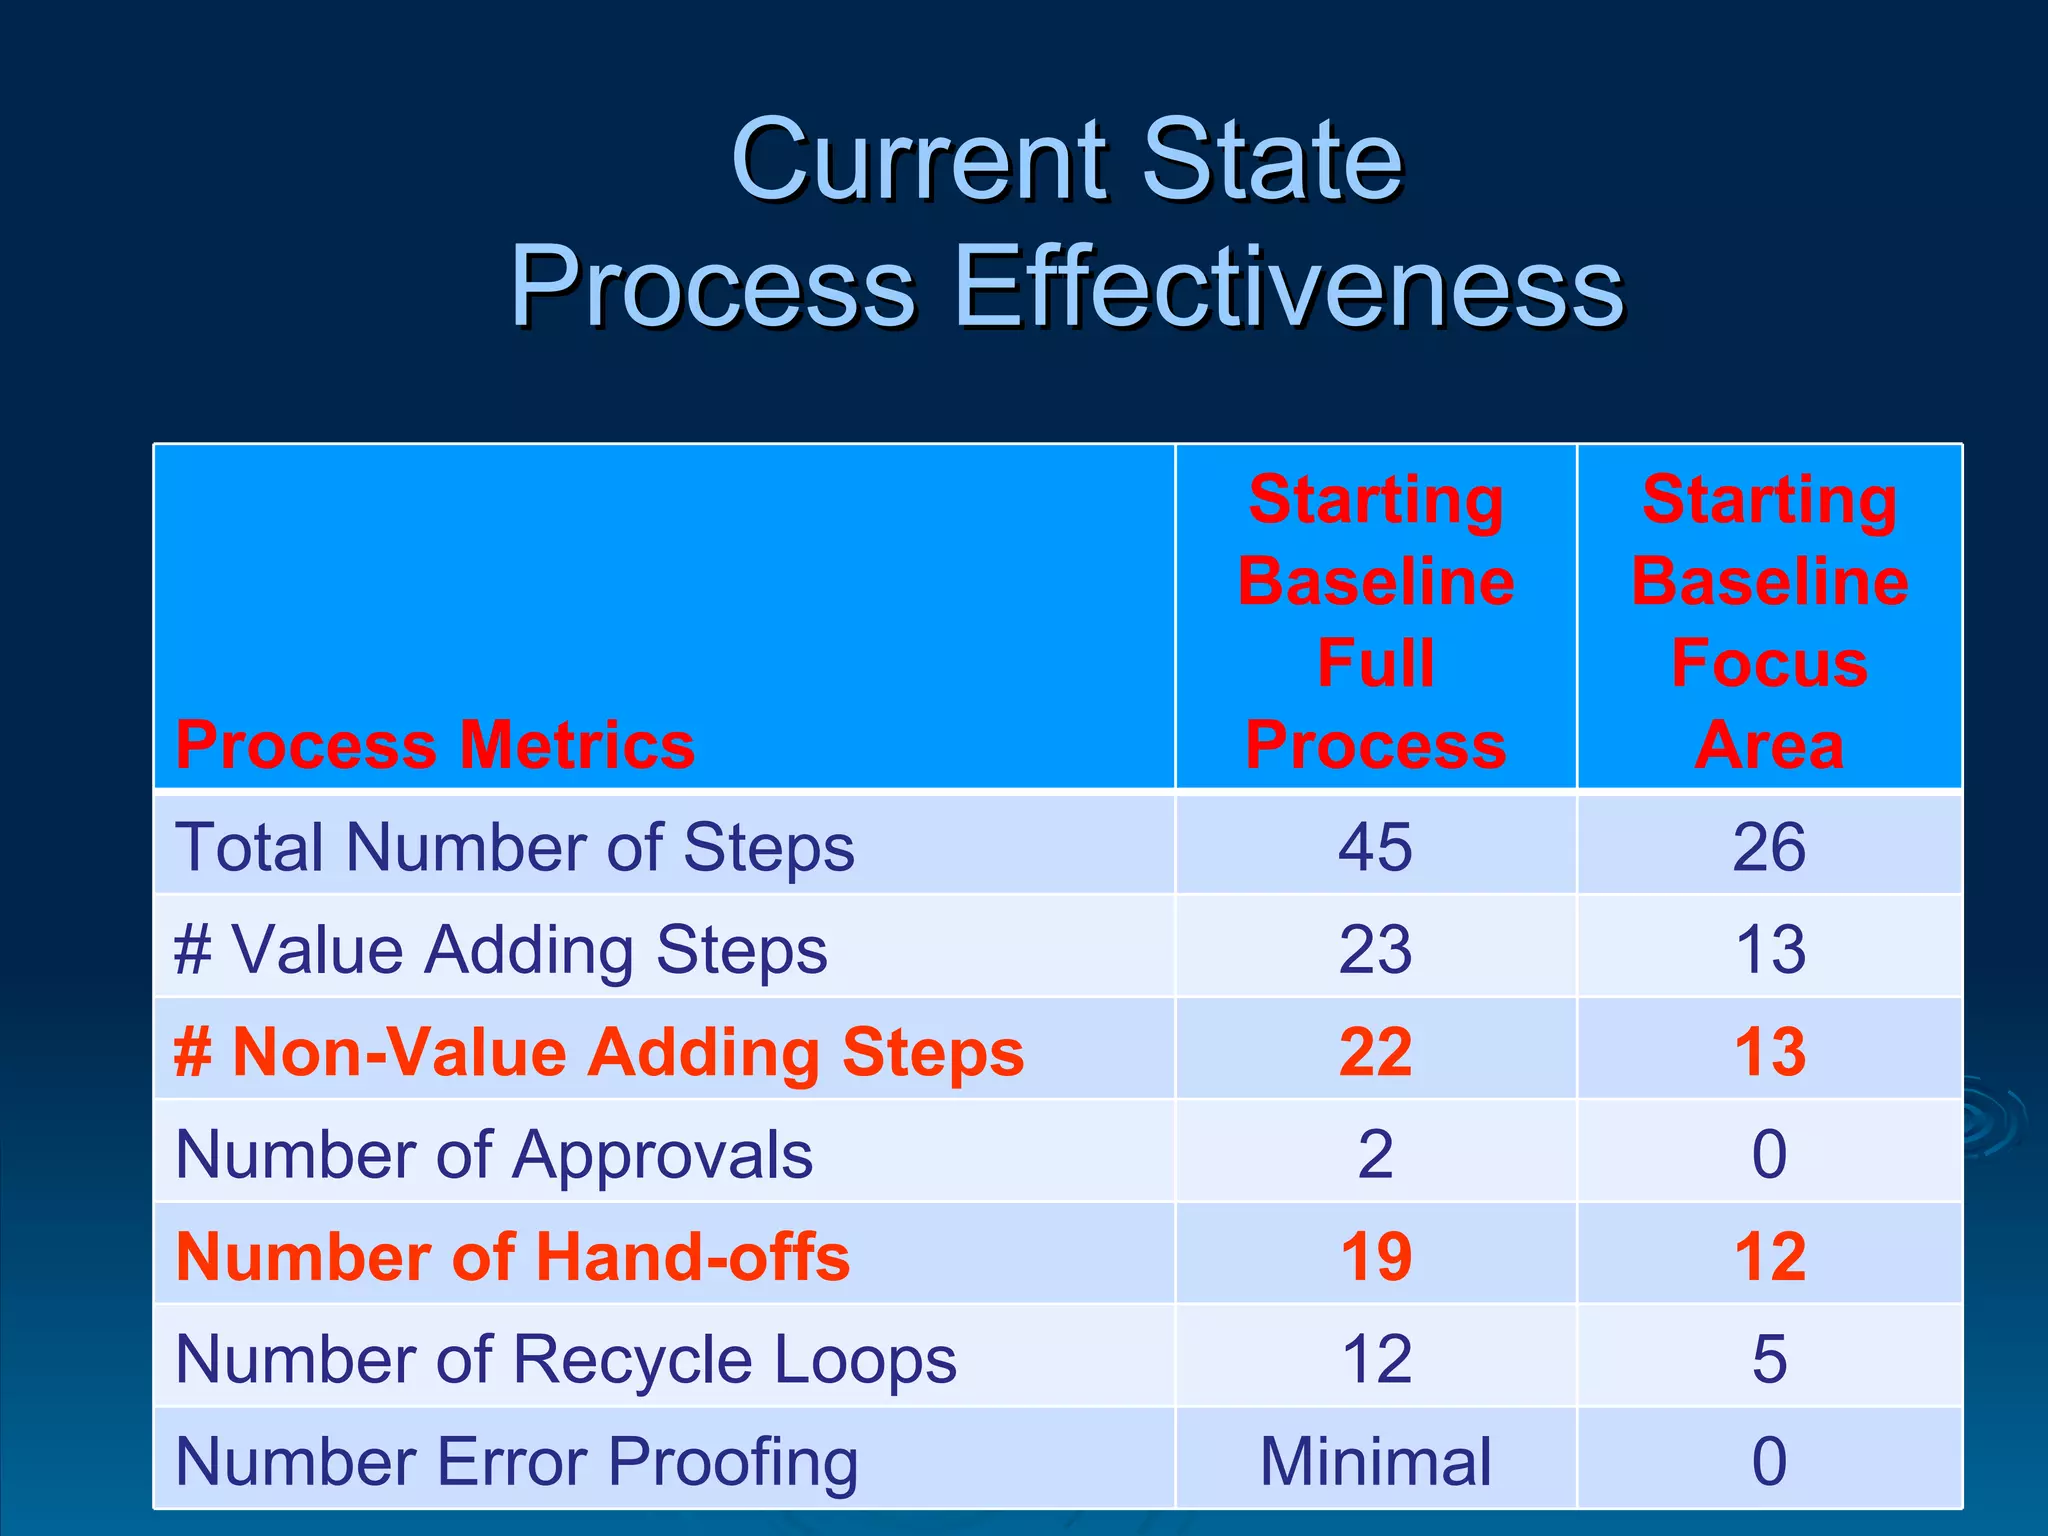
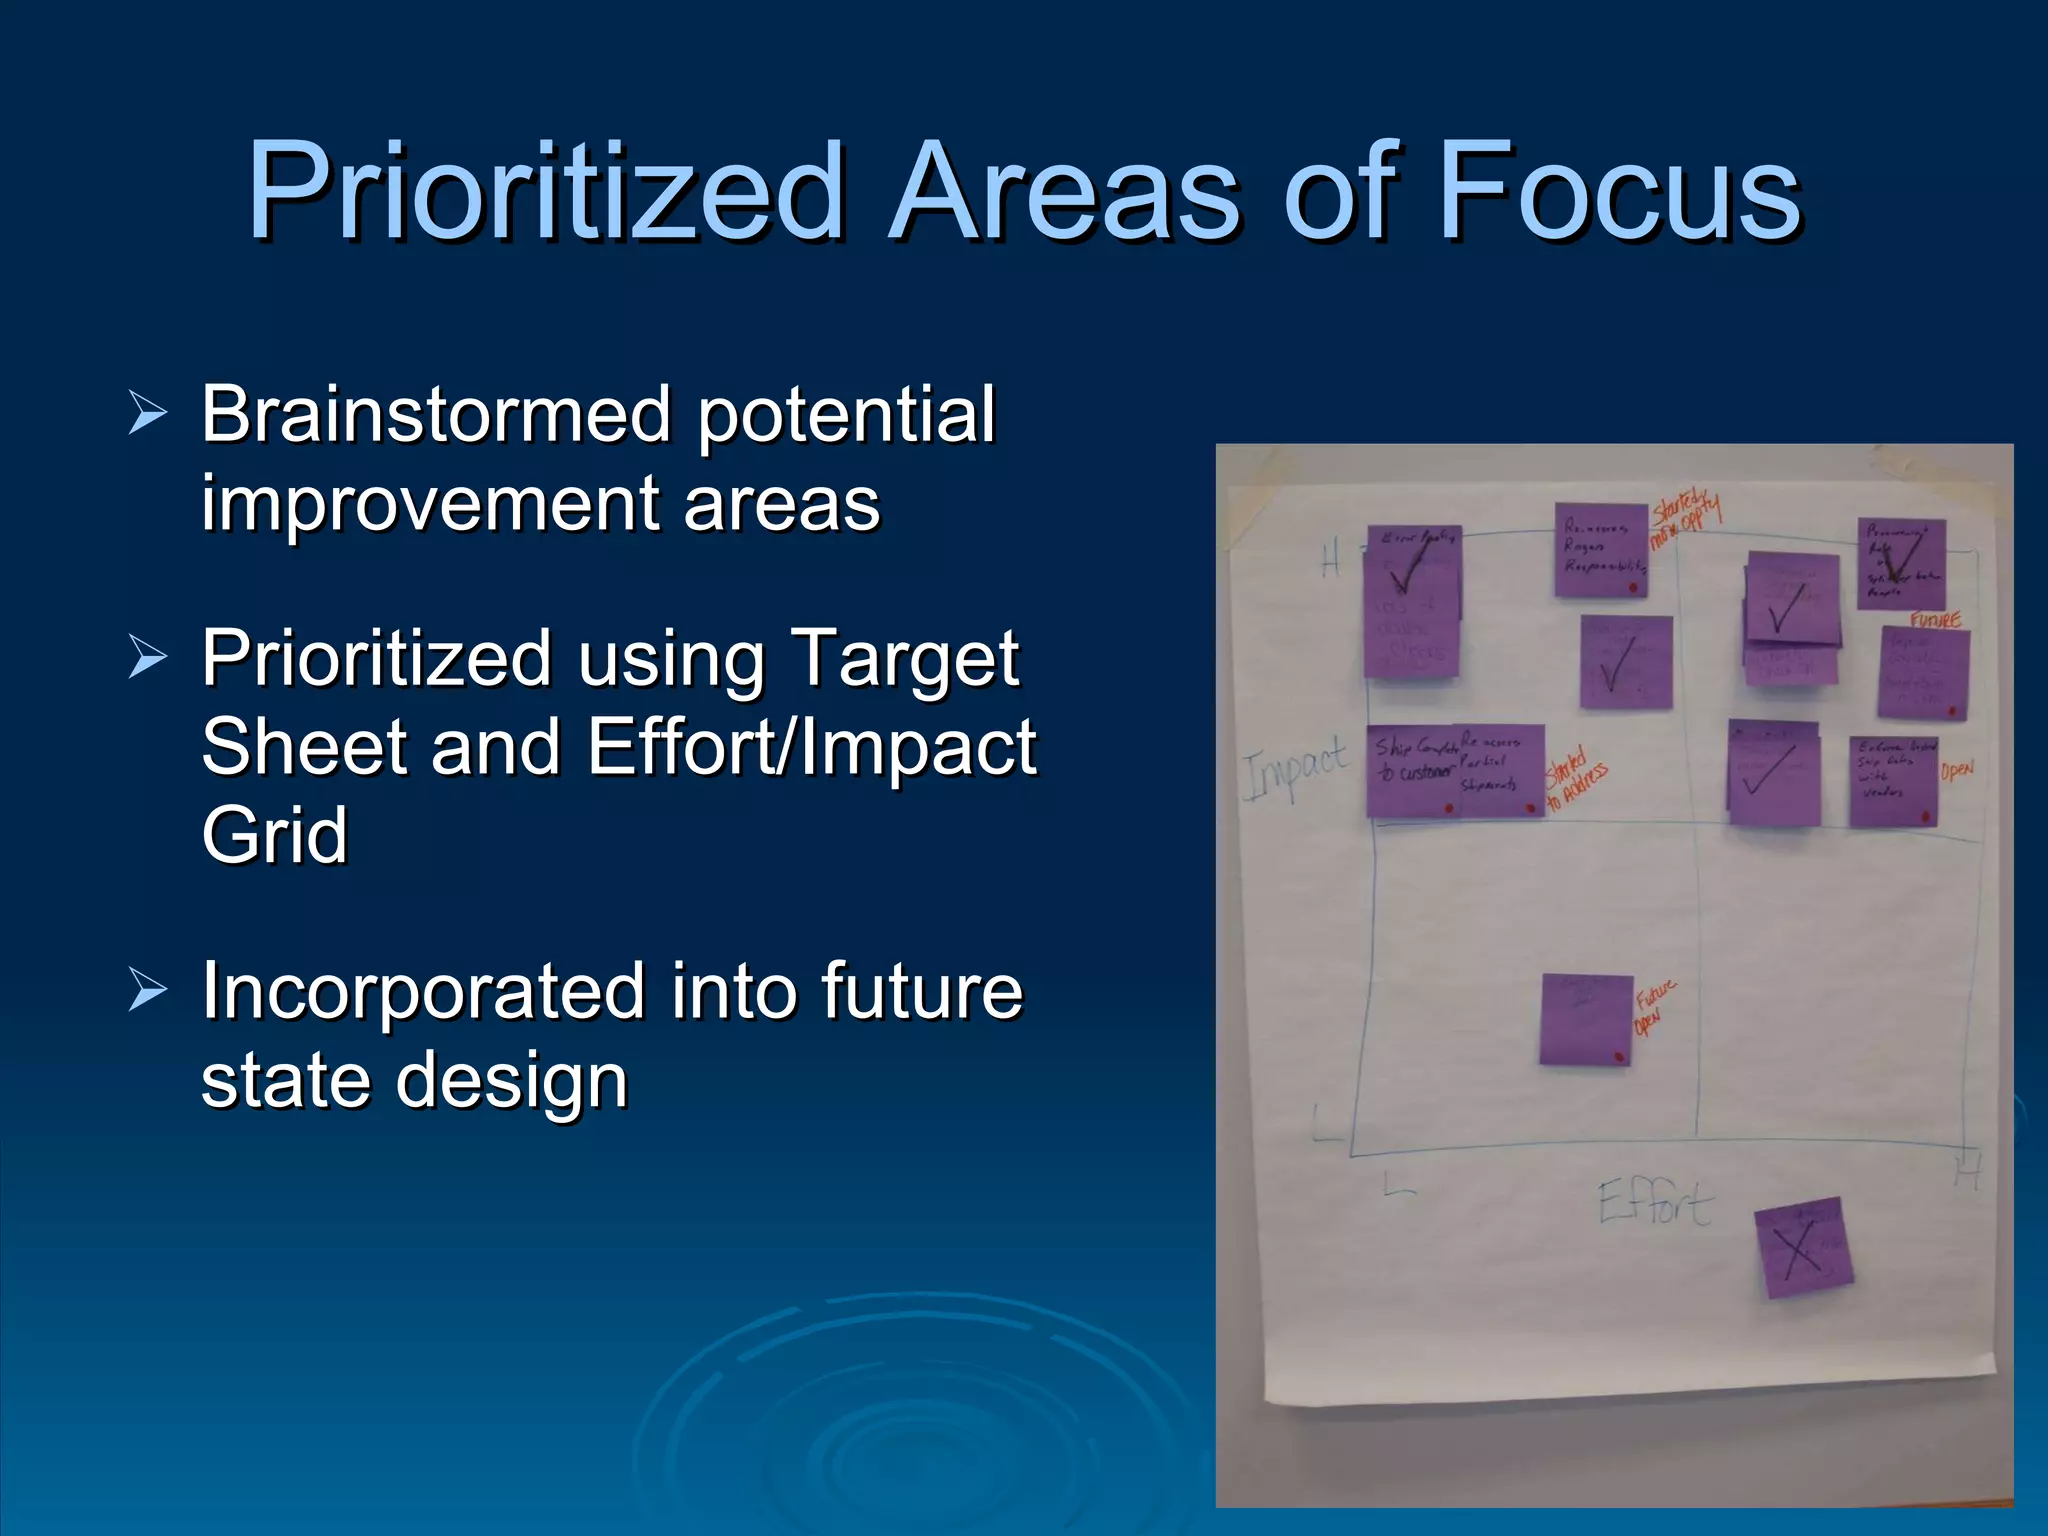
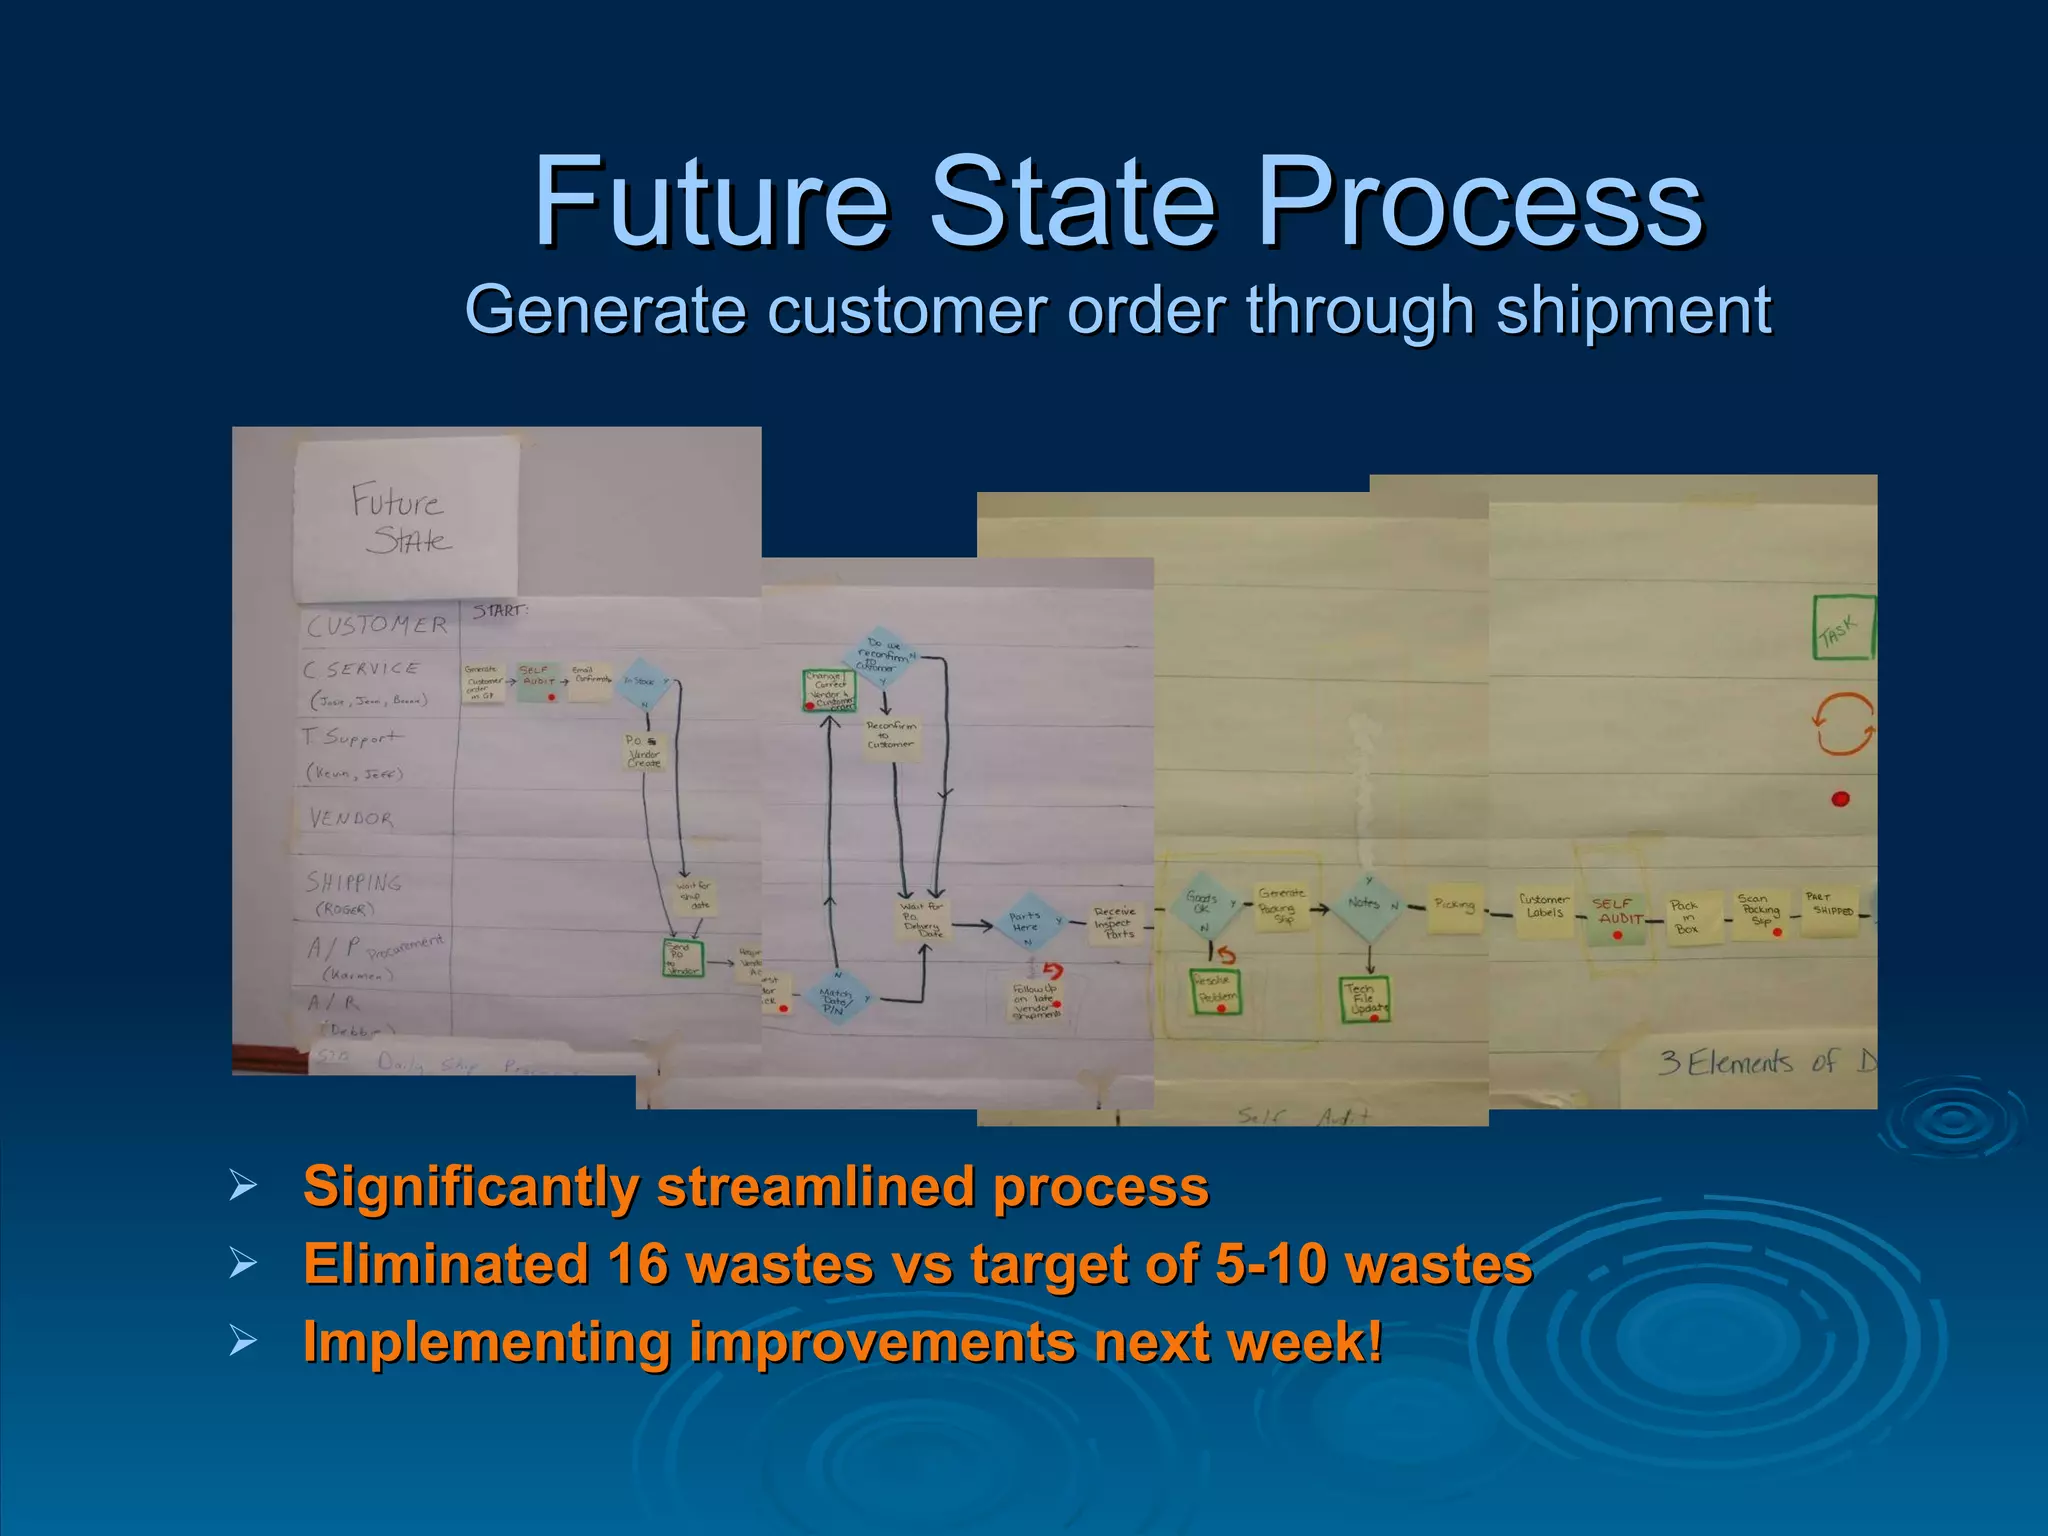
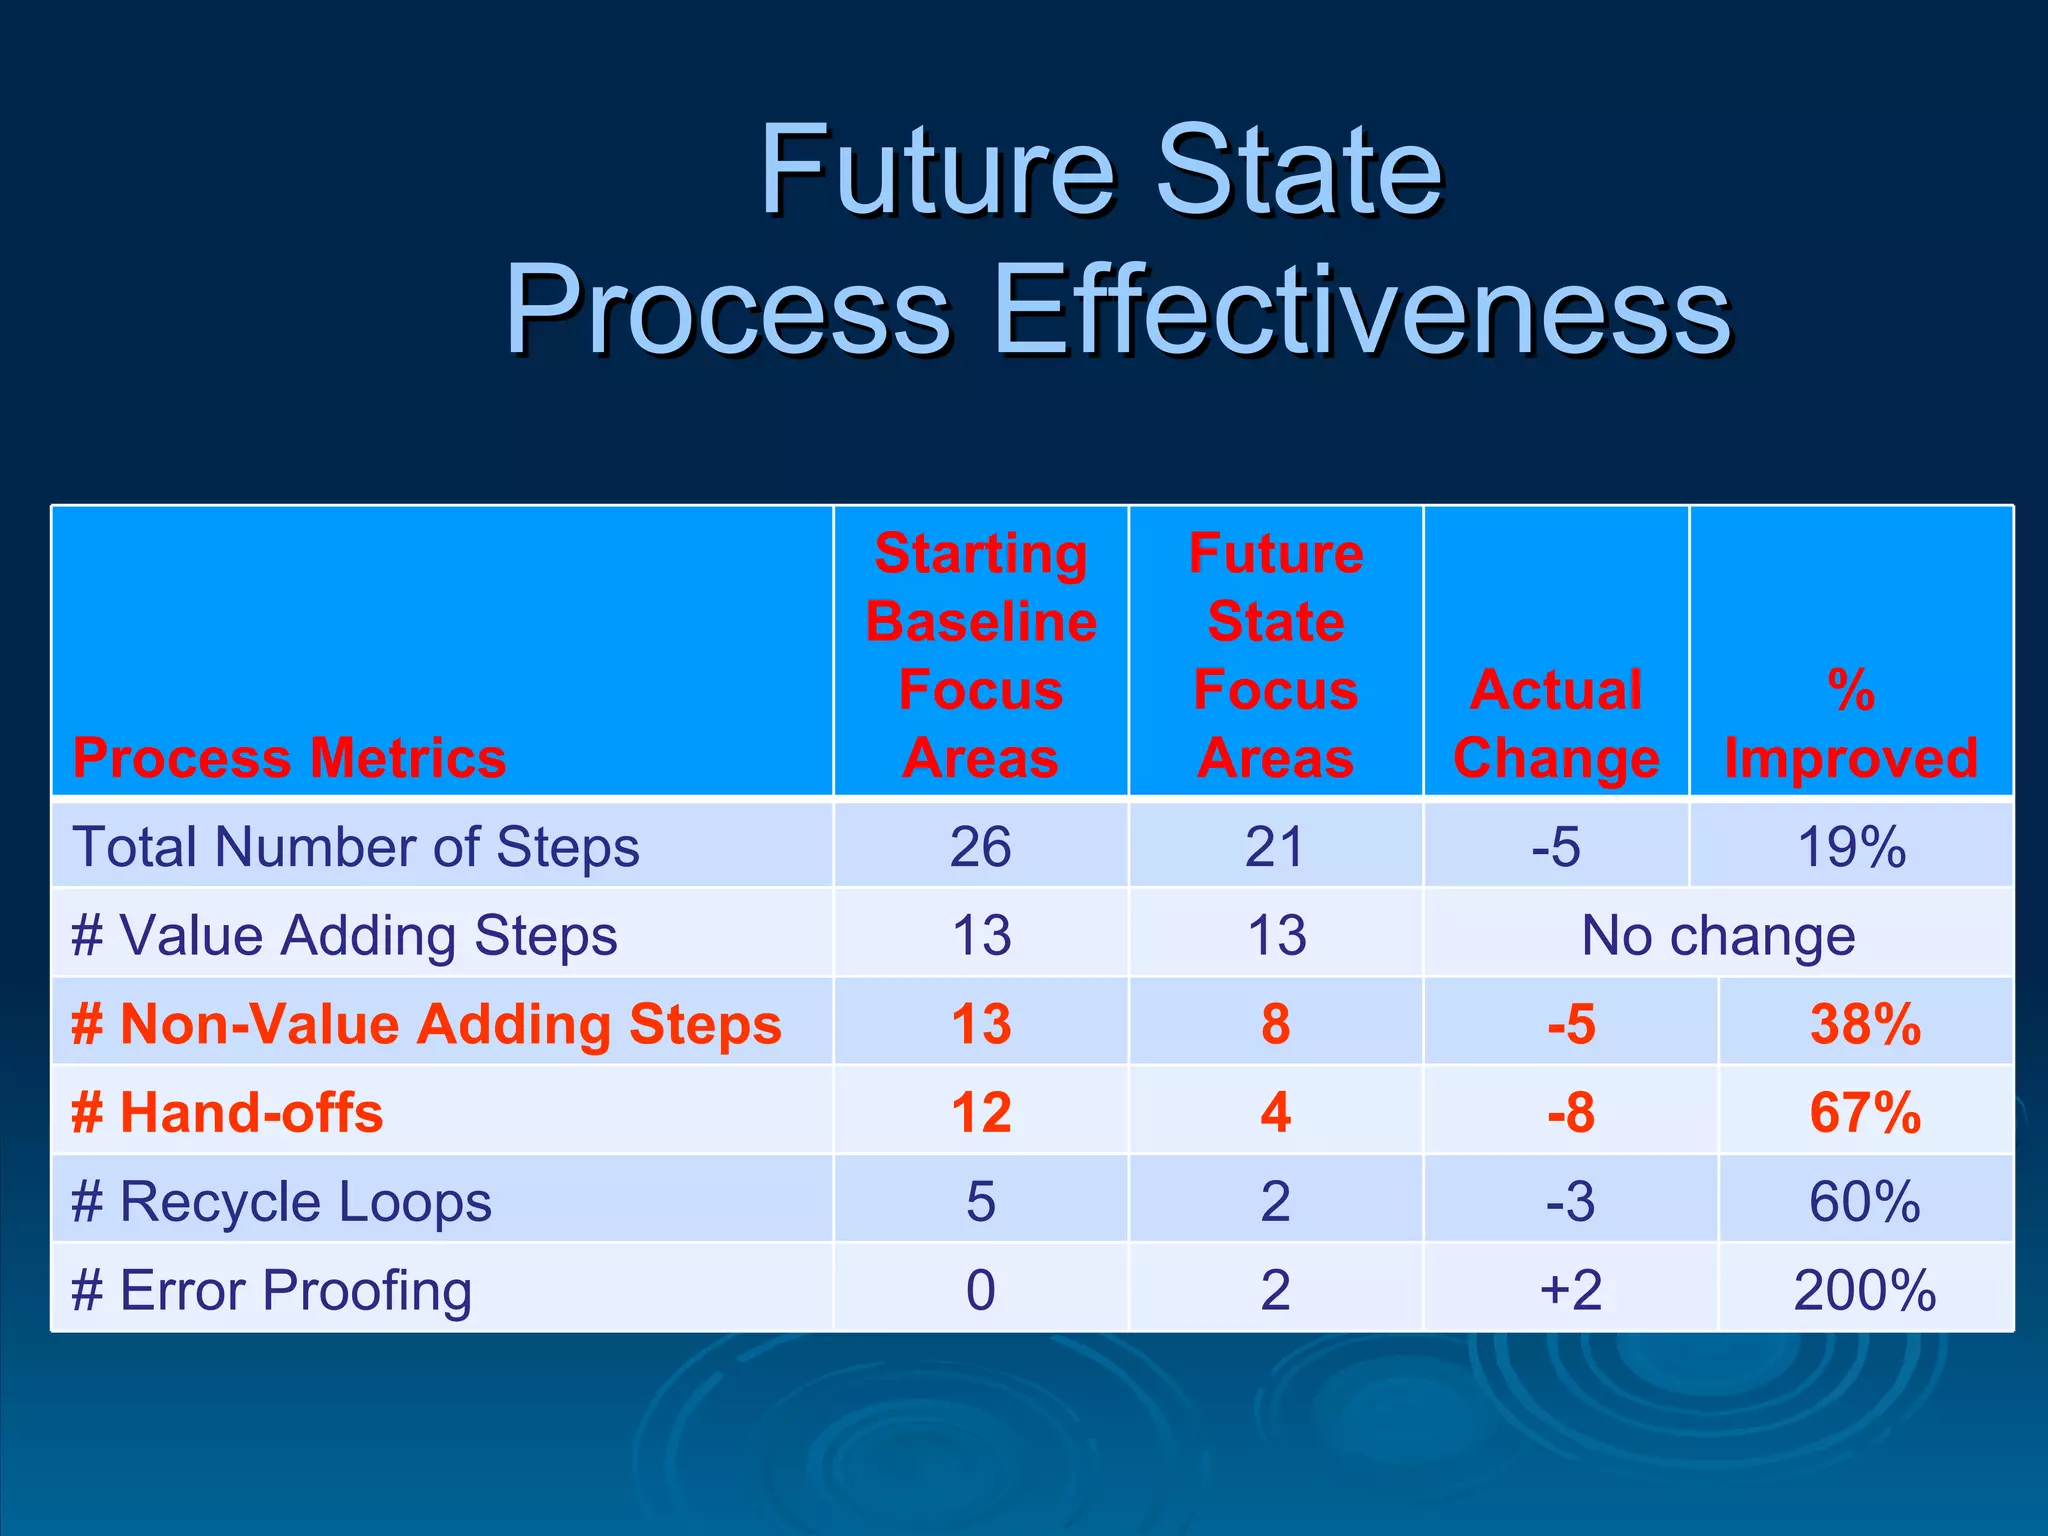
NEW Lean Consulting Group Value Stream Mapping Event Home Healthcare  Service Industry October 20-21, 2011
NEW Lean Consulting Group Provide Lean consulting services  To provide community businesses and not for profits with a quality resource for their Lean journey. Certified Lean Lead Facilitators Amy Lauko – Project Manager Jamie Voster Lisa Rothbauer Lisa Carpiaux Welcome & Introductions
The Case for Change EXPECTATIONS AND RESULTS Insanity is doing the same thing over and over again and expecting different results. Albert Einstein
Home Healthcare Industry Client Value Stream Mapping Agenda Lean education Customer satisfaction through waste elimination Value stream mapping Create current state map Create future state map Develop action plan
Event Summary Day One Call to action Lean education and agenda Understand current state  Build current state Prioritize improvement  areas Day Two Review wastes identified in current state Brainstorm on future Design future state process Define implementation plans  Develop action plan
Henry Ford: the first person to truly integrate an entire production process.  The problem with Ford’s system: the inability to provide variety. All Model Ts were essentially identical up through the end of production in 1926.  Based on Ford’s thinking, Mr. Toyoda and Mr. Ohno created the Toyota Production System (TPS). Toyota believed a series of simple innovations would make it more possible to provide both continuity in process flow and a wide variety in product. TPS shifted the manufacturing from individual machines to the flow of the product through-out the total process.  Taiichi Ohno History of LEAN
What is Lean? A work philosophy of  eliminating   waste  and increasing  value  of products and services
Elements of Lean Thinking Learning to see  Continuous Improvement  Standard work One piece flow Error proofing Focus on process not on people Employee Empowerment
LEAN Principles Setup Reductions Teams 5S Error Proofing TPM Kanban Work Cell Standardized Work Kaizen A3 Problem Solving Value Stream Map
Increased efficiencies Increased ability to serve more customers in the same time Increased customer satisfaction Increased timely customer access to goods and services Improved quality Increased employee engagement Reduced waste, costs, and lost opportunities Benefits of Lean
Lean is not…. a headcount reduction an evaluation of your personal performance for companies struggling to stay in business a quick one-time fix applicable only to manufacturing What is NOT Lean?
Lean requires change in Thought Culture  Perspective Change must occur to achieve success.  Lean Requires   Change
Why Change? We cannot solve our problems with the same thinking we used when we created them.  Albert Einstein
Critical success factors: Communication Leading Training Acting Sustaining Plan, Do, Check, Act (PDCA)  Implementing Change
If the solution is not obvious, hold events that enable small continuous improvements These are Kaizen or Rapid Improvement Events (RIEs) Kaizen events use problem solving tools to find solution.  Change in Lean is Focused on Problem Solving
What is Kaizen? Japanese for  improvement   or  change for the better .  It refers to a philosophy or practice that focuses upon continuous process improvement.
Business Process Kaizen Teams: Members are diverse Targets:  Waste, Variables, and non-value added activities Typically a 3 - 5 day commitment Quick and simple, not slow and elegant Management ensures the necessary resources  Immediate results
Standardize IMPROVEMENT TIME Kaizen Kaizen Kaizen From “Kaizen”, Masaaki Imai Standardize Standardize Kaizen Starting Process
“ The achievements of an organization are the results of the combined effort of each individual.” Coach Vince Lombardi
Why do we need Teams? By working together, rather than competing with each other, we’ll see:  Increased quality Higher productivity Reduced cost
Teams Add Value What’s in it for Me? New job skills Participate in decisions affecting your job Realize you add value to the company
Team Building Building Your Team: Establish Team Guidelines Define Team Mission and Goals Conduct Effective Meetings Identify Team Roles and Responsibilities Develop Communication     Speaking and Listening Resolve Conflicts Make Group Decisions
Teamwork Fundamentals Open communication Team members with diverse backgrounds Common goals Driven to succeed
A team is a group of people working together towards a common goal.
The focus of Lean is … waste elimination.  Waste
Anything other than the  minimum resources  required to  add value  to an end product or service. What is Waste?
Waste Non-value added work, also called waste, refers to work that doesn't add value to or is unnecessary for the overall project.
Non-Value Add Activities Improve Evaluate Reduce Eliminate Value Add Transforms material and information into products or services The customer wants it It’s done right the first time Non-Value Add Consumes resources but does not contribute to the product or service Necessary Customers require it Regulatory or legal compliance Can’t eliminate based on current technology or thinking Not Necessary
Waste Wheel 1 2 3 4 5 6 7 8 Value Added Work 5 % Over  Production Inventory Transportation Knowledge Corrections Over Processing
“ Eliminating…waste is not the problem, identifying it is.” Taiichi Ohno developer of the  Toyota Production System (TPS) The Real Problem:
Examples of Waste in the Office Motion Going to copy machine or fax, searching for files, extra key strokes, hand-offs, going to get signatures. Waiting (Idle Time) Waiting for system to come up, customer or supplier responses, handed-off file to come back, decisions. Transportation Retrieving/storing files, carrying or posting paperwork, loops. Defects Data entry error, missing information, re-work. Over-Processing Repeated entry of data, “Cadillac” report when something less  would do, unneeded steps, duplication, layers of approval. Over-Production Doing more than is needed, doing things too far ahead of customer need, creating reports that no one reads, making extra copies “just in case”. Inventory Open projects, unread e-mails, office supplies, unused records in database, items waiting for attention. Misused Resources Not engaging everyone in improvement, not utilizing all skills available in the organization, unclear roles and responsibilities.
Learning to see waste..… If we hadn’t challenged the status quo, we wouldn’t have: microwaves, cell phones, Ipads, portable air conditioners, makes/model of cars, laptops.
A one page visual representation showing the flow of all processes, information and material  Current state analysis (snap shot) shows  All current value added and non-value added processes  Future state analysis shows  Improved value added processes and eliminates as much non-value added work as possible Action plan for target state implementation  Introduction to Value Stream  Mapping (VSM)
Benefits of a VSM See entire process flow of information and materials Identify waste and the source of waste Establish priorities for improvement Focus on low cost or no cost improvements Reveals opportunities to improve customer satisfaction
Establish the areas of focus Determine Book Ends (Start/Stop points) Identify steps by color:   Yellow Process Sheets– tasks   Pink Post-It Notes– problems/opportunities   Green/Red Dots – (Non) Value-Added activities Brainstorm/Creative Problem Solving as needed Map future state / Create Parking Lot Prioritize changes  Create Action Plan  How to do a VSM
Begin with Framework Scope Process Start:  Initial call for care Process End:  Customer’s 1 st  invoice Out-of-Scope:  Needs to be filled in Objectives Eliminate 3-5 wastes Improve process flow Implement improvements in 30 days
Current State Map out each process step within the boundaries of start / stop Map flow of materials from one step to the next Map flow of information from start to finish Map takt time and cycle time Identify non value-added steps Identify opportunities for improvement
Current State Process Request to Proposal Invoice to Cash Receipt Order Confirmed thru Shipping Focus Area for improvement due to high number of wastes
Current State Process Effectiveness November 4, 2011 Process Metrics Starting Baseline Full Process Starting Baseline Focus Area Total Number of Steps 45 26 # Value Adding Steps 23 13 # Non-Value Adding Steps 22 13 Number of Approvals 2 0 Number of Hand-offs 19 12 Number of Recycle Loops 12 5 Number Error Proofing Minimal 0
Prioritized Areas of Focus Brainstormed potential improvement areas Prioritized using Target Sheet and Effort/Impact Grid Incorporated into future state design
Creating the Future State Brainstorm opportunities for potential improvements Focus on (8 Wastes) low cost and  no cost improvements Verify management support  Verify Future State meets the established goals. Develop action plan for implementation within 30 -60 days
Future State Process Generate customer order through shipment Significantly streamlined process Eliminated 16 wastes vs target of 5-10 wastes Implementing improvements next week!
Future State  Process Effectiveness Process Metrics Starting Baseline Focus Areas Future State Focus Areas Actual Change % Improved Total Number of Steps 26 21 -5 19% # Value Adding Steps 13 13 No change # Non-Value Adding Steps 13 8 -5 38% # Hand-offs 12 4 -8 67% # Recycle Loops 5 2 -3 60% # Error Proofing 0 2 +2 200%
Develop Action Plan Create teams to work on tasks  Ensure the right members are on the team  Ensure teams have support and resources they need Review progress regularly Celebrate successes
Ensure Success of Action Plan IMPORTANT TASKS: Conduct regular scheduled meetings for  participants. Inform everyone of the plan  Inform everyone of what was learned in the process Provide a structure to work on problem solving and to complete tasks Verify progress on goals continuously Give support for the process continuously. Celebrate the success of the team.
Plan Do Check Act Act - How to improve next time  Plan -  What to do. How to do it. Do - What was planned. Check - Did things happen as planned?
Keys to Success Teamwork   Combat Waste 100% Quality, No Comebacks
By the end of event  you will … Create Current State Map Understand Current State problems and opportunities. Create a Future State Map Have a plan for implementing future state  Have started developing standard work and visual controls to sustain changes.  Celebrate your success!
Basic Ground Rules   Maintain a positive attitude Make no assumptions Take nothing personally Everyone on the team is equal Each person’s opinion matters There are no bad ideas or stupid questions Resolve all issues respectfully
Together we can do what one cannot do alone!

Medical Services Client Vsm 10 10 11

  • 1.
    NEW Lean ConsultingGroup Value Stream Mapping Event Home Healthcare Service Industry October 20-21, 2011
  • 2.
    NEW Lean ConsultingGroup Provide Lean consulting services To provide community businesses and not for profits with a quality resource for their Lean journey. Certified Lean Lead Facilitators Amy Lauko – Project Manager Jamie Voster Lisa Rothbauer Lisa Carpiaux Welcome & Introductions
  • 3.
    The Case forChange EXPECTATIONS AND RESULTS Insanity is doing the same thing over and over again and expecting different results. Albert Einstein
  • 4.
    Home Healthcare IndustryClient Value Stream Mapping Agenda Lean education Customer satisfaction through waste elimination Value stream mapping Create current state map Create future state map Develop action plan
  • 5.
    Event Summary DayOne Call to action Lean education and agenda Understand current state Build current state Prioritize improvement areas Day Two Review wastes identified in current state Brainstorm on future Design future state process Define implementation plans Develop action plan
  • 6.
    Henry Ford: thefirst person to truly integrate an entire production process. The problem with Ford’s system: the inability to provide variety. All Model Ts were essentially identical up through the end of production in 1926. Based on Ford’s thinking, Mr. Toyoda and Mr. Ohno created the Toyota Production System (TPS). Toyota believed a series of simple innovations would make it more possible to provide both continuity in process flow and a wide variety in product. TPS shifted the manufacturing from individual machines to the flow of the product through-out the total process. Taiichi Ohno History of LEAN
  • 7.
    What is Lean?A work philosophy of eliminating waste and increasing value of products and services
  • 8.
    Elements of LeanThinking Learning to see Continuous Improvement Standard work One piece flow Error proofing Focus on process not on people Employee Empowerment
  • 9.
    LEAN Principles SetupReductions Teams 5S Error Proofing TPM Kanban Work Cell Standardized Work Kaizen A3 Problem Solving Value Stream Map
  • 10.
    Increased efficiencies Increasedability to serve more customers in the same time Increased customer satisfaction Increased timely customer access to goods and services Improved quality Increased employee engagement Reduced waste, costs, and lost opportunities Benefits of Lean
  • 11.
    Lean is not….a headcount reduction an evaluation of your personal performance for companies struggling to stay in business a quick one-time fix applicable only to manufacturing What is NOT Lean?
  • 12.
    Lean requires changein Thought Culture Perspective Change must occur to achieve success. Lean Requires Change
  • 13.
    Why Change? Wecannot solve our problems with the same thinking we used when we created them. Albert Einstein
  • 14.
    Critical success factors:Communication Leading Training Acting Sustaining Plan, Do, Check, Act (PDCA) Implementing Change
  • 15.
    If the solutionis not obvious, hold events that enable small continuous improvements These are Kaizen or Rapid Improvement Events (RIEs) Kaizen events use problem solving tools to find solution. Change in Lean is Focused on Problem Solving
  • 16.
    What is Kaizen?Japanese for improvement or change for the better . It refers to a philosophy or practice that focuses upon continuous process improvement.
  • 17.
    Business Process KaizenTeams: Members are diverse Targets: Waste, Variables, and non-value added activities Typically a 3 - 5 day commitment Quick and simple, not slow and elegant Management ensures the necessary resources Immediate results
  • 18.
    Standardize IMPROVEMENT TIMEKaizen Kaizen Kaizen From “Kaizen”, Masaaki Imai Standardize Standardize Kaizen Starting Process
  • 19.
    “ The achievementsof an organization are the results of the combined effort of each individual.” Coach Vince Lombardi
  • 20.
    Why do weneed Teams? By working together, rather than competing with each other, we’ll see: Increased quality Higher productivity Reduced cost
  • 21.
    Teams Add ValueWhat’s in it for Me? New job skills Participate in decisions affecting your job Realize you add value to the company
  • 22.
    Team Building BuildingYour Team: Establish Team Guidelines Define Team Mission and Goals Conduct Effective Meetings Identify Team Roles and Responsibilities Develop Communication  Speaking and Listening Resolve Conflicts Make Group Decisions
  • 23.
    Teamwork Fundamentals Opencommunication Team members with diverse backgrounds Common goals Driven to succeed
  • 24.
    A team isa group of people working together towards a common goal.
  • 25.
    The focus ofLean is … waste elimination. Waste
  • 26.
    Anything other thanthe minimum resources required to add value to an end product or service. What is Waste?
  • 27.
    Waste Non-value addedwork, also called waste, refers to work that doesn't add value to or is unnecessary for the overall project.
  • 28.
    Non-Value Add ActivitiesImprove Evaluate Reduce Eliminate Value Add Transforms material and information into products or services The customer wants it It’s done right the first time Non-Value Add Consumes resources but does not contribute to the product or service Necessary Customers require it Regulatory or legal compliance Can’t eliminate based on current technology or thinking Not Necessary
  • 29.
    Waste Wheel 12 3 4 5 6 7 8 Value Added Work 5 % Over Production Inventory Transportation Knowledge Corrections Over Processing
  • 30.
    “ Eliminating…waste isnot the problem, identifying it is.” Taiichi Ohno developer of the Toyota Production System (TPS) The Real Problem:
  • 31.
    Examples of Wastein the Office Motion Going to copy machine or fax, searching for files, extra key strokes, hand-offs, going to get signatures. Waiting (Idle Time) Waiting for system to come up, customer or supplier responses, handed-off file to come back, decisions. Transportation Retrieving/storing files, carrying or posting paperwork, loops. Defects Data entry error, missing information, re-work. Over-Processing Repeated entry of data, “Cadillac” report when something less would do, unneeded steps, duplication, layers of approval. Over-Production Doing more than is needed, doing things too far ahead of customer need, creating reports that no one reads, making extra copies “just in case”. Inventory Open projects, unread e-mails, office supplies, unused records in database, items waiting for attention. Misused Resources Not engaging everyone in improvement, not utilizing all skills available in the organization, unclear roles and responsibilities.
  • 32.
    Learning to seewaste..… If we hadn’t challenged the status quo, we wouldn’t have: microwaves, cell phones, Ipads, portable air conditioners, makes/model of cars, laptops.
  • 33.
    A one pagevisual representation showing the flow of all processes, information and material Current state analysis (snap shot) shows All current value added and non-value added processes Future state analysis shows Improved value added processes and eliminates as much non-value added work as possible Action plan for target state implementation Introduction to Value Stream Mapping (VSM)
  • 34.
    Benefits of aVSM See entire process flow of information and materials Identify waste and the source of waste Establish priorities for improvement Focus on low cost or no cost improvements Reveals opportunities to improve customer satisfaction
  • 35.
    Establish the areasof focus Determine Book Ends (Start/Stop points) Identify steps by color: Yellow Process Sheets– tasks Pink Post-It Notes– problems/opportunities Green/Red Dots – (Non) Value-Added activities Brainstorm/Creative Problem Solving as needed Map future state / Create Parking Lot Prioritize changes Create Action Plan How to do a VSM
  • 36.
    Begin with FrameworkScope Process Start: Initial call for care Process End: Customer’s 1 st invoice Out-of-Scope: Needs to be filled in Objectives Eliminate 3-5 wastes Improve process flow Implement improvements in 30 days
  • 37.
    Current State Mapout each process step within the boundaries of start / stop Map flow of materials from one step to the next Map flow of information from start to finish Map takt time and cycle time Identify non value-added steps Identify opportunities for improvement
  • 38.
    Current State ProcessRequest to Proposal Invoice to Cash Receipt Order Confirmed thru Shipping Focus Area for improvement due to high number of wastes
  • 39.
    Current State ProcessEffectiveness November 4, 2011 Process Metrics Starting Baseline Full Process Starting Baseline Focus Area Total Number of Steps 45 26 # Value Adding Steps 23 13 # Non-Value Adding Steps 22 13 Number of Approvals 2 0 Number of Hand-offs 19 12 Number of Recycle Loops 12 5 Number Error Proofing Minimal 0
  • 40.
    Prioritized Areas ofFocus Brainstormed potential improvement areas Prioritized using Target Sheet and Effort/Impact Grid Incorporated into future state design
  • 41.
    Creating the FutureState Brainstorm opportunities for potential improvements Focus on (8 Wastes) low cost and no cost improvements Verify management support Verify Future State meets the established goals. Develop action plan for implementation within 30 -60 days
  • 42.
    Future State ProcessGenerate customer order through shipment Significantly streamlined process Eliminated 16 wastes vs target of 5-10 wastes Implementing improvements next week!
  • 43.
    Future State Process Effectiveness Process Metrics Starting Baseline Focus Areas Future State Focus Areas Actual Change % Improved Total Number of Steps 26 21 -5 19% # Value Adding Steps 13 13 No change # Non-Value Adding Steps 13 8 -5 38% # Hand-offs 12 4 -8 67% # Recycle Loops 5 2 -3 60% # Error Proofing 0 2 +2 200%
  • 44.
    Develop Action PlanCreate teams to work on tasks Ensure the right members are on the team Ensure teams have support and resources they need Review progress regularly Celebrate successes
  • 45.
    Ensure Success ofAction Plan IMPORTANT TASKS: Conduct regular scheduled meetings for participants. Inform everyone of the plan Inform everyone of what was learned in the process Provide a structure to work on problem solving and to complete tasks Verify progress on goals continuously Give support for the process continuously. Celebrate the success of the team.
  • 46.
    Plan Do CheckAct Act - How to improve next time Plan - What to do. How to do it. Do - What was planned. Check - Did things happen as planned?
  • 47.
    Keys to SuccessTeamwork Combat Waste 100% Quality, No Comebacks
  • 48.
    By the endof event you will … Create Current State Map Understand Current State problems and opportunities. Create a Future State Map Have a plan for implementing future state Have started developing standard work and visual controls to sustain changes. Celebrate your success!
  • 49.
    Basic Ground Rules Maintain a positive attitude Make no assumptions Take nothing personally Everyone on the team is equal Each person’s opinion matters There are no bad ideas or stupid questions Resolve all issues respectfully
  • 50.
    Together we cando what one cannot do alone!

Editor's Notes

  • #4 Businesses expect to make more profits. But how will you get different results if you don’t make changes.
  • #10 There are a number of robust tools in the LEAN tool box that we use to reduce waste and improve process A couple that focus on waste reduction you may have heard about: VSM Kaizen 5S Slide 13 Transition: Value Stream Mapping
  • #15 There are a number of key words on this slide Please notice that the first statement says lead the org NOT delegate, top management should be active, visible participants in leading the change process. Management must understand, embrace, and LEAD the organization into lean thinking The second key word is training, empowerment and enablement start with knowledge and training Value stream managers must be TRAINED , empowered and enabled to manage implementations Planning is the next key word. For example nothing will kill a lean effort in an org quicker than getting rid of resources that have been freed up as a result of waste elimination. Plans for human resources need to be figured out ahead of time and communicated to the whole organization. Finally the last statement implies measurement of progress toward lean goals. Plan, Do, Check, Act
  • #19 Lean is culture changing philosophy of Continuous Improvement (CI) . Kaizen means “small changes for the better” . Kaizen events are CI activities based on the PDCA/PDSA model in a step by step like process. Start with a process or activity - Make improvements – standardize – look for additional improvements - standardize – look for additional improvements – standardize – look for additional improvements, etc. Slide 20 Transition: PDSA Model
  • #27 If you’ll remember I defined LEAN as “a work philosophy of eliminating waste and increasing added value of products and services’. So understanding what is waste is an important consideration WHAT IS WASTE? Waste is anything other than the MINIMUM amount of resources required to ADD VALUE to the end product / service. Resources like - p eople, time, equipment, materials, parts and space - Remember “value is what the customer is willing to pay for Lean teaches you to first see and then eliminate waste. Slide 9 Transition: 8 types of waste
  • #29 Now, if you’re sitting there saying to yourself “Now J Michael, there are mandated things I have no control over and I while I might be inclined to label them waste they are a reality I HAVE to work with. And you’d be right on target. The reality is that there are some things that we have no control over and must deal with them as best we can but is no reason to throw the baby out with the bath water! There are lots of other wastes in your control that you can reduce and/or eliminate Slide 12 Transition: Lean Tool Box
  • #34 VSM is a lean technique for creating a one page visual representation of the flow of information and material used to bring a product or service to a consumer. Used to analyze the “current state” of all value added and non-value added processes used in producing a particular product or service. Once current state is mapped and analyzed a best case “Future State” is mapped to improve value added steps/processes and eliminate wasteful non-value added steps/processes. An target state implementation plan is created including communication of new performance and behavioral expectations, needed training, performance milestones and target completion dates and points at which successes will be celebrated. Slide 14 Transition: VSM current state example
  • #35 Below is the original slide wording: Provides the basis for an implementation road map.
  • #38 Once the Current State VSM is created, it becomes the baseline for improvement and for the creation of a Future State VSM The Future State is used as a implementation road map.
  • #47 The philosophy of continuous improvement (CI) through Kaizen follows the PSDA/PDCA model The first question to ask when starting a Kaizen event is what does the process do and is it really necessary? It would be a waste to improve a process that wasn’t necessary in the first place!!! PDSA steps Plan – Study process and determine what/how to improve it. Improve the process as much as possible.(*) Do – Implement new process Study /Check – assess new process Adjust/Act – make further improvements. Move to plan stage again to plan implementation. (*) Important to emphasize!! New process doesn’t have to be perfect the first time out. Through CI and the PDSA process you’ll make improvements Slide 20 Transition: 5S