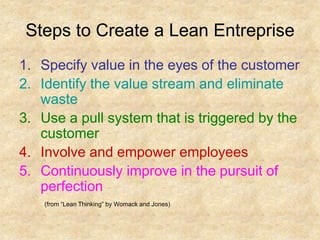
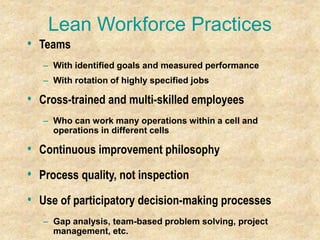
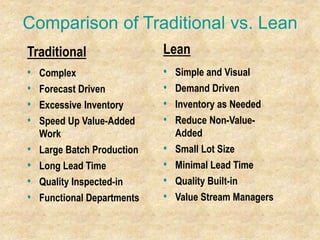
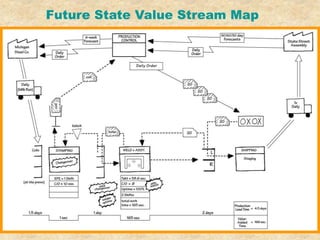
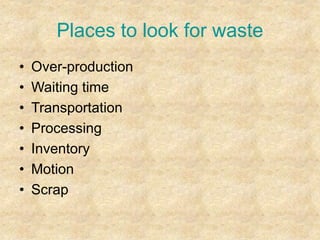
SlideShare a Scribd company logo
1 of 71
Lean Manufacturing
Why Lean is the key to improved
manufacturing
What is Lean?
• Fundamental objective:
– To create the most value while consuming the
fewest resources.
How is the objective
accomplished?
Lean production is aimed at the elimination of
waste in every area of production including
customer relations, product design, supplier
networks and factory management. Its goal is to
incorporate less human effort, less inventory,
less time to develop products, and less space to
become highly responsive to customer demand
while producing top quality products in the most
efficient and economical manner possible.
Cycle Time
“ One of the most noteworthy
accomplishments in keeping the price of
Ford products low is the gradual shortening
of the production cycle. The longer an article
is in the process of manufacture and the
more it is moved about, the greater is its
ultimate cost.”
Henry Ford, 1926
• Lean Production
• Eiji Toyoda visits Ford’s Rouge plant in 1950 and returns to
Japan to discuss his study with his production engineer,
Taiichi Ohno.
• Mass production techniques are determined to be
inappropriate for Japan because:
1. The market in Japan demanded a large variety of different
vehicles in relatively small quantities.
2. Unlike the practice in America, treating the workforce as a
variable cost was not possible in Japan. Management’s
right to lay off employees was severely restricted.
3. The Japanese economy was starved for capital after the
war, so purchasing the latest, expensive equipment was
not an option.
History of Lean Manufacturing
Source: The Machine That Changed The World, Womack, Jones, and Roos, p. 44.
Intro to Lean Mfg
Steps to Create a Lean Entreprise
1. Specify value in the eyes of the customer
2. Identify the value stream and eliminate
waste
3. Use a pull system that is triggered by the
customer
4. Involve and empower employees
5. Continuously improve in the pursuit of
perfection
(from “Lean Thinking” by Womack and Jones)
Lean is customer focused
• Make what the customer wants, when the
customer wants it, at a price the customer
is willing to pay
Value stream mapping
• Follow a “product” or “service” from
beginning to end
• Draw a visual representation of every
process in the material & information flow
Value Stream Mapping
Helps us see where value is created, and where waste
exists:
• A visual approach, by “product family”
• Shows flow of both material & information
• Helps us see which specific Lean tools can be
used to improve flow and eliminate waste
• Two maps will be made: Present State (“how it
is”) & Future State (“how it should be”)
• Will guide the creation of an action plan to
make the “should be” into a reality for that
product family
Value stream map
Definition of Value-Added
Value-Added
• Any activity that increases the market form or function
of the product or service. (These are things the
customer is willing to pay for.)
Non-Value Added (Waste or muda)
• Any activity or use of resources that does not add
market form or function or is not necessary. (These
activities should be reduced, integrated, simplified, or
eliminated.)
Using the Value Stream Map to Eliminate Waste
• Complexity
• Labor
• Overproduction
• Space
• Energy
• Defects
• Materials
• Idle Materials
•Transportation
•Time
Non-Value-Added: Hold
all waste in a “CLOSED
MITT”
Value-Added
Typically 95% of all lead time is non-value-added
Complexity
The waste of doing things the hard way!
• Excessive paperwork
• Excessive approvals
• Redundancy
Causes of complexity:
• Multiple “patches” on the process w/o fixing the
root cause.
• The “cool” factor of technology or machinery.
• Failing to look for the simple solutions.
Labor Waste
• Human effort that adds no value to the product or
service from the customers’ viewpoint.
• Not using people’s mental, creative, and physical
abilities
• Causes of labor waste
– Poor people/machine interface
– Inconsistent work methods
– Unfavorable workstation or cell layout
– Doing unnecessary/unneeded operations
– Poor workplace organization and housekeeping
– Redundant inspections/approvals
– Extra copies/excessive information
Overproduction
The waste of making too much, too soon, too
fast compared to the needs of the next
process.
• Causes of overproduction
– Just-in-case logic
– Misuse of automation
– Long process setup
– Non-level scheduling
– Unbalanced workload
– Misunderstood communications
– Reward system
– Unreliable shipment by suppliers
Space Waste
• Using more space than is required to build the
product to market demand.
• Causes of wasted space
– Poor layout
– Too much inventory, especially work in process
– Poor workplace organization
– Excess equipment
– Oversized equipment
Energy Waste
• Using more energy (people and machine)
than is required to build the product to
market demand.
• Causes of wasted energy
– Oversized or poorly maintained equipment
– Idle equipment
– Poor workplace organization
Defects
• Waste of inspection, repair and scrapping of
material to which value has already been added.
• Causes of defects
– Weak process control
– Poor quality system
– Deficient planned maintenance
– Inadequate education/training/work instructions
– Product design
– Customer needs not understood
– Defective information
Materials Waste
Any use of materials in excess of
what is needed to create value.
• Causes of material waste
–Not understanding the costs
–Inadequate
education/training/work
instructions
–Lack of standards
–Customer needs not understood
Idle Materials
The waste of having materials “sitting
around” in process without any value being
added to them.
• Causes of idle materials waste
– Unbalanced workload
– Unplanned maintenance
– Long process setup times
– Poor suppliers
– Upstream quality problems
– Unlevel scheduling
Transportation Waste
• Transporting parts and materials around
the plant, stacking and un-stacking, etc.
• Causes of transportation waste
– Poor plant layout
– Poor understanding of
production process flow
– Large batch size, long lead
times, large storage areas
Time Waste
Any activity that consumes time without
adding value, especially the waste of
waiting (equipment downtime, waiting
for materials, setup, etc.).
• Causes of wasted time:
• Poor machine maintenance.
• Line imbalances.
• Poor setup discipline.
• Poor communication between
processes.
Lean Building Blocks
Quick Changeover
Standardized Work Batch Reduction Teams
Quality at Source
5S System Visual Plant Layout
POUS
Cellular/Flow
Pull/Kanban TPM
Value
Stream
Mapping
Continuous Improvement
Definition for Kaizen ―
Alternate name for Lean
• Kaizen: leadership philosophy, a
management methodology, and a set of
tools all wrapped into one.
– Indicates long-term betterment
– Makes “little improvements”
– Under Kaizen, the entire facility is orderly
– Visual keys are used to assist in ordering
the workplace
Visual Controls
• Simple signals that provide an immediate
understanding of a situation or condition. They
are efficient, self-regulating, and worker-managed.
• Examples:
– Kanban (stock signal) Cards
– Color-coded dies, tools, pallets
– Lines on the floor to delineate storage areas,
walkways, work areas etc.
– Lights to indicate production status
– Location signs on shop floor and in the office
– Identification labels everywhere
Standardized Work
Graphic = Good
• Tools are illustrated
• Parts are pictured and
numbered
• Spatial relationships
are clearly shown
• Small items enlarged
to show assembly detail
• All items are either
physically labeled or
identified by number in
assembly graphic
Standardized Work
5S - Workplace Organization
A safe, clean, neat, arrangement of the workplace
provides a specific location for everything, and
eliminates anything not required.
In Lean manufacturing, we refer to this as 5S.
Examples: EMT’s, fire department, etc.
Elements of a 5S Program
• Sort—Perform “Sort Through and Sort Out,” - red tag all
unneeded items and move them out to an established
“quarantine” area for disposition within a predetermined time.
“When in doubt, move it out!”
• Set in Order—Identify the best location for remaining items and
label them. “A place for everything & everything in its place”.
• Sweep (Systematic Cleaning)—Clean everything, inside and out.
Use visual sweeps to ensure everything is where it should be
and that junk is not accumulating.
• Standardize—Create the rules for maintaining and controlling
the first 3 S’s. Use visual controls.
• Sustain—Ensure adherence to the 5S standards through
communication, training, self-discipline and rewards.
Before 5S
Before 5S
After 5S
After 5S
After 5S
Traditional Plant Layout
Plant Layout for Flow
Raw Stock
QC Rec
Ship
Shear
Screw
Machine
QC
Stamp
Assembly
Brake Mill
Lathe
Weld Finish
Grind Parts Stock
Drill
Obstacles to Flow
• “Monuments”:
– Unmovable items in the plant, i.e., large pieces of
equipment, structural supports or walls, etc.
– Too expensive to move or replace, yet not in the
proper place to allow good product flow.
• What do we do about monuments?
– We have to leave them where they are (for now)!
– We do our best to work around them.
– Put in place the best flow given the monuments, but
must always be looking for a better way.
Impact of Batch Size Reduction
10 minutes
10 minutes
Batch & Queue Processing
Lead Time 30+ minutes for total order
21+ minutes for first piece
10 minutes
Process
A
Process
B
Process
C
Process
B
Process
A
Process
C
Continuous Flow Processing
12 min. for total order
3 min. for first part
The Ideal Lot Size
• Ideal lot size is one
• Velocity = The smaller the lot size,
the faster the parts will flow through
the manufacturing process
• Flexibility = The smaller the lot
size, the more variety in demand the
system can handle
More Lean Tools
• Setup Reduction or Quick Changeover
(SMED)
• Point of Use Storage (POUS)
• Quality at the Source
• Visual Inspection
• Pull (including Kanban, Two Bin,
Min/Max)
• Cellular Manufacturing
• Total Productive Maintenance
Change Over
• STEPS IN A CHANGEOVER:
1. Preparation
2. Remove/Install Tooling
3. Change Machine Settings
4. Make Trial Pieces & Adjust
Setup Reduction or Quick Changeover
• Definition: Minimizing the time from last
good piece of the current product run to
first good piece of the next (different)
product run.
Percent of time of changeover
Making trial pieces and adjusting
50%
15%
30%
15%
5%
Preparation, after-process adjustment,
checking, return to storage of parts,
tools, fixtures, move materials
Removing parts, blades, jigs, etc.;
mounting same for next lot, move
materials
Machine settings, measurements
Change Over
• Reduce the complexity and increase the efficiency of
setups by standardizing as much of the hardware and
methodology as possible.
No/Low Cost Solution: Use of
Positioning Pins
Positioning
Pins
Positioning
Pins
No/Low Cost Solution:
One-Turn Methods
Pear-Shaped Hole Method
Tighten Here
Attach and
Remove Here
Other Functional Clamps
Quick Changeover: Visual Controls
Quick Changeover
Clearly labeled
cutter size and
style
All regular router
cuts needed in this
workcell stored at
router table.
Standardization & Setup
Reduction
• Common fasteners and fittings – standardize on the sizes
and types.
• Standardized carrier plates, fixtures, shut heights, etc.
• Standardized procedures along “product families”, where
the product families share common manufacturing
processes & equipment.
• Share information and communicate “best practices”
across all operations and shifts.
• Monitor & track setup times relative to standard time.
Point of Use Storage (POUS)
• Raw material, components used, and
information is present at workstation where
used
• Works best if vendor relationship permits
frequent, on-time replenishment and small
shipments
• Simplifies physical inventory tracking, storage,
and handling
Quality at the Source
• Source Inspection: Operators must be certain
that the product they are passing to the next
workstation is of acceptable quality.
• Operators must be given the means to perform
inspection at the source, before they pass it
along.
• Samples or established standards are visible
tools that can be used in the cell for such
purposes.
Visual Inspection Example
•No missing screws
•All screws seated
•Specify what to inspect
•Clear inspection criteria
•Don’t overload operator
with complex content or
criteria
Push vs. Pull Systems
• Push System
– Resources are provided to the consumer
based on forecasts or schedules
• Pull System
– A method of controlling the flow of
resources by replacing only what has been
consumed
Pull System
• Pull system consists of:
– Production based on actual consumption
– Small lots
– Low inventories
– Management by sight
– Better communication
Pull System Flow
Diagram
Information Flow
Supplier
Raw
Matl
Process
A
Process
B
Fin.
Goods
Kanban
Locations
Process
C
Customer
Parts Flow
Pull System Methods
• Kanban:
– A visual signal telling us what we
need to produce.
– Cards, “open spots”, etc.
• Two-bin System:
– Used for commonly produced items,
sub-assemblies.
– When a bin is empty, fill it.
– Ensures there is always material
available while minimizing inventory.
Cellular Manufacturing
Linking of manual and machine operations into the most
efficient combination to maximize value-added content while
minimizing waste.
Punch
Cut to size
De-burr
Sand
Form
Package
Advantages of cells: Communication and shared labor
Moving to Cellular Manufacturing/Flow Production
Inv Inv
Inv
Inv
C
D
E
B
Inv
A
A
Inv
A
A
Inv
A
Inv
Inv
Inv
Inv
B
B
Inv Inv
B Inv
C
C
C
C
Inv
Inv Inv Inv Inv
E
E
E
D
D
D
D
Dept “A” Dept “B” Dept “C”
Dept “E”
Dept “D”
D
E
C
B
A
D
E
C
B
A
Stage 1
Production in Specialized Departments
Stage 2
Production in Product Cell
Stage 4
Production in Compact Cell with One-Piece Flow
and Separation Man/Machine
Stage 3
Production in Compact Cell with One-Piece Flow
Total Productive Maintenance (TPM)
• Systematic approach to the elimination of
equipment downtime as a waste factor
• Enlisting the intelligence and skills of the
people who are MOST familiar with the
factory machines: the equipment operators
• Charting/analyzing equipment performance
to identify root cause of problems, and
implementing permanent corrective actions
Continuous Improvement
(CI)
Old Adage:
“If you always do what you always did, you’ll
always get what you always got.”
Competitive Corollary:
“If the other guy gets BETTER, you’re gonna
get LESS.”
Lean Workforce Practices
• Teams
– With identified goals and measured performance
– With rotation of highly specified jobs
• Cross-trained and multi-skilled employees
– Who can work many operations within a cell and
operations in different cells
• Continuous improvement philosophy
• Process quality, not inspection
• Use of participatory decision-making processes
– Gap analysis, team-based problem solving, project
management, etc.
Implementation Success Factors
• Unyielding leadership
• Strategic vision based on Lean enterprise as part
of company strategy
• Observe outside successes and failures
• Ability to question EVERYTHING
• Deep commitment to EXCELLENCE
• Consistency
• Clear channels of communication
Comparison of Traditional vs. Lean
Lean
• Simple and Visual
• Demand Driven
• Inventory as Needed
• Reduce Non-Value-
Added
• Small Lot Size
• Minimal Lead Time
• Quality Built-in
• Value Stream Managers
Traditional
• Complex
• Forecast Driven
• Excessive Inventory
• Speed Up Value-Added
Work
• Large Batch Production
• Long Lead Time
• Quality Inspected-in
• Functional Departments
Must Not Must
Go to the
Shop Floor
Think of at
least 7 ways
to do better
Kaizen your
Standard Work
Have a vision
Observe the process
Find the Waste
Provide the
right tools
Set goals
Communicate
direction
Hide in the
office
Create smoke
screens Grovel Be clueless
Throw fits
Give up
Blame the
worker
Blame the Measure
Tamper with
the Measure
Cover up
Stress out Throw People at Problems
Flex
Muscles
Show Boat
Empower the Team
Celebrate Success
Lead by Example
Intimidate
Quality of a GOOD Leader
Mapping the Future State
• Determine Available Time/Demand
• Determine where continuous flow is possible
• Determine what pull systems will be used
• Determine pacemaker operation
• Determine how pacemaker will be
scheduled/leveled
• Determine increment of work released at
pacemaker
• Identify necessary process improvements to
achieve future state flow
Future State Value Stream Map
Results
• Production lead time 23.5 days 4.5 days
Old New
Thank You.
L E A N
E N T E R P R I S E
Places to look for waste
• Over-production
• Waiting time
• Transportation
• Processing
• Inventory
• Motion
• Scrap
Setup Time Drives Batch Size:
The Economic Order Quantities (EOQ) model determines the
most economic lot/batch size for a production run.
Fixed Cost
Increasing Lot/Batch Size
EOQ
Changeover Cost
Inventory Carrying Cost
Changeover Cost + Inventory Carrying Cost
Variable
Cost

More Related Content

Similar to Presentation on Lean Manufacturing and waste elimination

Kanban_230916
Kanban_230916Kanban_230916
Kanban_230916
Ram Kumar
 
lean manufacturing.ppt cost profit accounts
lean manufacturing.ppt cost profit accountslean manufacturing.ppt cost profit accounts
lean manufacturing.ppt cost profit accounts
SabaKhalid48
 

Similar to Presentation on Lean Manufacturing and waste elimination (20)

3 lean thinking & jit
3 lean thinking & jit3 lean thinking & jit
3 lean thinking & jit
 
Lean Warehouse 101
Lean Warehouse 101 Lean Warehouse 101
Lean Warehouse 101
 
Lean Manufacturing
Lean Manufacturing Lean Manufacturing
Lean Manufacturing
 
Lean management and six sigma
Lean management and six sigmaLean management and six sigma
Lean management and six sigma
 
OM1 e06 (1).pptx
OM1 e06 (1).pptxOM1 e06 (1).pptx
OM1 e06 (1).pptx
 
JIT & Lean Manufacturing - ADDVALUE - Nilesh Arora
JIT & Lean Manufacturing - ADDVALUE - Nilesh AroraJIT & Lean Manufacturing - ADDVALUE - Nilesh Arora
JIT & Lean Manufacturing - ADDVALUE - Nilesh Arora
 
Lean logistics and warehousing final
Lean logistics and warehousing finalLean logistics and warehousing final
Lean logistics and warehousing final
 
Workplace management : 5S / Visual Control
Workplace management :  5S / Visual ControlWorkplace management :  5S / Visual Control
Workplace management : 5S / Visual Control
 
Lean management
Lean managementLean management
Lean management
 
Lean Methodology July Monthly
Lean Methodology July MonthlyLean Methodology July Monthly
Lean Methodology July Monthly
 
Kanban_230916
Kanban_230916Kanban_230916
Kanban_230916
 
Lean manufacturing overview
Lean manufacturing overviewLean manufacturing overview
Lean manufacturing overview
 
Manufacturing Recap
Manufacturing RecapManufacturing Recap
Manufacturing Recap
 
Lean startup
Lean startupLean startup
Lean startup
 
WASTE ELIMINATION
WASTE ELIMINATIONWASTE ELIMINATION
WASTE ELIMINATION
 
Lean manufacturing
Lean manufacturingLean manufacturing
Lean manufacturing
 
Lean
LeanLean
Lean
 
Just In Time
Just In TimeJust In Time
Just In Time
 
lean manufacturing.ppt cost profit accounts
lean manufacturing.ppt cost profit accountslean manufacturing.ppt cost profit accounts
lean manufacturing.ppt cost profit accounts
 
Literature review - Data mining and Business Intelligence in Manufacturing
Literature review - Data mining and Business Intelligence in ManufacturingLiterature review - Data mining and Business Intelligence in Manufacturing
Literature review - Data mining and Business Intelligence in Manufacturing
 

Recently uploaded

"Lesotho Leaps Forward: A Chronicle of Transformative Developments"
"Lesotho Leaps Forward: A Chronicle of Transformative Developments""Lesotho Leaps Forward: A Chronicle of Transformative Developments"
"Lesotho Leaps Forward: A Chronicle of Transformative Developments"
mphochane1998
 
scipt v1.pptxcxxxxxxxxxxxxxxxxxxxxxxxxxxxxxxxxxxxxxxxxxxxxxxxxxxxxxxxxxxxxxxx...
scipt v1.pptxcxxxxxxxxxxxxxxxxxxxxxxxxxxxxxxxxxxxxxxxxxxxxxxxxxxxxxxxxxxxxxxx...scipt v1.pptxcxxxxxxxxxxxxxxxxxxxxxxxxxxxxxxxxxxxxxxxxxxxxxxxxxxxxxxxxxxxxxxx...
scipt v1.pptxcxxxxxxxxxxxxxxxxxxxxxxxxxxxxxxxxxxxxxxxxxxxxxxxxxxxxxxxxxxxxxxx...
HenryBriggs2
 
Standard vs Custom Battery Packs - Decoding the Power Play
Standard vs Custom Battery Packs - Decoding the Power PlayStandard vs Custom Battery Packs - Decoding the Power Play
Standard vs Custom Battery Packs - Decoding the Power Play
Epec Engineered Technologies
 
Integrated Test Rig For HTFE-25 - Neometrix
Integrated Test Rig For HTFE-25 - NeometrixIntegrated Test Rig For HTFE-25 - Neometrix
Integrated Test Rig For HTFE-25 - Neometrix
Neometrix_Engineering_Pvt_Ltd
 
DeepFakes presentation : brief idea of DeepFakes
DeepFakes presentation : brief idea of DeepFakesDeepFakes presentation : brief idea of DeepFakes
DeepFakes presentation : brief idea of DeepFakes
MayuraD1
 

Recently uploaded (20)

Moment Distribution Method For Btech Civil
Moment Distribution Method For Btech CivilMoment Distribution Method For Btech Civil
Moment Distribution Method For Btech Civil
 
S1S2 B.Arch MGU - HOA1&2 Module 3 -Temple Architecture of Kerala.pptx
S1S2 B.Arch MGU - HOA1&2 Module 3 -Temple Architecture of Kerala.pptxS1S2 B.Arch MGU - HOA1&2 Module 3 -Temple Architecture of Kerala.pptx
S1S2 B.Arch MGU - HOA1&2 Module 3 -Temple Architecture of Kerala.pptx
 
Work-Permit-Receiver-in-Saudi-Aramco.pptx
Work-Permit-Receiver-in-Saudi-Aramco.pptxWork-Permit-Receiver-in-Saudi-Aramco.pptx
Work-Permit-Receiver-in-Saudi-Aramco.pptx
 
Online food ordering system project report.pdf
Online food ordering system project report.pdfOnline food ordering system project report.pdf
Online food ordering system project report.pdf
 
A CASE STUDY ON CERAMIC INDUSTRY OF BANGLADESH.pptx
A CASE STUDY ON CERAMIC INDUSTRY OF BANGLADESH.pptxA CASE STUDY ON CERAMIC INDUSTRY OF BANGLADESH.pptx
A CASE STUDY ON CERAMIC INDUSTRY OF BANGLADESH.pptx
 
A Study of Urban Area Plan for Pabna Municipality
A Study of Urban Area Plan for Pabna MunicipalityA Study of Urban Area Plan for Pabna Municipality
A Study of Urban Area Plan for Pabna Municipality
 
"Lesotho Leaps Forward: A Chronicle of Transformative Developments"
"Lesotho Leaps Forward: A Chronicle of Transformative Developments""Lesotho Leaps Forward: A Chronicle of Transformative Developments"
"Lesotho Leaps Forward: A Chronicle of Transformative Developments"
 
scipt v1.pptxcxxxxxxxxxxxxxxxxxxxxxxxxxxxxxxxxxxxxxxxxxxxxxxxxxxxxxxxxxxxxxxx...
scipt v1.pptxcxxxxxxxxxxxxxxxxxxxxxxxxxxxxxxxxxxxxxxxxxxxxxxxxxxxxxxxxxxxxxxx...scipt v1.pptxcxxxxxxxxxxxxxxxxxxxxxxxxxxxxxxxxxxxxxxxxxxxxxxxxxxxxxxxxxxxxxxx...
scipt v1.pptxcxxxxxxxxxxxxxxxxxxxxxxxxxxxxxxxxxxxxxxxxxxxxxxxxxxxxxxxxxxxxxxx...
 
💚Trustworthy Call Girls Pune Call Girls Service Just Call 🍑👄6378878445 🍑👄 Top...
💚Trustworthy Call Girls Pune Call Girls Service Just Call 🍑👄6378878445 🍑👄 Top...💚Trustworthy Call Girls Pune Call Girls Service Just Call 🍑👄6378878445 🍑👄 Top...
💚Trustworthy Call Girls Pune Call Girls Service Just Call 🍑👄6378878445 🍑👄 Top...
 
Thermal Engineering Unit - I & II . ppt
Thermal Engineering  Unit - I & II . pptThermal Engineering  Unit - I & II . ppt
Thermal Engineering Unit - I & II . ppt
 
AIRCANVAS[1].pdf mini project for btech students
AIRCANVAS[1].pdf mini project for btech studentsAIRCANVAS[1].pdf mini project for btech students
AIRCANVAS[1].pdf mini project for btech students
 
Standard vs Custom Battery Packs - Decoding the Power Play
Standard vs Custom Battery Packs - Decoding the Power PlayStandard vs Custom Battery Packs - Decoding the Power Play
Standard vs Custom Battery Packs - Decoding the Power Play
 
Introduction to Serverless with AWS Lambda
Introduction to Serverless with AWS LambdaIntroduction to Serverless with AWS Lambda
Introduction to Serverless with AWS Lambda
 
Unleashing the Power of the SORA AI lastest leap
Unleashing the Power of the SORA AI lastest leapUnleashing the Power of the SORA AI lastest leap
Unleashing the Power of the SORA AI lastest leap
 
Integrated Test Rig For HTFE-25 - Neometrix
Integrated Test Rig For HTFE-25 - NeometrixIntegrated Test Rig For HTFE-25 - Neometrix
Integrated Test Rig For HTFE-25 - Neometrix
 
DeepFakes presentation : brief idea of DeepFakes
DeepFakes presentation : brief idea of DeepFakesDeepFakes presentation : brief idea of DeepFakes
DeepFakes presentation : brief idea of DeepFakes
 
School management system project Report.pdf
School management system project Report.pdfSchool management system project Report.pdf
School management system project Report.pdf
 
Unit 4_Part 1 CSE2001 Exception Handling and Function Template and Class Temp...
Unit 4_Part 1 CSE2001 Exception Handling and Function Template and Class Temp...Unit 4_Part 1 CSE2001 Exception Handling and Function Template and Class Temp...
Unit 4_Part 1 CSE2001 Exception Handling and Function Template and Class Temp...
 
Hostel management system project report..pdf
Hostel management system project report..pdfHostel management system project report..pdf
Hostel management system project report..pdf
 
DC MACHINE-Motoring and generation, Armature circuit equation
DC MACHINE-Motoring and generation, Armature circuit equationDC MACHINE-Motoring and generation, Armature circuit equation
DC MACHINE-Motoring and generation, Armature circuit equation
 

Presentation on Lean Manufacturing and waste elimination

  • 1. Lean Manufacturing Why Lean is the key to improved manufacturing
  • 2. What is Lean? • Fundamental objective: – To create the most value while consuming the fewest resources.
  • 3. How is the objective accomplished? Lean production is aimed at the elimination of waste in every area of production including customer relations, product design, supplier networks and factory management. Its goal is to incorporate less human effort, less inventory, less time to develop products, and less space to become highly responsive to customer demand while producing top quality products in the most efficient and economical manner possible.
  • 4. Cycle Time “ One of the most noteworthy accomplishments in keeping the price of Ford products low is the gradual shortening of the production cycle. The longer an article is in the process of manufacture and the more it is moved about, the greater is its ultimate cost.” Henry Ford, 1926
  • 5. • Lean Production • Eiji Toyoda visits Ford’s Rouge plant in 1950 and returns to Japan to discuss his study with his production engineer, Taiichi Ohno. • Mass production techniques are determined to be inappropriate for Japan because: 1. The market in Japan demanded a large variety of different vehicles in relatively small quantities. 2. Unlike the practice in America, treating the workforce as a variable cost was not possible in Japan. Management’s right to lay off employees was severely restricted. 3. The Japanese economy was starved for capital after the war, so purchasing the latest, expensive equipment was not an option. History of Lean Manufacturing
  • 6. Source: The Machine That Changed The World, Womack, Jones, and Roos, p. 44. Intro to Lean Mfg
  • 7. Steps to Create a Lean Entreprise 1. Specify value in the eyes of the customer 2. Identify the value stream and eliminate waste 3. Use a pull system that is triggered by the customer 4. Involve and empower employees 5. Continuously improve in the pursuit of perfection (from “Lean Thinking” by Womack and Jones)
  • 8. Lean is customer focused • Make what the customer wants, when the customer wants it, at a price the customer is willing to pay
  • 9. Value stream mapping • Follow a “product” or “service” from beginning to end • Draw a visual representation of every process in the material & information flow
  • 10. Value Stream Mapping Helps us see where value is created, and where waste exists: • A visual approach, by “product family” • Shows flow of both material & information • Helps us see which specific Lean tools can be used to improve flow and eliminate waste • Two maps will be made: Present State (“how it is”) & Future State (“how it should be”) • Will guide the creation of an action plan to make the “should be” into a reality for that product family
  • 12. Definition of Value-Added Value-Added • Any activity that increases the market form or function of the product or service. (These are things the customer is willing to pay for.) Non-Value Added (Waste or muda) • Any activity or use of resources that does not add market form or function or is not necessary. (These activities should be reduced, integrated, simplified, or eliminated.)
  • 13. Using the Value Stream Map to Eliminate Waste • Complexity • Labor • Overproduction • Space • Energy • Defects • Materials • Idle Materials •Transportation •Time Non-Value-Added: Hold all waste in a “CLOSED MITT” Value-Added Typically 95% of all lead time is non-value-added
  • 14. Complexity The waste of doing things the hard way! • Excessive paperwork • Excessive approvals • Redundancy Causes of complexity: • Multiple “patches” on the process w/o fixing the root cause. • The “cool” factor of technology or machinery. • Failing to look for the simple solutions.
  • 15. Labor Waste • Human effort that adds no value to the product or service from the customers’ viewpoint. • Not using people’s mental, creative, and physical abilities • Causes of labor waste – Poor people/machine interface – Inconsistent work methods – Unfavorable workstation or cell layout – Doing unnecessary/unneeded operations – Poor workplace organization and housekeeping – Redundant inspections/approvals – Extra copies/excessive information
  • 16. Overproduction The waste of making too much, too soon, too fast compared to the needs of the next process. • Causes of overproduction – Just-in-case logic – Misuse of automation – Long process setup – Non-level scheduling – Unbalanced workload – Misunderstood communications – Reward system – Unreliable shipment by suppliers
  • 17. Space Waste • Using more space than is required to build the product to market demand. • Causes of wasted space – Poor layout – Too much inventory, especially work in process – Poor workplace organization – Excess equipment – Oversized equipment
  • 18. Energy Waste • Using more energy (people and machine) than is required to build the product to market demand. • Causes of wasted energy – Oversized or poorly maintained equipment – Idle equipment – Poor workplace organization
  • 19. Defects • Waste of inspection, repair and scrapping of material to which value has already been added. • Causes of defects – Weak process control – Poor quality system – Deficient planned maintenance – Inadequate education/training/work instructions – Product design – Customer needs not understood – Defective information
  • 20. Materials Waste Any use of materials in excess of what is needed to create value. • Causes of material waste –Not understanding the costs –Inadequate education/training/work instructions –Lack of standards –Customer needs not understood
  • 21. Idle Materials The waste of having materials “sitting around” in process without any value being added to them. • Causes of idle materials waste – Unbalanced workload – Unplanned maintenance – Long process setup times – Poor suppliers – Upstream quality problems – Unlevel scheduling
  • 22. Transportation Waste • Transporting parts and materials around the plant, stacking and un-stacking, etc. • Causes of transportation waste – Poor plant layout – Poor understanding of production process flow – Large batch size, long lead times, large storage areas
  • 23. Time Waste Any activity that consumes time without adding value, especially the waste of waiting (equipment downtime, waiting for materials, setup, etc.). • Causes of wasted time: • Poor machine maintenance. • Line imbalances. • Poor setup discipline. • Poor communication between processes.
  • 24. Lean Building Blocks Quick Changeover Standardized Work Batch Reduction Teams Quality at Source 5S System Visual Plant Layout POUS Cellular/Flow Pull/Kanban TPM Value Stream Mapping Continuous Improvement
  • 25. Definition for Kaizen ― Alternate name for Lean • Kaizen: leadership philosophy, a management methodology, and a set of tools all wrapped into one. – Indicates long-term betterment – Makes “little improvements” – Under Kaizen, the entire facility is orderly – Visual keys are used to assist in ordering the workplace
  • 26. Visual Controls • Simple signals that provide an immediate understanding of a situation or condition. They are efficient, self-regulating, and worker-managed. • Examples: – Kanban (stock signal) Cards – Color-coded dies, tools, pallets – Lines on the floor to delineate storage areas, walkways, work areas etc. – Lights to indicate production status – Location signs on shop floor and in the office – Identification labels everywhere
  • 27. Standardized Work Graphic = Good • Tools are illustrated • Parts are pictured and numbered • Spatial relationships are clearly shown • Small items enlarged to show assembly detail • All items are either physically labeled or identified by number in assembly graphic
  • 29. 5S - Workplace Organization A safe, clean, neat, arrangement of the workplace provides a specific location for everything, and eliminates anything not required. In Lean manufacturing, we refer to this as 5S. Examples: EMT’s, fire department, etc.
  • 30. Elements of a 5S Program • Sort—Perform “Sort Through and Sort Out,” - red tag all unneeded items and move them out to an established “quarantine” area for disposition within a predetermined time. “When in doubt, move it out!” • Set in Order—Identify the best location for remaining items and label them. “A place for everything & everything in its place”. • Sweep (Systematic Cleaning)—Clean everything, inside and out. Use visual sweeps to ensure everything is where it should be and that junk is not accumulating. • Standardize—Create the rules for maintaining and controlling the first 3 S’s. Use visual controls. • Sustain—Ensure adherence to the 5S standards through communication, training, self-discipline and rewards.
  • 37. Plant Layout for Flow Raw Stock QC Rec Ship Shear Screw Machine QC Stamp Assembly Brake Mill Lathe Weld Finish Grind Parts Stock Drill
  • 38. Obstacles to Flow • “Monuments”: – Unmovable items in the plant, i.e., large pieces of equipment, structural supports or walls, etc. – Too expensive to move or replace, yet not in the proper place to allow good product flow. • What do we do about monuments? – We have to leave them where they are (for now)! – We do our best to work around them. – Put in place the best flow given the monuments, but must always be looking for a better way.
  • 39. Impact of Batch Size Reduction 10 minutes 10 minutes Batch & Queue Processing Lead Time 30+ minutes for total order 21+ minutes for first piece 10 minutes Process A Process B Process C Process B Process A Process C Continuous Flow Processing 12 min. for total order 3 min. for first part
  • 40. The Ideal Lot Size • Ideal lot size is one • Velocity = The smaller the lot size, the faster the parts will flow through the manufacturing process • Flexibility = The smaller the lot size, the more variety in demand the system can handle
  • 41. More Lean Tools • Setup Reduction or Quick Changeover (SMED) • Point of Use Storage (POUS) • Quality at the Source • Visual Inspection • Pull (including Kanban, Two Bin, Min/Max) • Cellular Manufacturing • Total Productive Maintenance
  • 42. Change Over • STEPS IN A CHANGEOVER: 1. Preparation 2. Remove/Install Tooling 3. Change Machine Settings 4. Make Trial Pieces & Adjust
  • 43. Setup Reduction or Quick Changeover • Definition: Minimizing the time from last good piece of the current product run to first good piece of the next (different) product run. Percent of time of changeover Making trial pieces and adjusting 50% 15% 30% 15% 5% Preparation, after-process adjustment, checking, return to storage of parts, tools, fixtures, move materials Removing parts, blades, jigs, etc.; mounting same for next lot, move materials Machine settings, measurements
  • 44. Change Over • Reduce the complexity and increase the efficiency of setups by standardizing as much of the hardware and methodology as possible.
  • 45. No/Low Cost Solution: Use of Positioning Pins Positioning Pins Positioning Pins
  • 46. No/Low Cost Solution: One-Turn Methods Pear-Shaped Hole Method Tighten Here Attach and Remove Here
  • 49. Quick Changeover Clearly labeled cutter size and style All regular router cuts needed in this workcell stored at router table.
  • 50. Standardization & Setup Reduction • Common fasteners and fittings – standardize on the sizes and types. • Standardized carrier plates, fixtures, shut heights, etc. • Standardized procedures along “product families”, where the product families share common manufacturing processes & equipment. • Share information and communicate “best practices” across all operations and shifts. • Monitor & track setup times relative to standard time.
  • 51. Point of Use Storage (POUS) • Raw material, components used, and information is present at workstation where used • Works best if vendor relationship permits frequent, on-time replenishment and small shipments • Simplifies physical inventory tracking, storage, and handling
  • 52. Quality at the Source • Source Inspection: Operators must be certain that the product they are passing to the next workstation is of acceptable quality. • Operators must be given the means to perform inspection at the source, before they pass it along. • Samples or established standards are visible tools that can be used in the cell for such purposes.
  • 53. Visual Inspection Example •No missing screws •All screws seated •Specify what to inspect •Clear inspection criteria •Don’t overload operator with complex content or criteria
  • 54. Push vs. Pull Systems • Push System – Resources are provided to the consumer based on forecasts or schedules • Pull System – A method of controlling the flow of resources by replacing only what has been consumed
  • 55. Pull System • Pull system consists of: – Production based on actual consumption – Small lots – Low inventories – Management by sight – Better communication
  • 56. Pull System Flow Diagram Information Flow Supplier Raw Matl Process A Process B Fin. Goods Kanban Locations Process C Customer Parts Flow
  • 57. Pull System Methods • Kanban: – A visual signal telling us what we need to produce. – Cards, “open spots”, etc. • Two-bin System: – Used for commonly produced items, sub-assemblies. – When a bin is empty, fill it. – Ensures there is always material available while minimizing inventory.
  • 58. Cellular Manufacturing Linking of manual and machine operations into the most efficient combination to maximize value-added content while minimizing waste. Punch Cut to size De-burr Sand Form Package Advantages of cells: Communication and shared labor
  • 59. Moving to Cellular Manufacturing/Flow Production Inv Inv Inv Inv C D E B Inv A A Inv A A Inv A Inv Inv Inv Inv B B Inv Inv B Inv C C C C Inv Inv Inv Inv Inv E E E D D D D Dept “A” Dept “B” Dept “C” Dept “E” Dept “D” D E C B A D E C B A Stage 1 Production in Specialized Departments Stage 2 Production in Product Cell Stage 4 Production in Compact Cell with One-Piece Flow and Separation Man/Machine Stage 3 Production in Compact Cell with One-Piece Flow
  • 60. Total Productive Maintenance (TPM) • Systematic approach to the elimination of equipment downtime as a waste factor • Enlisting the intelligence and skills of the people who are MOST familiar with the factory machines: the equipment operators • Charting/analyzing equipment performance to identify root cause of problems, and implementing permanent corrective actions
  • 61. Continuous Improvement (CI) Old Adage: “If you always do what you always did, you’ll always get what you always got.” Competitive Corollary: “If the other guy gets BETTER, you’re gonna get LESS.”
  • 62. Lean Workforce Practices • Teams – With identified goals and measured performance – With rotation of highly specified jobs • Cross-trained and multi-skilled employees – Who can work many operations within a cell and operations in different cells • Continuous improvement philosophy • Process quality, not inspection • Use of participatory decision-making processes – Gap analysis, team-based problem solving, project management, etc.
  • 63. Implementation Success Factors • Unyielding leadership • Strategic vision based on Lean enterprise as part of company strategy • Observe outside successes and failures • Ability to question EVERYTHING • Deep commitment to EXCELLENCE • Consistency • Clear channels of communication
  • 64. Comparison of Traditional vs. Lean Lean • Simple and Visual • Demand Driven • Inventory as Needed • Reduce Non-Value- Added • Small Lot Size • Minimal Lead Time • Quality Built-in • Value Stream Managers Traditional • Complex • Forecast Driven • Excessive Inventory • Speed Up Value-Added Work • Large Batch Production • Long Lead Time • Quality Inspected-in • Functional Departments
  • 65. Must Not Must Go to the Shop Floor Think of at least 7 ways to do better Kaizen your Standard Work Have a vision Observe the process Find the Waste Provide the right tools Set goals Communicate direction Hide in the office Create smoke screens Grovel Be clueless Throw fits Give up Blame the worker Blame the Measure Tamper with the Measure Cover up Stress out Throw People at Problems Flex Muscles Show Boat Empower the Team Celebrate Success Lead by Example Intimidate Quality of a GOOD Leader
  • 66. Mapping the Future State • Determine Available Time/Demand • Determine where continuous flow is possible • Determine what pull systems will be used • Determine pacemaker operation • Determine how pacemaker will be scheduled/leveled • Determine increment of work released at pacemaker • Identify necessary process improvements to achieve future state flow
  • 67. Future State Value Stream Map
  • 68. Results • Production lead time 23.5 days 4.5 days Old New
  • 69. Thank You. L E A N E N T E R P R I S E
  • 70. Places to look for waste • Over-production • Waiting time • Transportation • Processing • Inventory • Motion • Scrap
  • 71. Setup Time Drives Batch Size: The Economic Order Quantities (EOQ) model determines the most economic lot/batch size for a production run. Fixed Cost Increasing Lot/Batch Size EOQ Changeover Cost Inventory Carrying Cost Changeover Cost + Inventory Carrying Cost Variable Cost