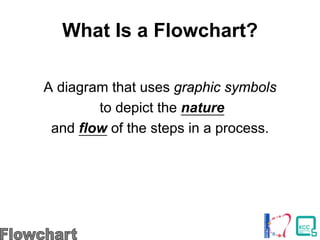
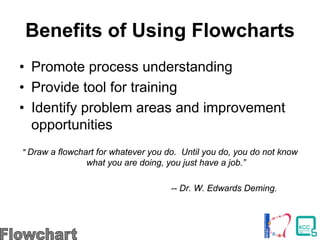
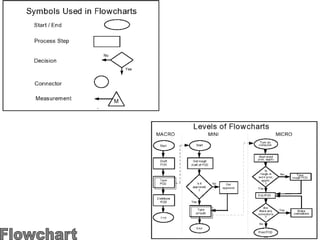
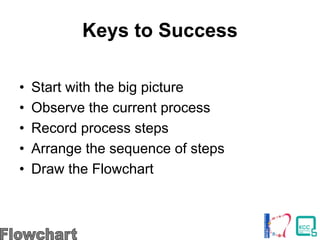
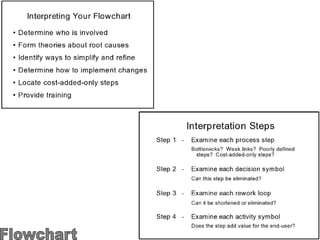
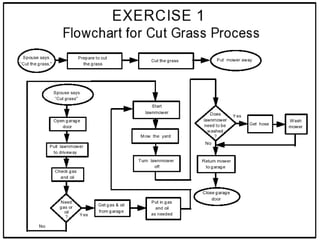
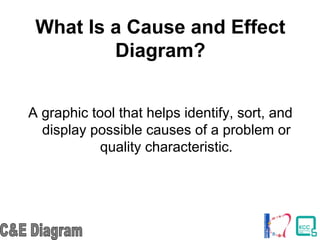
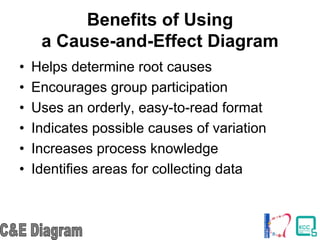
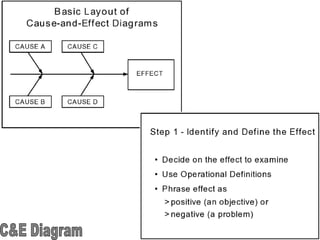
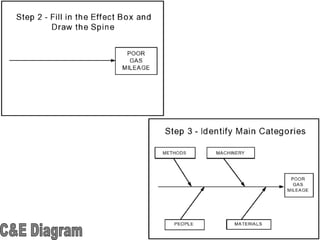
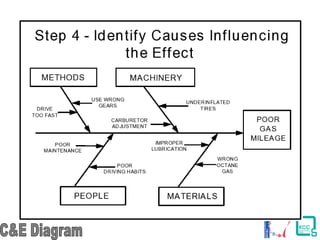
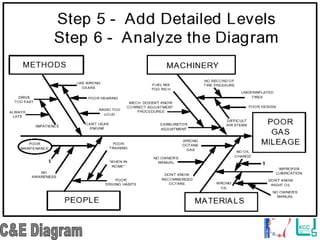
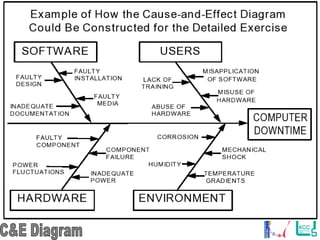
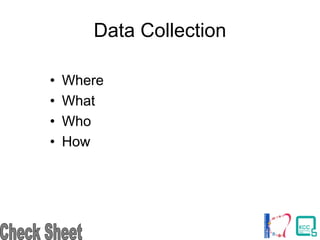
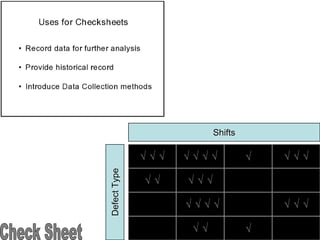
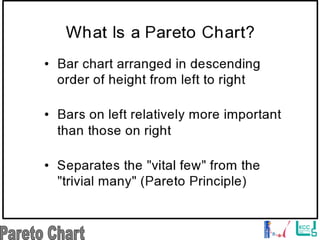
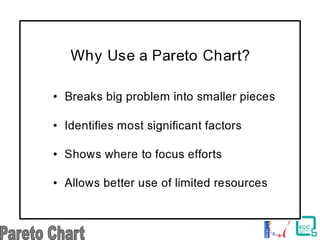
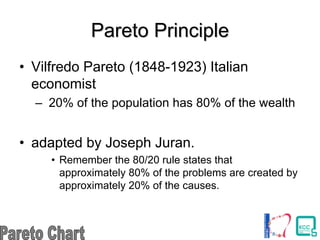
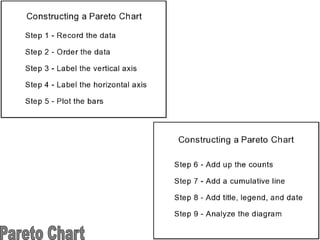
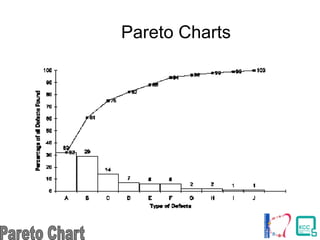
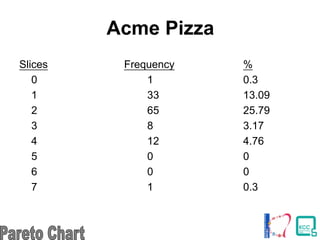
The document discusses the 7 quality tools including flow charts, cause-and-effect diagrams, and Pareto charts. It explains that Kaoru Ishikawa developed the basic 7 tools to make statistical analysis more accessible. Flow charts map out process steps to identify problems and improvements. Cause-and-effect diagrams help determine root causes of issues through a graphical format. Pareto charts illustrate the 80/20 rule where 20% of causes create 80% of problems. The tools provide visual aids to improve understanding of processes, collect relevant data, and identify areas for enhancements.


![7 qc tools[1] to print](https://cdn.slidesharecdn.com/ss_thumbnails/7qctools1toprint-191017092858-thumbnail.jpg?width=640&height=640&fit=bounds)


