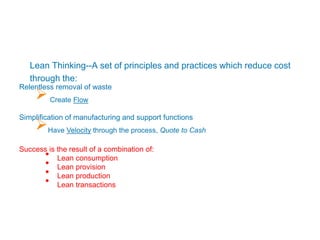
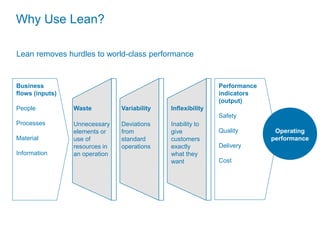
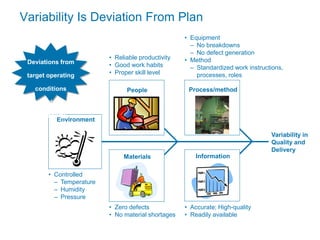
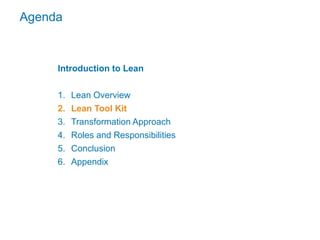
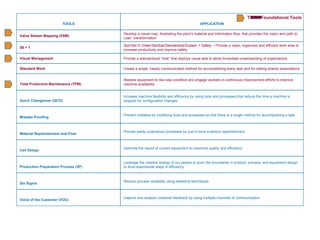
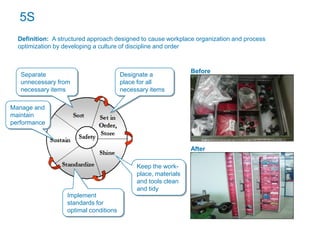
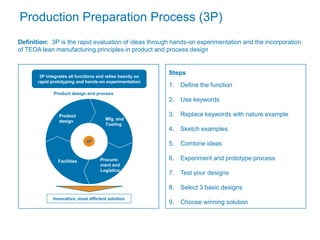
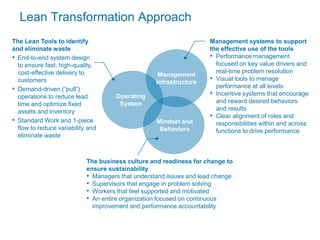
Overall Introduction to Lean
Linking Operational Levers to Performance Improvements
Learning Objectives
At the end of this session you will be able to:
• Explain the purpose of the global Lean
• Describe the Lean approach to performance transformation
Agenda
Introduction to TEOA
1. Lean Overview
2. Lean Tool Kit
3. Transformation Approach
4. Roles and Responsibilities
5. Conclusion
6. Appendix
Lean Thinking--A set of principles and practices which reduce cost
through the:
Relentless removal of waste
Create Flow
Simplification of manufacturing and support functions
Have Velocity through the process, Quote to Cash
Success is the result of a combination of:
• Lean consumption
• Lean provision
• Lean production
• Lean transactions
What is Lean?
Performance
indicators
(output)
Safety
Quality
Delivery
Cost
Business
flows (inputs)
People
Processes
Material
Information
Waste
Unnecessary
elements or
use of
resources in
an operation
Inflexibility
Inability to
give
customers
exactly
what they
want
Variability
Deviations
from
standard
operations
Operating
performance
Why Use Lean?
Lean removes hurdles to world-class performance
Defects
Over production
Transportation
Waiting
Inventory
Motion
Processing (Non-value Adding)
+ Unused Employee Creativity
There are 8 common types of waste
present in a production system:
Defects
Transporta-
tion
Over
production
Waiting
Motion
Unused
Employee
Creativity
Inventory
Processing
(NVA)
Waste
Waste Is A Non-Value Added Activity*
*Non-Value Added activities are those the customer is not willing to pay for
Variability Is Deviation From Plan
Variability in
Quality and
Delivery
• Reliable productivity
• Good work habits
• Proper skill level
• Equipment
– No breakdowns
– No defect generation
• Method
– Standardized work instructions,
processes, roles
• Zero defects
• No material shortages
• Accurate; High-quality
• Readily available
• Controlled
– Temperature
– Humidity
– Pressure
Process/method
People
Materials Information
Environment
Deviations from
target operating
conditions
produce
variability
Capability
Inability to provide
the product or
service the
customer demands
Capacity
Inability to change
production volume to
meet customer demand
Changeover
Inability to change
between products to
meet customer
demand
There are 3 types of inflexibility that impact the performance of a system:
Inflexibility
adds cost but not
value to a system
Inflexibility Is Inability To Meet Demands
Agenda
Introduction to Lean
1. Lean Overview
2. Lean Tool Kit
3. Transformation Approach
4. Roles and Responsibilities
5. Conclusion
6. Appendix
TEOA Foundational Tools
TOOLS APPLICATION
Value Stream Mapping (VSM)
Develop a visual map, illustrating the plant’s material and information flow, that provides the vision and path to
Lean transformation
5S + 1
Sort/Set in Order/Sanitize/Standardize/Sustain + Safety – Provide a clean, organized and efficient work area to
increase productivity and improve safety
Visual Management Provide a standardized “look” that deploys visual aids to allow immediate understanding of expectations
Standard Work Create a single, clearly communicated method for accomplishing every task and for setting shared expectations
Total Productive Maintenance (TPM)
Restore equipment to like-new condition and engage workers in continuous improvement efforts to improve
machine availability
Quick Changeover (QCO)
Increase machine flexibility and efficiency by using tools and processes that reduce the time a machine is
stopped for configuration changes
Mistake Proofing
Prevent mistakes by modifying tools and processes so that there is a single method for accomplishing a task
Material Replenishment and Flow
Provide easily understood processes for just-in-time inventory replenishment
Cell Design
Optimize the layout of current equipment to maximize quality and efficiency
Production Preparation Process (3P)
Leverage the creative energy of our people to push the boundaries in product, process, and equipment design
to drive exponential leaps in efficiency
Six Sigma
Reduce process variability using statistical techniques
Voice of the Customer (VOC)
Capture and analyze customer feedback by using multiple channels of communication
5S
Definition: A structured approach designed to cause workplace organization and process
optimization by developing a culture of discipline and order
Before
Separate
unnecessary from
necessary items
Designate a
place for all
necessary items
Keep the work-
place, materials
and tools clean
and tidy
Implement
standards for
optimal conditions
Manage and
maintain
performance
After
Visual Management
Definition: A management system to focus attention on critical processes and activities and
communicate the status of key areas in “real time”
Communicate relevant
Production information . . .
. . . highlight areas of
waste
. . . correct and
mistake proof
Purpose of visual management
Example of visual signals
Standard Work
Definition: An agreed-upon set of work procedures that establish the best method and
sequence for each manufacturing process to produce at the customer demand rate (Takt)
Current Workers Loading
Takt
3 sec
1
2
1
0
1
2
3
Op A Op B Op C
Cycle
Time
Takt
3 sec
2
2
0
1
2
3
Op A Op B
Cycle
Time
After rebalancing the load
Takt Time – “How often does a customer buy a product from us?”
Customer Demand
Available Time
=
Capture work
instructions and
staffing plan
Definition: A program designed to maximize the available time of all machines and equipment at the
lowest total life cycle cost
Total Productive Maintenance (TPM )
TPM
Worker
involvement
Top
management
support
Monitor Overall
Equipment
Effectiveness
• Introduce a comprehensive measure to track
machine availability losses and prioritize
opportunities
1
Rely on
autonomous
maintenance
• Instill a sense of ownership in workers to
maintain their machines
• Make full use of worker knowledge
2
Streamline the
repair process
• Standardize the repair process and improve
efficiency by eliminating waste
3
Deploy
preventive
maintenance
• Prioritize planned maintenance
• Preserve specialist skills for
complex tasks
4
Build capabilities • Technical training
• Problem solving and teamwork training
5
Quick Changeover (QCO)
Definition: An operating technique that systematically reduces and eliminates the time and skill level
required to set-up a piece of equipment, tool or process in order to produce small quantities with a high
quality output at an economical cost
Steps to QCO
• Study the changeover process to separate setup steps that occur while the machine is stopped from
those that occur while the machine is running
• Take advantage of machine auto time; perform as much setup work as possible while the machine is
still running
Well planned and executed changeovers
increase the chances to win the race
A motor racing
pit stop!
Mistake Proofing
Definition: The design of a product or process so that mistakes are at best, impossible to
make or at least, easily detected and corrected
Mistake
proof level
Feedback to error
originator
Reduction
effect
• End-of-line • None
• Discovers
defects
• In-process • May be slow, after at
least 1 defect
• Reduces
defects
• Self-check –
certified
workers
• Immediate feedback,
possibly 1 defect
• Reduces
defects
• Certified
processes
• Eliminates
defects
• Immediate feedback,
no defects because
error source is
eliminated
Where in the Process How in the Process
This
improvement
prevents from
accidentally
mounting a
spindle
backwards
• Limit Switches
• Proximity Sensors
• Scales
• Push Bars
• Vision Systems
Work
(correct)
Mistake
proofing
Material Replenishment and Flow
Definition: Behaviors, part routings, and inventory control rules to ensure we meet customer
demand while minimizing inventory and working capital
Card Container
Light
Ball
Traditional Path to Just-in-Time Production Implementing Pull System
1. Batch 2. Flow 3. Takt 4. Pull
Continuous flow
processing
1-piece flow production
Materials Finished
products
A C
B
Takt Time
Synchronized
processing time
Pull system
Linking processes/
control of flow
Pro-
duction
kanban
A
With-
drawal
kanban
A
_______
_
kanban
A
Previous
process
Follow-
ing
process
A
D
C
B
"production" kanban "withdrawal" kanban
supplying
process
Supermarket
product product
Cell Design
Definition: The design of a manufacturing cell layout around a product or narrow range of
products to capture improvement opportunities
Fishbone Linear “U”-Shaped Parallel
A
B
C
D
E
F
Continuous flow
A
C
A
B B
C
Maximized flexibility and motion economy
• Immediate
feedback
• Reduced
inventory
• Reduced
floor space
• Clear production
status (short/full)
• Reduced floor space
• Increased worker flexibility
across operations
• Reduced floor space
• Good for pair product
production
Assembly
Classic Cell Layouts
B G
H
A
Production Preparation Process (3P)
Definition: 3P is the rapid evaluation of ideas through hands-on experimentation and the incorporation
of TEOA lean manufacturing principles in product and process design
1. Define the function
2. Use keywords
3. Replace keywords with nature example
4. Sketch examples
5. Combine ideas
6. Experiment and prototype process
7. Test your designs
8. Select 3 basic designs
9. Choose winning solution
Steps
3P integrates all functions and relies heavily on
rapid prototyping and hands-on experimentation
Innovative, most efficient solution
Product design and process
Mfg. and
Tooling
Procure-
ment and
Logistics
Facilities
Product
design
3P
Six Sigma
Definition: Six Sigma uses statistical and analytical tools to identify and reduce variation
ensuring process capability and stability
Voice of the Customer (VOC)
Definition: A simple customer input technique for suppliers to capture qualitative evaluations of their
performance (for example cost, quality, schedule, delivery)
Qualitative survey
Agenda
Introduction to Lean
1. Lean Overview
2. Lean Tool Kit
3. Transformation Approach
4. Roles and Responsibilities
5. Conclusion
6. Appendix
Lean Transformation Approach
Operating
System
Management
Infrastructure
Mindset and
Behaviors
The Lean Tools to identify
and eliminate waste
• End-to-end system design
to ensure fast, high-quality,
cost-effective delivery to
customers
• Demand-driven (“pull”)
operations to reduce lead
time and optimize fixed
assets and inventory
• Standard Work and 1-piece
flow to reduce variability and
eliminate waste
Management systems to support
the effective use of the tools
• Performance management
focused on key value drivers and
real-time problem resolution
• Visual tools to manage
performance at all levels
• Incentive systems that encourage
and reward desired behaviors
and results
• Clear alignment of roles and
responsibilities within and across
functions to drive performance
The business culture and readiness for change to
ensure sustainability
• Managers that understand issues and lead change
• Supervisors that engage in problem solving
• Workers that feel supported and motivated
• An entire organization focused on continuous
improvement and performance accountability
Transformation Phases
TEOA tools introduced and sustained through a structured, standard deployment
Implement Sustain
Prepare
Diagnose and
Design
• Communicate
with staff
• Gather plant
metrics
• Establish
baseline
performance
metrics
• Capture the plant’s
current state
• Analyze the
current state
• Design the
targeted future
state
• Create
deployment plans
• Introduce Lean
foundational
tools first to
stabilize
• Streamline
operations and
continue driving
performance
metrics using
the full suite of
Lean tools
• Re-evaluate
value stream
map and current
metrics to define
new levels of
performance
• Continue to
leverage Lean
tools and pinpoint
areas to improve
on a day-to-day
basis
Prepare Phase
Implement Sustain
Prepare Diagnose and Design
Safety Inventory
Quality Plant-specific
data
Delivery Cost
Collect Site Data Baseline Site Performance
Total
productivity
improvement
Total production cost in factory
(labor [direct and indirect] + fixed +
consumables + variable + transfer)
Total standard hours earned
=
$ 76
$ 83
$ 82
$ 86
$ 76
$ 79
$ 71
$ 72
$ 64
$ 62
0
10
20
30
40
50
60
70
80
90
FY 08
May
FY 05 FY 06 FY 07 FY 08
Oct
FY 08
Nov
FY 08
Dec
FY 08
Jan
FY 08
Feb
FY 08
Mar
$ 70
FY 08
Apr
+6%
$ / hr
Diagnose and Design Phase
Implement Sustain
Prepare Diagnose and Design
Demand
analysis
Product
segmen-
tation
Map volume
and
variability
Understand
product
families
Current
state value
stream
Capacity
analysis
Inventory
analysis
Supplier
analysis
Future
State
Design
Deploy-
ment plan
Map
current
process
Size
process
capacity
Analyze
inventory
levels
Evaluate
supplier
risk on
system
Design
the
system
future
state
Capture all
improve-
ment
projects
with an
integrated
plan
Implement Sustain
Prepare Diagnose and Design
Implement Phase
TEOA tools Description and purpose
1. VSM
2. 5S +1
3. Visual Factory
4. Standard Work
5. TPM
6. Quick Change Over
7. Mistake Proofing
8. Material Replenishment and Flow
9. Cell Design
10. 3P
11. Six Sigma
12. Voice of the Customer
1. Create an end-to-end picture of the system
2. Increase workplace organization efficiency
3. Deploy visual workplace and visual performance metrics
4. Increase labor and machine efficiency, setting accountability
5. Increase machine availability
6. Increase machine availability and flexibility
7. Prevent mistakes and ensure quality
8. Manage lead-time, reducing inventory
9. Optimize layout of equipment to capture opportunities
10. Push current thinking on product and process design
11. Reduce process variability using statistical techniques
12. Capture and analyze customer feedback
Sustain Phase
Sustain
Prepare Diagnose and Design Implement
• Empower Workforce
• Set performance targets and assess performance using the lean Assessment Tool
on a regular basis
• Track value stream and site metrics
• Supervision uses shift “GO Meetings” to pursue root cause corrective actions with
the workforce and drive continuous improvement
• Develop a performance culture entrenched in Continuous Improvement
Note: “GO Meetings = Getting Organized”
Elements of Phase
Tracking Progress
Definition: Every team (or appropriate department) measures performance on a
frequent basis and compares to their team targets
5S + 1
Scorecard - cross-team view
Safety (Days incident free) Escapes (ppm)
as of: June 20, 2008
All teams
Scrap (%) Adherence to schedule (%)
Productivity (%) Inventory (DIOH)
0
0.5
1
1.5
1
0
0.5
1
1.5
1
0
20
40
60
80
100
Team
1
Team
2
Team
3
Team
4
Team
5
Team
6
Team
7
0%
20%
40%
60%
80%
100%
T
e
a
m
1
T
e
a
m
2
T
e
a
m
3
T
e
a
m
4
T
e
a
m
5
T
e
a
m
6
T
e
a
m
7
0%
1%
1%
2%
2%
3%
3%
Team
1
Team
2
Team
3
Team
4
Team
5
Team
6
Team
7
0.0%
10.0%
20.0%
30.0%
40.0%
50.0%
T
e
a
m
1
T
e
a
m
2
T
e
a
m
3
T
e
a
m
4
T
e
a
m
5
T
e
a
m
6
T
e
a
m
7
0
50
100
150
200
Team
1
Team
2
Team
3
Team
4
Team
5
Team
6
Team
7
0
50
100
150
200
250
Team
1
Team
2
Team
3
Team
4
Team
5
Team
6
Team
7
0
1
2
3
4
5
Team
1
Team
2
Team
3
Team
4
Team
5
Team
6
Team
7
Performance
Metrics tracking
is key to initiate
and sustain a
culture of
continuous
improvement
Agenda
Introduction to Lean
1. Lean Overview
2. Lean Tool Kit
3. Transformation Approach
4. Roles and Responsibilities
5. Conclusion
6. Appendix
Hierarchy Structure
Leadership
Practitioner
Kaizen
Facilitator
Participant
These Roles
will be
responsible
to support
the Lean
Evolution
Lean
The Practitioner Role
• The Practitioner is the site and / or organization
leader responsible for driving the deployment of
Lean Activities across their responsible portion
of the business
–Full time position
–Combines personal and technical leadership
skills
–Integrated with all Continuous Improvement
efforts
The Kaizen Facilitator Role
• The Kaizen Facilitator is the individual who is
responsible for facilitating the Kaizen Events
listed on the deployment plan. This person
should work closely with the Business Unit
Practitioner and assigned Champion.
Agenda
Introduction to lean
1. lean Overview
2. lean Tool Kit
3. Transformation Approach
4. Roles and Responsibilities
5. Conclusion
6. Appendix
Lean is about Velocity
“Inventory is fear”
-Michael Dell
• There are 13 tools of TEOA, designed to identify and eliminate waste
• There are 4 phases to a transformation
– Prepare
– Diagnose
– Implement
– Sustain
• The Star levels are determined by the minimum performance level of tool deployment and
business performance against preset thresholds
Agenda
Introduction to lean
1. lean Overview
2. lean Tool Kit
3. Transformation Approach
4. Roles and Responsibilities
5. Conclusion
6. Appendix

Lean Introduction.pptx

  • 1.
    Overall Introduction toLean Linking Operational Levers to Performance Improvements
  • 2.
    Learning Objectives At theend of this session you will be able to: • Explain the purpose of the global Lean • Describe the Lean approach to performance transformation
  • 3.
    Agenda Introduction to TEOA 1.Lean Overview 2. Lean Tool Kit 3. Transformation Approach 4. Roles and Responsibilities 5. Conclusion 6. Appendix
  • 4.
    Lean Thinking--A setof principles and practices which reduce cost through the: Relentless removal of waste Create Flow Simplification of manufacturing and support functions Have Velocity through the process, Quote to Cash Success is the result of a combination of: • Lean consumption • Lean provision • Lean production • Lean transactions What is Lean?
  • 5.
    Performance indicators (output) Safety Quality Delivery Cost Business flows (inputs) People Processes Material Information Waste Unnecessary elements or useof resources in an operation Inflexibility Inability to give customers exactly what they want Variability Deviations from standard operations Operating performance Why Use Lean? Lean removes hurdles to world-class performance
  • 6.
    Defects Over production Transportation Waiting Inventory Motion Processing (Non-valueAdding) + Unused Employee Creativity There are 8 common types of waste present in a production system: Defects Transporta- tion Over production Waiting Motion Unused Employee Creativity Inventory Processing (NVA) Waste Waste Is A Non-Value Added Activity* *Non-Value Added activities are those the customer is not willing to pay for
  • 7.
    Variability Is DeviationFrom Plan Variability in Quality and Delivery • Reliable productivity • Good work habits • Proper skill level • Equipment – No breakdowns – No defect generation • Method – Standardized work instructions, processes, roles • Zero defects • No material shortages • Accurate; High-quality • Readily available • Controlled – Temperature – Humidity – Pressure Process/method People Materials Information Environment Deviations from target operating conditions produce variability
  • 8.
    Capability Inability to provide theproduct or service the customer demands Capacity Inability to change production volume to meet customer demand Changeover Inability to change between products to meet customer demand There are 3 types of inflexibility that impact the performance of a system: Inflexibility adds cost but not value to a system Inflexibility Is Inability To Meet Demands
  • 9.
    Agenda Introduction to Lean 1.Lean Overview 2. Lean Tool Kit 3. Transformation Approach 4. Roles and Responsibilities 5. Conclusion 6. Appendix
  • 10.
    TEOA Foundational Tools TOOLSAPPLICATION Value Stream Mapping (VSM) Develop a visual map, illustrating the plant’s material and information flow, that provides the vision and path to Lean transformation 5S + 1 Sort/Set in Order/Sanitize/Standardize/Sustain + Safety – Provide a clean, organized and efficient work area to increase productivity and improve safety Visual Management Provide a standardized “look” that deploys visual aids to allow immediate understanding of expectations Standard Work Create a single, clearly communicated method for accomplishing every task and for setting shared expectations Total Productive Maintenance (TPM) Restore equipment to like-new condition and engage workers in continuous improvement efforts to improve machine availability Quick Changeover (QCO) Increase machine flexibility and efficiency by using tools and processes that reduce the time a machine is stopped for configuration changes Mistake Proofing Prevent mistakes by modifying tools and processes so that there is a single method for accomplishing a task Material Replenishment and Flow Provide easily understood processes for just-in-time inventory replenishment Cell Design Optimize the layout of current equipment to maximize quality and efficiency Production Preparation Process (3P) Leverage the creative energy of our people to push the boundaries in product, process, and equipment design to drive exponential leaps in efficiency Six Sigma Reduce process variability using statistical techniques Voice of the Customer (VOC) Capture and analyze customer feedback by using multiple channels of communication
  • 11.
    5S Definition: A structuredapproach designed to cause workplace organization and process optimization by developing a culture of discipline and order Before Separate unnecessary from necessary items Designate a place for all necessary items Keep the work- place, materials and tools clean and tidy Implement standards for optimal conditions Manage and maintain performance After
  • 12.
    Visual Management Definition: Amanagement system to focus attention on critical processes and activities and communicate the status of key areas in “real time” Communicate relevant Production information . . . . . . highlight areas of waste . . . correct and mistake proof Purpose of visual management Example of visual signals
  • 13.
    Standard Work Definition: Anagreed-upon set of work procedures that establish the best method and sequence for each manufacturing process to produce at the customer demand rate (Takt) Current Workers Loading Takt 3 sec 1 2 1 0 1 2 3 Op A Op B Op C Cycle Time Takt 3 sec 2 2 0 1 2 3 Op A Op B Cycle Time After rebalancing the load Takt Time – “How often does a customer buy a product from us?” Customer Demand Available Time = Capture work instructions and staffing plan
  • 14.
    Definition: A programdesigned to maximize the available time of all machines and equipment at the lowest total life cycle cost Total Productive Maintenance (TPM ) TPM Worker involvement Top management support Monitor Overall Equipment Effectiveness • Introduce a comprehensive measure to track machine availability losses and prioritize opportunities 1 Rely on autonomous maintenance • Instill a sense of ownership in workers to maintain their machines • Make full use of worker knowledge 2 Streamline the repair process • Standardize the repair process and improve efficiency by eliminating waste 3 Deploy preventive maintenance • Prioritize planned maintenance • Preserve specialist skills for complex tasks 4 Build capabilities • Technical training • Problem solving and teamwork training 5
  • 15.
    Quick Changeover (QCO) Definition:An operating technique that systematically reduces and eliminates the time and skill level required to set-up a piece of equipment, tool or process in order to produce small quantities with a high quality output at an economical cost Steps to QCO • Study the changeover process to separate setup steps that occur while the machine is stopped from those that occur while the machine is running • Take advantage of machine auto time; perform as much setup work as possible while the machine is still running Well planned and executed changeovers increase the chances to win the race A motor racing pit stop!
  • 16.
    Mistake Proofing Definition: Thedesign of a product or process so that mistakes are at best, impossible to make or at least, easily detected and corrected Mistake proof level Feedback to error originator Reduction effect • End-of-line • None • Discovers defects • In-process • May be slow, after at least 1 defect • Reduces defects • Self-check – certified workers • Immediate feedback, possibly 1 defect • Reduces defects • Certified processes • Eliminates defects • Immediate feedback, no defects because error source is eliminated Where in the Process How in the Process This improvement prevents from accidentally mounting a spindle backwards • Limit Switches • Proximity Sensors • Scales • Push Bars • Vision Systems Work (correct) Mistake proofing
  • 17.
    Material Replenishment andFlow Definition: Behaviors, part routings, and inventory control rules to ensure we meet customer demand while minimizing inventory and working capital Card Container Light Ball Traditional Path to Just-in-Time Production Implementing Pull System 1. Batch 2. Flow 3. Takt 4. Pull Continuous flow processing 1-piece flow production Materials Finished products A C B Takt Time Synchronized processing time Pull system Linking processes/ control of flow Pro- duction kanban A With- drawal kanban A _______ _ kanban A Previous process Follow- ing process A D C B "production" kanban "withdrawal" kanban supplying process Supermarket product product
  • 18.
    Cell Design Definition: Thedesign of a manufacturing cell layout around a product or narrow range of products to capture improvement opportunities Fishbone Linear “U”-Shaped Parallel A B C D E F Continuous flow A C A B B C Maximized flexibility and motion economy • Immediate feedback • Reduced inventory • Reduced floor space • Clear production status (short/full) • Reduced floor space • Increased worker flexibility across operations • Reduced floor space • Good for pair product production Assembly Classic Cell Layouts B G H A
  • 19.
    Production Preparation Process(3P) Definition: 3P is the rapid evaluation of ideas through hands-on experimentation and the incorporation of TEOA lean manufacturing principles in product and process design 1. Define the function 2. Use keywords 3. Replace keywords with nature example 4. Sketch examples 5. Combine ideas 6. Experiment and prototype process 7. Test your designs 8. Select 3 basic designs 9. Choose winning solution Steps 3P integrates all functions and relies heavily on rapid prototyping and hands-on experimentation Innovative, most efficient solution Product design and process Mfg. and Tooling Procure- ment and Logistics Facilities Product design 3P
  • 20.
    Six Sigma Definition: SixSigma uses statistical and analytical tools to identify and reduce variation ensuring process capability and stability
  • 21.
    Voice of theCustomer (VOC) Definition: A simple customer input technique for suppliers to capture qualitative evaluations of their performance (for example cost, quality, schedule, delivery) Qualitative survey
  • 22.
    Agenda Introduction to Lean 1.Lean Overview 2. Lean Tool Kit 3. Transformation Approach 4. Roles and Responsibilities 5. Conclusion 6. Appendix
  • 23.
    Lean Transformation Approach Operating System Management Infrastructure Mindsetand Behaviors The Lean Tools to identify and eliminate waste • End-to-end system design to ensure fast, high-quality, cost-effective delivery to customers • Demand-driven (“pull”) operations to reduce lead time and optimize fixed assets and inventory • Standard Work and 1-piece flow to reduce variability and eliminate waste Management systems to support the effective use of the tools • Performance management focused on key value drivers and real-time problem resolution • Visual tools to manage performance at all levels • Incentive systems that encourage and reward desired behaviors and results • Clear alignment of roles and responsibilities within and across functions to drive performance The business culture and readiness for change to ensure sustainability • Managers that understand issues and lead change • Supervisors that engage in problem solving • Workers that feel supported and motivated • An entire organization focused on continuous improvement and performance accountability
  • 24.
    Transformation Phases TEOA toolsintroduced and sustained through a structured, standard deployment Implement Sustain Prepare Diagnose and Design • Communicate with staff • Gather plant metrics • Establish baseline performance metrics • Capture the plant’s current state • Analyze the current state • Design the targeted future state • Create deployment plans • Introduce Lean foundational tools first to stabilize • Streamline operations and continue driving performance metrics using the full suite of Lean tools • Re-evaluate value stream map and current metrics to define new levels of performance • Continue to leverage Lean tools and pinpoint areas to improve on a day-to-day basis
  • 25.
    Prepare Phase Implement Sustain PrepareDiagnose and Design Safety Inventory Quality Plant-specific data Delivery Cost Collect Site Data Baseline Site Performance Total productivity improvement Total production cost in factory (labor [direct and indirect] + fixed + consumables + variable + transfer) Total standard hours earned = $ 76 $ 83 $ 82 $ 86 $ 76 $ 79 $ 71 $ 72 $ 64 $ 62 0 10 20 30 40 50 60 70 80 90 FY 08 May FY 05 FY 06 FY 07 FY 08 Oct FY 08 Nov FY 08 Dec FY 08 Jan FY 08 Feb FY 08 Mar $ 70 FY 08 Apr +6% $ / hr
  • 26.
    Diagnose and DesignPhase Implement Sustain Prepare Diagnose and Design Demand analysis Product segmen- tation Map volume and variability Understand product families Current state value stream Capacity analysis Inventory analysis Supplier analysis Future State Design Deploy- ment plan Map current process Size process capacity Analyze inventory levels Evaluate supplier risk on system Design the system future state Capture all improve- ment projects with an integrated plan
  • 27.
    Implement Sustain Prepare Diagnoseand Design Implement Phase TEOA tools Description and purpose 1. VSM 2. 5S +1 3. Visual Factory 4. Standard Work 5. TPM 6. Quick Change Over 7. Mistake Proofing 8. Material Replenishment and Flow 9. Cell Design 10. 3P 11. Six Sigma 12. Voice of the Customer 1. Create an end-to-end picture of the system 2. Increase workplace organization efficiency 3. Deploy visual workplace and visual performance metrics 4. Increase labor and machine efficiency, setting accountability 5. Increase machine availability 6. Increase machine availability and flexibility 7. Prevent mistakes and ensure quality 8. Manage lead-time, reducing inventory 9. Optimize layout of equipment to capture opportunities 10. Push current thinking on product and process design 11. Reduce process variability using statistical techniques 12. Capture and analyze customer feedback
  • 28.
    Sustain Phase Sustain Prepare Diagnoseand Design Implement • Empower Workforce • Set performance targets and assess performance using the lean Assessment Tool on a regular basis • Track value stream and site metrics • Supervision uses shift “GO Meetings” to pursue root cause corrective actions with the workforce and drive continuous improvement • Develop a performance culture entrenched in Continuous Improvement Note: “GO Meetings = Getting Organized” Elements of Phase
  • 29.
    Tracking Progress Definition: Everyteam (or appropriate department) measures performance on a frequent basis and compares to their team targets 5S + 1 Scorecard - cross-team view Safety (Days incident free) Escapes (ppm) as of: June 20, 2008 All teams Scrap (%) Adherence to schedule (%) Productivity (%) Inventory (DIOH) 0 0.5 1 1.5 1 0 0.5 1 1.5 1 0 20 40 60 80 100 Team 1 Team 2 Team 3 Team 4 Team 5 Team 6 Team 7 0% 20% 40% 60% 80% 100% T e a m 1 T e a m 2 T e a m 3 T e a m 4 T e a m 5 T e a m 6 T e a m 7 0% 1% 1% 2% 2% 3% 3% Team 1 Team 2 Team 3 Team 4 Team 5 Team 6 Team 7 0.0% 10.0% 20.0% 30.0% 40.0% 50.0% T e a m 1 T e a m 2 T e a m 3 T e a m 4 T e a m 5 T e a m 6 T e a m 7 0 50 100 150 200 Team 1 Team 2 Team 3 Team 4 Team 5 Team 6 Team 7 0 50 100 150 200 250 Team 1 Team 2 Team 3 Team 4 Team 5 Team 6 Team 7 0 1 2 3 4 5 Team 1 Team 2 Team 3 Team 4 Team 5 Team 6 Team 7 Performance Metrics tracking is key to initiate and sustain a culture of continuous improvement
  • 30.
    Agenda Introduction to Lean 1.Lean Overview 2. Lean Tool Kit 3. Transformation Approach 4. Roles and Responsibilities 5. Conclusion 6. Appendix
  • 31.
  • 32.
    The Practitioner Role •The Practitioner is the site and / or organization leader responsible for driving the deployment of Lean Activities across their responsible portion of the business –Full time position –Combines personal and technical leadership skills –Integrated with all Continuous Improvement efforts
  • 33.
    The Kaizen FacilitatorRole • The Kaizen Facilitator is the individual who is responsible for facilitating the Kaizen Events listed on the deployment plan. This person should work closely with the Business Unit Practitioner and assigned Champion.
  • 34.
    Agenda Introduction to lean 1.lean Overview 2. lean Tool Kit 3. Transformation Approach 4. Roles and Responsibilities 5. Conclusion 6. Appendix
  • 35.
    Lean is aboutVelocity “Inventory is fear” -Michael Dell • There are 13 tools of TEOA, designed to identify and eliminate waste • There are 4 phases to a transformation – Prepare – Diagnose – Implement – Sustain • The Star levels are determined by the minimum performance level of tool deployment and business performance against preset thresholds
  • 36.
    Agenda Introduction to lean 1.lean Overview 2. lean Tool Kit 3. Transformation Approach 4. Roles and Responsibilities 5. Conclusion 6. Appendix