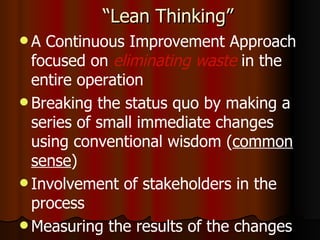
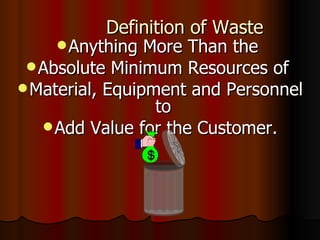
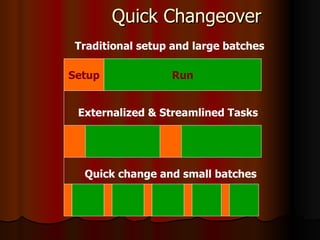
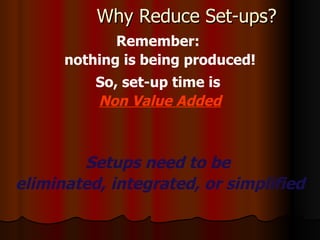
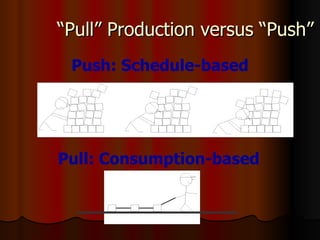
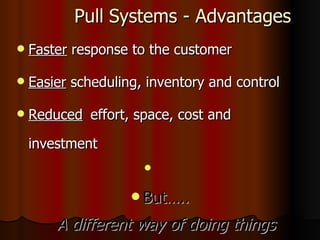
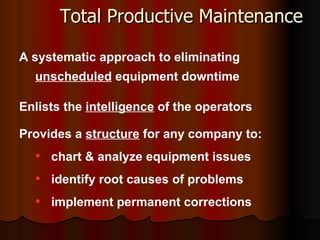
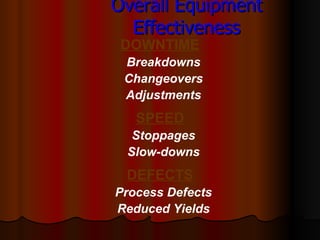
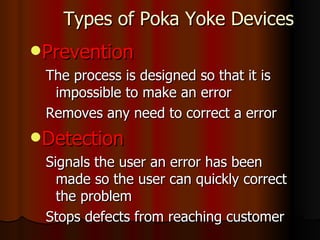
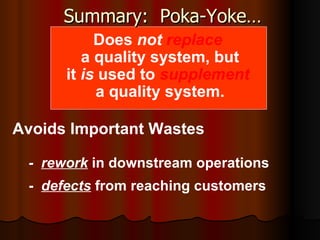
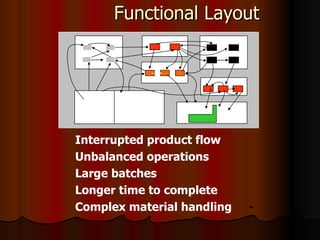
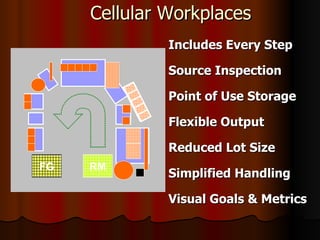
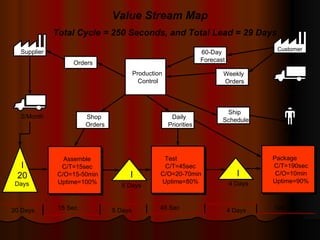
Lean Systems by  Sashi.Prabhu
Lean Systems The ability to make  exactly   what the  customer  wants as they  order  it.
Benefits:  Tangible  &  Intangible Improved Teamwork Simpler Scheduling Greater Flexibility Market Responsiveness Increased Sales 0   100 Lead Time Reduction Productivity Increase WIP Reduction Quality Improvement Space Utilization
Time & Cost Relationship “ The longer an article is in the process of manufacture and the more it is moved about,  the greater its ultimate cost.” --Henry Ford, 1926
History of Lean 1910-1928  Ford Production Systems 1942-46  Kaiser’s Liberty Ships  1970  Toyota Production System  1980  If Japan Can, Why Can’t We 1980  JIT, Cellular, TOC 1989  Machine That Changed the World 1995  Lean Enterprises 1998  Lean Service Organizations
“Lean Thinking” A Continuous Improvement Approach focused on  eliminating waste  in the  entire operation Breaking the status quo by making a series of small immediate changes using conventional wisdom ( common sense ) Involvement of stakeholders in the process Measuring the results of the changes  -
Definition of Waste Anything More Than the  Absolute Minimum Resources of  Material, Equipment and Personnel to  Add Value for the Customer.
Value Added  vs. Non-value Added Value Added transforms raw material, components and  information into sellable items Non-Value Added consumes resources but does not contribute directly to the value of sellable items. These should be eliminated, integrated, or simplified
Total Order Lead Time Breakdown Value Added Ratio   = 0  1  2  3  4  5 Elapsed  Time Value Added Time Elapsed Time VA NVA
Value Added Ratio Calculation Value Added Ratio   = 5 VA NVA 1.1 5.3 = 20.7 % 0  1  2  3  4  5 Elapsed  Time
The Eight Process Wastes Overproduction-Large  Batches Extra  Transportation   Excess  Inventory Employees  Waiting NVA  Processing Excess  Motion Defects &  Rework Underutilized  Brainpower
Eight Service Industry Wastes Errors  in documents Transport  of documents Doing  unnecessary  work not requested Waiting  for the next process step Process of getting  approvals Unnecessary  motions Backlog  in work queues Underutilized  employees
The Lean Toolbox
5 S’s Campaign Sort   Systematize   Spic & Span Standardize   Self –discipline.
With an Organized Workplace : Defects  are reduced Safety  is improved Workers  are more efficient Inventory  is reduced Maintenance  is improved Cleanup  time is minimized  -
Quick Changeover Traditional setup and large batches Setup Run Quick change and small batches Externalized & Streamlined Tasks
Why Reduce Set-ups? Remember:  nothing is being produced! So, set-up time is   Non Value Added Setups need to be  eliminated, integrated, or simplified
“Pull” Production versus “Push” Push: Schedule-based Pull: Consumption-based
Pull   Systems - Advantages Faster  response to the customer Easier  scheduling, inventory and control Reduced   effort, space, cost and investment But….. A different way of doing things
Total Productive Maintenance A systematic approach to eliminating  unscheduled  equipment downtime  Enlists the  intelligence  of the operators Provides a  structure  for any company to: chart & analyze equipment issues identify root causes of problems implement permanent corrections
Overall Equipment Effectiveness DOWNTIME Breakdowns Changeovers Adjustments SPEED Stoppages Slow-downs DEFECTS Process Defects Reduced Yields
Types of Poka Yoke Devices Prevention The process is designed so that it is impossible to make an error  Removes any need to correct a error Detection Signals the user an error has been made so the user can quickly correct the problem Stops defects from reaching customer
Summary:  Poka-Yoke… Does  not   replace   a quality system, but it  is  used to  supplement   a quality system. Avoids Important Wastes -  rework  in downstream operations -  defects  from reaching customers
Functional Layout Interrupted product flow Unbalanced operations Large batches Longer time to complete Complex material handling  -
Cellular Workplaces FG RM Includes Every Step Source Inspection Point of Use Storage Flexible Output Reduced Lot Size Simplified Handling Visual Goals & Metrics
Original Office Layout
Cellular Office Layout
Value Stream Mapping
Value Stream Map Supplier I  20 Days Driver 2/Month Daily Customer Assemble  C/T=15sec  C/O=15-50min  Uptime=100% Package  C/T=190sec  C/O=10min  Uptime=90% Test  C/T=45sec  C/O=20-70min  Uptime=80% I Total Cycle = 250 Seconds, and Total Lead = 29 Days Production  Control Orders Shop  Orders Ship  Schedule Daily  Priorities 60-Day  Forecast Weekly  Orders 4 Days I 5 Days 20 Days 4 Days 5 Days 15 Sec 45 Sec 190 Sec
Future State Goals Reduce  non-value added  activities Reduce  lead time Reduce  inventory  (especially WIP) Increase  throughput  (capacity) Reduced  batches  sizes Improve overall  productivity
Keys to Success Keep things  simple Focus on your  process   Look for all types of  waste Break old  habits Work through  mistakes When problems occur, be  flexible Keep improving— everyday   - 55
Share the mutual benefits of Decreasing Inventory and batch sizes Labor costs and overtime  Capital investments Increasing Customer response Productivity Flexibility Quality
Thanks very much

37022309 lean-simple-solutions

  • 1.
    Lean Systems by Sashi.Prabhu
  • 2.
    Lean Systems Theability to make exactly what the customer wants as they order it.
  • 3.
    Benefits: Tangible & Intangible Improved Teamwork Simpler Scheduling Greater Flexibility Market Responsiveness Increased Sales 0 100 Lead Time Reduction Productivity Increase WIP Reduction Quality Improvement Space Utilization
  • 4.
    Time & CostRelationship “ The longer an article is in the process of manufacture and the more it is moved about, the greater its ultimate cost.” --Henry Ford, 1926
  • 5.
    History of Lean1910-1928 Ford Production Systems 1942-46 Kaiser’s Liberty Ships 1970 Toyota Production System 1980 If Japan Can, Why Can’t We 1980 JIT, Cellular, TOC 1989 Machine That Changed the World 1995 Lean Enterprises 1998 Lean Service Organizations
  • 6.
    “Lean Thinking” AContinuous Improvement Approach focused on eliminating waste in the entire operation Breaking the status quo by making a series of small immediate changes using conventional wisdom ( common sense ) Involvement of stakeholders in the process Measuring the results of the changes -
  • 7.
    Definition of WasteAnything More Than the Absolute Minimum Resources of Material, Equipment and Personnel to Add Value for the Customer.
  • 8.
    Value Added vs. Non-value Added Value Added transforms raw material, components and information into sellable items Non-Value Added consumes resources but does not contribute directly to the value of sellable items. These should be eliminated, integrated, or simplified
  • 9.
    Total Order LeadTime Breakdown Value Added Ratio = 0 1 2 3 4 5 Elapsed Time Value Added Time Elapsed Time VA NVA
  • 10.
    Value Added RatioCalculation Value Added Ratio = 5 VA NVA 1.1 5.3 = 20.7 % 0 1 2 3 4 5 Elapsed Time
  • 11.
    The Eight ProcessWastes Overproduction-Large Batches Extra Transportation Excess Inventory Employees Waiting NVA Processing Excess Motion Defects & Rework Underutilized Brainpower
  • 12.
    Eight Service IndustryWastes Errors in documents Transport of documents Doing unnecessary work not requested Waiting for the next process step Process of getting approvals Unnecessary motions Backlog in work queues Underutilized employees
  • 13.
  • 14.
    5 S’s CampaignSort Systematize Spic & Span Standardize Self –discipline.
  • 15.
    With an OrganizedWorkplace : Defects are reduced Safety is improved Workers are more efficient Inventory is reduced Maintenance is improved Cleanup time is minimized -
  • 16.
    Quick Changeover Traditionalsetup and large batches Setup Run Quick change and small batches Externalized & Streamlined Tasks
  • 17.
    Why Reduce Set-ups?Remember: nothing is being produced! So, set-up time is Non Value Added Setups need to be eliminated, integrated, or simplified
  • 18.
    “Pull” Production versus“Push” Push: Schedule-based Pull: Consumption-based
  • 19.
    Pull Systems - Advantages Faster response to the customer Easier scheduling, inventory and control Reduced effort, space, cost and investment But….. A different way of doing things
  • 20.
    Total Productive MaintenanceA systematic approach to eliminating unscheduled equipment downtime Enlists the intelligence of the operators Provides a structure for any company to: chart & analyze equipment issues identify root causes of problems implement permanent corrections
  • 21.
    Overall Equipment EffectivenessDOWNTIME Breakdowns Changeovers Adjustments SPEED Stoppages Slow-downs DEFECTS Process Defects Reduced Yields
  • 22.
    Types of PokaYoke Devices Prevention The process is designed so that it is impossible to make an error Removes any need to correct a error Detection Signals the user an error has been made so the user can quickly correct the problem Stops defects from reaching customer
  • 23.
    Summary: Poka-Yoke…Does not replace a quality system, but it is used to supplement a quality system. Avoids Important Wastes - rework in downstream operations - defects from reaching customers
  • 24.
    Functional Layout Interruptedproduct flow Unbalanced operations Large batches Longer time to complete Complex material handling -
  • 25.
    Cellular Workplaces FGRM Includes Every Step Source Inspection Point of Use Storage Flexible Output Reduced Lot Size Simplified Handling Visual Goals & Metrics
  • 26.
  • 27.
  • 28.
  • 29.
    Value Stream MapSupplier I 20 Days Driver 2/Month Daily Customer Assemble C/T=15sec C/O=15-50min Uptime=100% Package C/T=190sec C/O=10min Uptime=90% Test C/T=45sec C/O=20-70min Uptime=80% I Total Cycle = 250 Seconds, and Total Lead = 29 Days Production Control Orders Shop Orders Ship Schedule Daily Priorities 60-Day Forecast Weekly Orders 4 Days I 5 Days 20 Days 4 Days 5 Days 15 Sec 45 Sec 190 Sec
  • 30.
    Future State GoalsReduce non-value added activities Reduce lead time Reduce inventory (especially WIP) Increase throughput (capacity) Reduced batches sizes Improve overall productivity
  • 31.
    Keys to SuccessKeep things simple Focus on your process Look for all types of waste Break old habits Work through mistakes When problems occur, be flexible Keep improving— everyday - 55
  • 32.
    Share the mutualbenefits of Decreasing Inventory and batch sizes Labor costs and overtime Capital investments Increasing Customer response Productivity Flexibility Quality
  • 33.

Editor's Notes

  • #10 Describe… This represents a 20% ratio, nationally, the ratio is commonly 5-10 % depending upon which industry we’re analyzing. Next, let’s look at the Wastes that are clogging the arteries of the factory operations
  • #11 Describe… This represents a 20% ratio, nationally, the ratio is commonly 5-10 % depending upon which industry we’re analyzing. Next, let’s look at the Wastes that are clogging the arteries of the factory operations
  • #12 Overproduce—Slow down the machine, off the shelf (got to stock the shelf) Waiting—downtime, balance, changeover, Transport—physical relocation eliminates most if not all.
  • #14 Now, Push is the alternative, but since we have that now, let’s discuss PULL PRODUCTION SYSTEMS
  • #16 Overproduce—Slow down the machine, off the shelf (got to stock the shelf) Waiting—downtime, balance, changeover, Transport—physical relocation eliminates most if not all.
  • #19 Slide - PUSH VS. PULL A concept or topic that is always mentioned as part of Lean or associated with Lean, is this idea of a Pull System. So now I’d like to talk a little about what we mean by a pull system versus a push system. I have a few slides to go over this push versus pull idea; however, I feel that this title page kind of explains it all. In push production you make large batches and push them through the place to the next process. In pull production, you pull a controlled amount of WIP through the process. The operations are physically linked. ASK: Can anyone here relate to this fellow here? (Reference the PUSH view)
  • #25 Looks pretty well organized until we introduce the product into the mix…. CLK Now it looks about right— What do you see now that wasn’t apparent at first????
  • #26 Okay, here's the equipment layout that a Cell Design Kaizen Team. A U-shaped flow cycles from the Raw Material (RM) through the 8 Work-stations to the Finished Goods (FG). The cell works in a counter-clockwise U-shaped flow The next step is to populate the cell with raw materials, components, drums of coolant & cleaners. All in labeled containers. Now, we need access aisles all around the cell for material replenishment, equipment servicing and quicker changeovers. Main aisles on both ends of the cell allow for material flow and personnel flow between cells. We've right-sized the material containers, so we eventually run out of raw materials and the green diamond represents a Kanban Post that will play a vital role in material replenishment Now, the blue bin runs empty--no more parts--what happens next???? This rack on the backside of the cell contains a second set of components in a second set of labeled and right-sized containers. So the operator simply walks the side-aisle to the rack, picks up a new container of parts and puts it in the work-station But how do we get it replenished again?? Put the empty labeled bin on the Kanban Post and the Material Clerk who circulates throughout the shop will take the empty back and refill it before the backup container can be emptied....
  • #27 Okay, here's the equipment layout that a Cell Design Kaizen Team. A U-shaped flow cycles from the Raw Material (RM) through the 8 Work-stations to the Finished Goods (FG). The cell works in a counter-clockwise U-shaped flow The next step is to populate the cell with raw materials, components, drums of coolant & cleaners. All in labeled containers. Now, we need access aisles all around the cell for material replenishment, equipment servicing and quicker changeovers. Main aisles on both ends of the cell allow for material flow and personnel flow between cells. We've right-sized the material containers, so we eventually run out of raw materials and the green diamond represents a Kanban Post that will play a vital role in material replenishment Now, the blue bin runs empty--no more parts--what happens next???? This rack on the backside of the cell contains a second set of components in a second set of labeled and right-sized containers. So the operator simply walks the side-aisle to the rack, picks up a new container of parts and puts it in the work-station But how do we get it replenished again?? Put the empty labeled bin on the Kanban Post and the Material Clerk who circulates throughout the shop will take the empty back and refill it before the backup container can be emptied....
  • #28 Okay, here's the equipment layout that a Cell Design Kaizen Team. A U-shaped flow cycles from the Raw Material (RM) through the 8 Work-stations to the Finished Goods (FG). The cell works in a counter-clockwise U-shaped flow The next step is to populate the cell with raw materials, components, drums of coolant & cleaners. All in labeled containers. Now, we need access aisles all around the cell for material replenishment, equipment servicing and quicker changeovers. Main aisles on both ends of the cell allow for material flow and personnel flow between cells. We've right-sized the material containers, so we eventually run out of raw materials and the green diamond represents a Kanban Post that will play a vital role in material replenishment Now, the blue bin runs empty--no more parts--what happens next???? This rack on the backside of the cell contains a second set of components in a second set of labeled and right-sized containers. So the operator simply walks the side-aisle to the rack, picks up a new container of parts and puts it in the work-station But how do we get it replenished again?? Put the empty labeled bin on the Kanban Post and the Material Clerk who circulates throughout the shop will take the empty back and refill it before the backup container can be emptied....
  • #29 Now, Push is the alternative, but since we have that now, let’s discuss PULL PRODUCTION SYSTEMS
  • #30 Current Demand = 200,000/yr = 833/day Available Time = 1 Shift = 433m = 25,800s Takt Time = Avail Time/#units/day = 25,800s/833 units = 31 sec