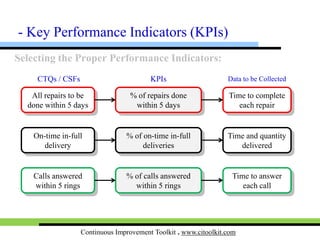
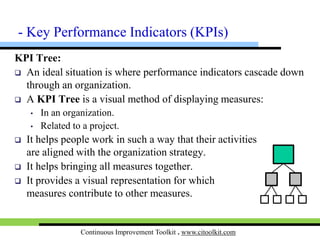
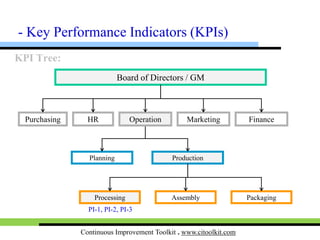
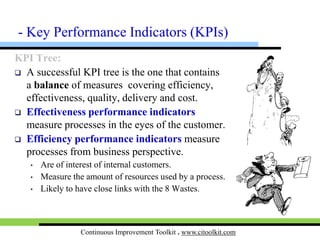
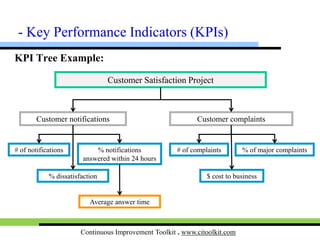
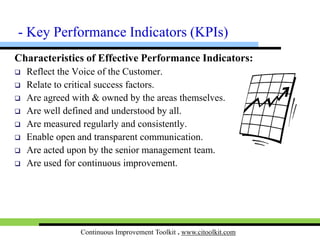
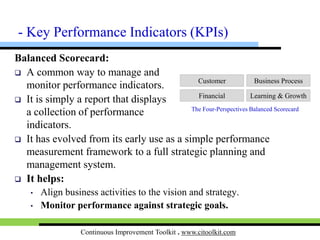
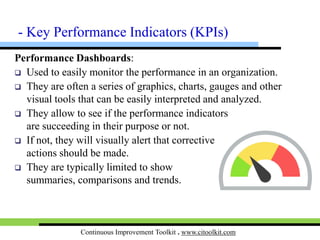
Continuous Improvement Toolkit . www.citoolkit.com
Continuous Improvement Toolkit
KPIs
(Key Performance Indicators)
Continuous Improvement Toolkit . www.citoolkit.com
Check Sheets
Data
Collection
Process MappingFlowcharting
Flow Process Charts
5S
Value Stream Mapping
Control Charts
Mistake Proofing
Tree Diagram*
Understanding
Performance
Fishbone Diagram
Design of Experiment
Implementing
Solutions**
Creating Ideas
Brainstorming Attribute Analysis
Deciding & Selecting
Decision Tree
Force Field Analysis Cost Benefit Analysis
Voting
Planning & Project Management*
Value Analysis
Kaizen Events
Quick Changeover
Managing
Risk
FMEA
PDPC
RAID Log*
Observations
Focus Groups
Understanding
Cause & Effect
Pareto Analysis
IDEF0
5 Whys
Matrix DiagramKano Analysis
KPIs
Lean Measures
Importance-Urgency Mapping
Waste Analysis
Fault Tree Analysis
Relationship Mapping*
Benchmarking**
SCAMPER**
C&E Matrix
Confidence Intervals
Pugh Matrix
SIPOC*
Prioritization Matrix
Stakeholder Analysis
Critical-to Tree
Paired Comparison
Improvement Roadmaps
Interviews
QFD
Graphical Analysis
Lateral Thinking
Hypothesis Testing
Visual Management
Ergonomics
Reliability Analysis
Cross Training
How-How Diagram**
Flow
Time Value Map
ANOVA
Gap Analysis*
Traffic Light Assessment
TPN Analysis
Decision Balance Sheet
Suggestion systems
Risk Assessment*
AutomationSimulation
Break-even Analysis
Service Blueprints
DMAIC
Process Redesign
Run Charts
TPM
Control Planning
Chi-Square
SWOT Analysis
Capability Indices
Policy Deployment
Data collection planner*
Affinity DiagramQuestionnaires
Probability Distributions
Bottleneck Analysis**
MSA
Descriptive Statistics
Cost of Quality*
Process Yield
Histograms & Boxplots
Just in Time
Pick Chart
Portfolio Matrix
Four Field Matrix
Root Cause Analysis Data Snooping
Morphological AnalysisSampling
Spaghetti Diagram
Pull
OEE
Mind Mapping*
Project Charter
PDCA
Designing & Analyzing Processes
CorrelationScatter Plots
Regression
Gantt Charts
Activity NetworksRACI Matrix
PERT/CPMDaily Planning
MOST
Standard work Document controlA3 Thinking
The Continuous Improvement Map
Multi vari Studies
Continuous Improvement Toolkit . www.citoolkit.com
Performance Management:
 An approach used to manage performance of an organization.
 It plays an important role in the success or failure of a business.
 It is applied to measure the performance of:
• An organization.
• A business unit.
• A single department.
• A project.
• A process that builds a product or service.
• An employee.
- KPIs
Continuous Improvement Toolkit . www.citoolkit.com
Performance Management:
 It includes activities such as:
• Planning and setting expectations.
• Developing the capacity to perform.
• Continually monitoring performance.
• Periodically rating performance in a summary
fashion.
• Rewarding good performance.
- KPIs
Continuous Improvement Toolkit . www.citoolkit.com
Performance Indicators:
 Measurements that define and assess the performance of an
organization, department, employee, etc..
 Objectives to be targeted in order to add the most value to a
business.
 Choosing the right performance indicators relies upon a good
understanding of what is important to the business.
- KPIs
Continuous Improvement Toolkit . www.citoolkit.com
Two Types:
 Result oriented indicators:
• Focus on the key outputs of a process.
• Related to the critical success factors.
• Examples: customer complaints
and return on investment (ROI).
 Process oriented indicators:
• Focus on the inputs to a process.
• Examples: time to process customer order
and late deliveries.
- KPIs
Business
Goals
KRIs, KPIs
RIs, PIs
Operational
Goals
Project
Goals
RIs, PIs
Continuous Improvement Toolkit . www.citoolkit.com
Performance Indicators are Used to:
 Help organizations to understand their performance levels.
 Help setting realistic performance goals.
 Help aligning daily work to strategic goals.
 Help monitoring progress on a real-time basis.
 Help understanding the weaknesses and
establishing improvement priorities.
 Determine whether an improvement is being made
and maintained.
 Help benchmark internally and externally.
 Identify if staff are doing well and to help them if they are not.
 Provide a basis for recognizing team and individual performance.
- KPIs
Continuous Improvement Toolkit . www.citoolkit.com
Selecting the Proper Performance Indicators:
 Performance indicators should be developed based on:
• Critical Success Factors (CSFs).
• Voice of the Customer (VOC).
- KPIs
Continuous Improvement Toolkit . www.citoolkit.com
Critical Success Factors:
 Elements that are necessary for a strategy to be successful.
 CSFs selection is a very subjective exercise.
 Examples of CSFs are:
• Delivery on-time and in-full.
• Providing superior customer service.
• Short time to market new products.
• Management commitment.
- KPIs
Continuous Improvement Toolkit . www.citoolkit.com
Voice of the Customer:
 Performance indicators should reflect the Voice of the
Customer.
 The Critical-to-Quality characteristics (CTQs) features of your
customer should be then used as the basis to select your KPIs.
 Raw data needs to be collected from customers.
- KPIs
Continuous Improvement Toolkit . www.citoolkit.com
Example - Selecting the Proper Performance Indicators:
- KPIs
All repairs to be
done within 5 days
% of repairs done
within 5 days
On-time in-full
delivery
% of on-time in-full
deliveries
Calls answered
within 5 rings
% of calls answered
within 5 rings
CTQs / CSFs KPIs Data to be Collected
Time to complete
each repair
Time and
quantity
delivered
Time to answer
each call
Continuous Improvement Toolkit . www.citoolkit.com
KPI Tree:
 A visual method of displaying measures:
• In an organization.
• Related to a project.
 Brings all measures together.
 Provides a visual representation for which
measures contribute to other measures.
 Helps aligning work with the organization strategy.
- KPIs
Continuous Improvement Toolkit . www.citoolkit.com
KPI Tree:
- KPIs
Purchasing
Board of Directors / GM
Marketing
Production
Processing
Planning
HR Operation Finance
Assembly Packaging
PI-1, PI-2, PI-3
Continuous Improvement Toolkit . www.citoolkit.com
KPI Tree Example:
- KPIs
Customer notifications
Customer Satisfaction Project
Customer complaints
% notifications
answered within 24 hours
% dissatisfaction $ cost to business
% of major complaints
Average answer time
# of complaints# of notifications
Continuous Improvement Toolkit . www.citoolkit.com
KPI Tree:
 A successful KPI tree is the one that contains
a balance of measures covering efficiency,
effectiveness, quality, delivery and cost.
 Effectiveness performance indicators
measure processes in the eyes of the customer.
 Efficiency performance indicators measure
processes from business perspective.
• Are of interest of internal customers.
• Have close links with the 8 Wastes.
- KPIs
Continuous Improvement Toolkit . www.citoolkit.com
Characteristics of Effective Performance Indicators:
 Reflect the Voice of the Customer.
 Relate to critical success factors.
 Are agreed with and owned by the areas themselves.
 Are well defined and understood by all.
 Are measured regularly and consistently.
 Enable open and transparent communication.
 Are acted upon by the senior management.
 Are used for continuous improvement.
- KPIs
Continuous Improvement Toolkit . www.citoolkit.com
Balanced Scorecard:
 A common way to manage and monitor performance indicators.
 A report that displays a collection of performance indicators.
 It has evolved from a simple performance measurement
framework to a full strategic planning and management system.
 It helps monitor performance against strategic goals.
- KPIs
Financial
Customer
Learning & Growth
Business Process
The Four-Perspectives Balanced Scorecard
Continuous Improvement Toolkit . www.citoolkit.com
Performance Dashboards:
 A series of graphics, charts and other visual tools that can be
easily interpreted and analyzed.
 Easily monitor the performance in an organization.
 They allow to see if the performance indicators
are being met based on the goals in place.
 If not, they will visually alert that corrective
actions should be made.
 They are typically limited to show
summaries, comparisons and trends.
- KPIs
Continuous Improvement Toolkit . www.citoolkit.com
A Good Dashboard:
 Is simple and easy to understand.
 Conveys important information at a glance.
 Contains minimal distractions and visually appealing.
 Displays real-time information.
 Should be displayed on the shop floor using a screen or a
bulletin boards.
- KPIs
Continuous Improvement Toolkit . www.citoolkit.com
Examples of Performance Indicators:
- KPIs
Manufacturing / Production Purchasing and Inventory Sales, Marketing and Shipping
• Spoilage / Rejection Rate
• Re-work Rate
• Time Spent on Product Re-work
• Total Units Manufactured
• Units per Day
• Units Per Labor Hour
• Line Efficiency
• Production Capacity
• Capacity Utilization
• First Time Right Ratio
• Rolled Throughput Yield (RTY)
• Average Change Over Time
• Material Usage
• Cancelled Purchase Requests
• Purchase Orders Completed
• Purchase Order Cycle Time
• Emergency Purchase Rate
• Rejected Receipt Rate
• Late Deliveries from Suppliers
• Changes in Approved Suppliers
• Unloading Time
• Stock Level
• Inventory Days Coverage
• Re-work on Procured Inventory
• Time to Process Customer Orders
• Time to Resolve Customer Claims
• Visits to Key Customers
• New Customers Rate
• Customer Retention Rate
• Sales Forecast Accuracy
• Market Share Growth
• Marketing Expenses
• Product Availability
• Loading Time
• Not On-Time In-Full (NOTIF)
Continuous Improvement Toolkit . www.citoolkit.com
Examples of Performance Indicators:
- KPIs
Finance and Accounting Maintenance Human Resources
• Net Profit Margin
• Cost of Goods Sold
• Operating Income
• Cost per Unit
• Working Capital
• Accounts Receivable Turnover
• Inventory Turnover Ratio
• Return on Investment (ROI)
• Budget Variance
• Capital Expenditure (CAPEX)
• Monthly Department Expenses
• Response Time to Breakdown
• Mean Time Between Failures
• Mean Time to Repair
• Spare Parts Inventory Turnover
• Work Orders Completed
• Preventive Maintenance Completed
• Repair Cost
• Repair Cost per Unit
• Maintenance / Repair Downtime
• Staff Turnover Ratio
• Employee Satisfaction Index
• Exit Interview Satisfaction Rate
• Internal Promotion Rate
• Labor Utilization Rate
• High Performing Employees
• Training Hours Ratio
• Training Attendance Ratio
• Absenteeism Rate
• Part-Time Employees
• Disabled Staff Ratio
Continuous Improvement Toolkit . www.citoolkit.com
Examples of Performance Indicators:
- KPIs
Health, Safety and Env. Quality Lean
• Recorded Safety Observations
• Workplace Inspection Audits
• Risk Assessments Implemented
• Lost Work Days
• Significant Injury Cases
• Near Miss Cases
• First Aid Treatment Cases
• Environmental Incidents
• Safety Circles Conducted
• Satisfaction with Ergonomics
• EHS Training Hours
• Customer Complaints
• Returns from Key Customers
• Customer Satisfaction Index
• Customer Surveys Conducted
• Defects at Customer Site
• Defects per Million Opportunities
• Defects per Unit
• Cost of Non Quality
• Quality Personnel to Total Personnel
• Quality Circles Conducted
• Audits Performed on Schedule
• Value Added Time
• Takt Time
• Operator / Machine Cycle Time
• Order Processing Cycle Time
• Net Available Time
• Work in Process Time
• Value Stream Ratio
• Process Cycle Efficiency
• Uptime Ratio
• Overall Equipment Effectiveness
• Muda-Free Cost
Continuous Improvement Toolkit . www.citoolkit.com
KPIs and Continuous Improvement:
 KPIs are key to the continuous improvement process.
 Examples:
• Chartered improvement projects
• Project charters approved and signed off
• SOPs developed after improvement projects
• Completed improvement projects
• Financial department involvement in improvement projects
• Processes perform at 4.5 Sigma or higher
• Staff trained in Lean Six Sigma
• Savings resulting from an employee suggestions
• Time to respond to suggestions
• Idea conversion rate
• Kaizen events conducted
• Cross-industry benchmarking studies conducted
- KPIs
Continuous Improvement Toolkit . www.citoolkit.com
Operational Definitions:
 A clear and detailed description of a performance indicator.
 Ensure consistent data collection.
 Ensure standards are applied in the
same manner.
- KPIs
Customer
reports fault
Fault
Fixed?
Technician
visit
Diagnose
fault
Fault closed
1:Timetorepair(hours)
2: Fixed
first time (%)
1: Cup
height (mm)
2: Cup
diameter (mm)
Continuous Improvement Toolkit . www.citoolkit.com
Components of Operational Definitions:
- KPIs
Performance Indicator: Perspective: Unit:
Description / Formula:
Data Source: Measurement Instrument: Process Diagram or
Drawings:
Method of Test (How):
Frequency (When): Decision Criteria:
Data Collector (Who): Owner:
Baseline: Target:
Continuous Improvement Toolkit . www.citoolkit.com
Utilizing Performance Indicators:
 Review the quality of the current data collection methods.
 Train staff on CTFs, KPIs, empowerment and process improvement methods.
 Start by a few easily understood performance indicators.
 Relate to critical success factors and reflect the voice-of-the-customer.
 Allow teams to define and select their own performance indicators.
 Have performance indicators approved by senior management.
 Measure and report only what matters.
 Monitor performance using dashboards.
 Display at workplace.
 Use them as a basis for team meetings and
decision making.
 Identify and pursue improvement goals.
- KPIs
Continuous Improvement Toolkit . www.citoolkit.com
Further Information:
 A problem arise when managers struggle to identify the vital
few performance indicators, and instead collect and report a
vast amount of everything that is easy to measure.
 Many of the customer related performance indicators
(mentioned earlier) are developed and managed using
customer relationship management software.
- KPIs

Key Performance Indicators

  • 1.
    Continuous Improvement Toolkit. www.citoolkit.com Continuous Improvement Toolkit KPIs (Key Performance Indicators)
  • 2.
    Continuous Improvement Toolkit. www.citoolkit.com Check Sheets Data Collection Process MappingFlowcharting Flow Process Charts 5S Value Stream Mapping Control Charts Mistake Proofing Tree Diagram* Understanding Performance Fishbone Diagram Design of Experiment Implementing Solutions** Creating Ideas Brainstorming Attribute Analysis Deciding & Selecting Decision Tree Force Field Analysis Cost Benefit Analysis Voting Planning & Project Management* Value Analysis Kaizen Events Quick Changeover Managing Risk FMEA PDPC RAID Log* Observations Focus Groups Understanding Cause & Effect Pareto Analysis IDEF0 5 Whys Matrix DiagramKano Analysis KPIs Lean Measures Importance-Urgency Mapping Waste Analysis Fault Tree Analysis Relationship Mapping* Benchmarking** SCAMPER** C&E Matrix Confidence Intervals Pugh Matrix SIPOC* Prioritization Matrix Stakeholder Analysis Critical-to Tree Paired Comparison Improvement Roadmaps Interviews QFD Graphical Analysis Lateral Thinking Hypothesis Testing Visual Management Ergonomics Reliability Analysis Cross Training How-How Diagram** Flow Time Value Map ANOVA Gap Analysis* Traffic Light Assessment TPN Analysis Decision Balance Sheet Suggestion systems Risk Assessment* AutomationSimulation Break-even Analysis Service Blueprints DMAIC Process Redesign Run Charts TPM Control Planning Chi-Square SWOT Analysis Capability Indices Policy Deployment Data collection planner* Affinity DiagramQuestionnaires Probability Distributions Bottleneck Analysis** MSA Descriptive Statistics Cost of Quality* Process Yield Histograms & Boxplots Just in Time Pick Chart Portfolio Matrix Four Field Matrix Root Cause Analysis Data Snooping Morphological AnalysisSampling Spaghetti Diagram Pull OEE Mind Mapping* Project Charter PDCA Designing & Analyzing Processes CorrelationScatter Plots Regression Gantt Charts Activity NetworksRACI Matrix PERT/CPMDaily Planning MOST Standard work Document controlA3 Thinking The Continuous Improvement Map Multi vari Studies
  • 3.
    Continuous Improvement Toolkit. www.citoolkit.com Performance Management:  An approach used to manage performance of an organization.  It plays an important role in the success or failure of a business.  It is applied to measure the performance of: • An organization. • A business unit. • A single department. • A project. • A process that builds a product or service. • An employee. - KPIs
  • 4.
    Continuous Improvement Toolkit. www.citoolkit.com Performance Management:  It includes activities such as: • Planning and setting expectations. • Developing the capacity to perform. • Continually monitoring performance. • Periodically rating performance in a summary fashion. • Rewarding good performance. - KPIs
  • 5.
    Continuous Improvement Toolkit. www.citoolkit.com Performance Indicators:  Measurements that define and assess the performance of an organization, department, employee, etc..  Objectives to be targeted in order to add the most value to a business.  Choosing the right performance indicators relies upon a good understanding of what is important to the business. - KPIs
  • 6.
    Continuous Improvement Toolkit. www.citoolkit.com Two Types:  Result oriented indicators: • Focus on the key outputs of a process. • Related to the critical success factors. • Examples: customer complaints and return on investment (ROI).  Process oriented indicators: • Focus on the inputs to a process. • Examples: time to process customer order and late deliveries. - KPIs Business Goals KRIs, KPIs RIs, PIs Operational Goals Project Goals RIs, PIs
  • 7.
    Continuous Improvement Toolkit. www.citoolkit.com Performance Indicators are Used to:  Help organizations to understand their performance levels.  Help setting realistic performance goals.  Help aligning daily work to strategic goals.  Help monitoring progress on a real-time basis.  Help understanding the weaknesses and establishing improvement priorities.  Determine whether an improvement is being made and maintained.  Help benchmark internally and externally.  Identify if staff are doing well and to help them if they are not.  Provide a basis for recognizing team and individual performance. - KPIs
  • 8.
    Continuous Improvement Toolkit. www.citoolkit.com Selecting the Proper Performance Indicators:  Performance indicators should be developed based on: • Critical Success Factors (CSFs). • Voice of the Customer (VOC). - KPIs
  • 9.
    Continuous Improvement Toolkit. www.citoolkit.com Critical Success Factors:  Elements that are necessary for a strategy to be successful.  CSFs selection is a very subjective exercise.  Examples of CSFs are: • Delivery on-time and in-full. • Providing superior customer service. • Short time to market new products. • Management commitment. - KPIs
  • 10.
    Continuous Improvement Toolkit. www.citoolkit.com Voice of the Customer:  Performance indicators should reflect the Voice of the Customer.  The Critical-to-Quality characteristics (CTQs) features of your customer should be then used as the basis to select your KPIs.  Raw data needs to be collected from customers. - KPIs
  • 11.
    Continuous Improvement Toolkit. www.citoolkit.com Example - Selecting the Proper Performance Indicators: - KPIs All repairs to be done within 5 days % of repairs done within 5 days On-time in-full delivery % of on-time in-full deliveries Calls answered within 5 rings % of calls answered within 5 rings CTQs / CSFs KPIs Data to be Collected Time to complete each repair Time and quantity delivered Time to answer each call
  • 12.
    Continuous Improvement Toolkit. www.citoolkit.com KPI Tree:  A visual method of displaying measures: • In an organization. • Related to a project.  Brings all measures together.  Provides a visual representation for which measures contribute to other measures.  Helps aligning work with the organization strategy. - KPIs
  • 13.
    Continuous Improvement Toolkit. www.citoolkit.com KPI Tree: - KPIs Purchasing Board of Directors / GM Marketing Production Processing Planning HR Operation Finance Assembly Packaging PI-1, PI-2, PI-3
  • 14.
    Continuous Improvement Toolkit. www.citoolkit.com KPI Tree Example: - KPIs Customer notifications Customer Satisfaction Project Customer complaints % notifications answered within 24 hours % dissatisfaction $ cost to business % of major complaints Average answer time # of complaints# of notifications
  • 15.
    Continuous Improvement Toolkit. www.citoolkit.com KPI Tree:  A successful KPI tree is the one that contains a balance of measures covering efficiency, effectiveness, quality, delivery and cost.  Effectiveness performance indicators measure processes in the eyes of the customer.  Efficiency performance indicators measure processes from business perspective. • Are of interest of internal customers. • Have close links with the 8 Wastes. - KPIs
  • 16.
    Continuous Improvement Toolkit. www.citoolkit.com Characteristics of Effective Performance Indicators:  Reflect the Voice of the Customer.  Relate to critical success factors.  Are agreed with and owned by the areas themselves.  Are well defined and understood by all.  Are measured regularly and consistently.  Enable open and transparent communication.  Are acted upon by the senior management.  Are used for continuous improvement. - KPIs
  • 17.
    Continuous Improvement Toolkit. www.citoolkit.com Balanced Scorecard:  A common way to manage and monitor performance indicators.  A report that displays a collection of performance indicators.  It has evolved from a simple performance measurement framework to a full strategic planning and management system.  It helps monitor performance against strategic goals. - KPIs Financial Customer Learning & Growth Business Process The Four-Perspectives Balanced Scorecard
  • 18.
    Continuous Improvement Toolkit. www.citoolkit.com Performance Dashboards:  A series of graphics, charts and other visual tools that can be easily interpreted and analyzed.  Easily monitor the performance in an organization.  They allow to see if the performance indicators are being met based on the goals in place.  If not, they will visually alert that corrective actions should be made.  They are typically limited to show summaries, comparisons and trends. - KPIs
  • 19.
    Continuous Improvement Toolkit. www.citoolkit.com A Good Dashboard:  Is simple and easy to understand.  Conveys important information at a glance.  Contains minimal distractions and visually appealing.  Displays real-time information.  Should be displayed on the shop floor using a screen or a bulletin boards. - KPIs
  • 20.
    Continuous Improvement Toolkit. www.citoolkit.com Examples of Performance Indicators: - KPIs Manufacturing / Production Purchasing and Inventory Sales, Marketing and Shipping • Spoilage / Rejection Rate • Re-work Rate • Time Spent on Product Re-work • Total Units Manufactured • Units per Day • Units Per Labor Hour • Line Efficiency • Production Capacity • Capacity Utilization • First Time Right Ratio • Rolled Throughput Yield (RTY) • Average Change Over Time • Material Usage • Cancelled Purchase Requests • Purchase Orders Completed • Purchase Order Cycle Time • Emergency Purchase Rate • Rejected Receipt Rate • Late Deliveries from Suppliers • Changes in Approved Suppliers • Unloading Time • Stock Level • Inventory Days Coverage • Re-work on Procured Inventory • Time to Process Customer Orders • Time to Resolve Customer Claims • Visits to Key Customers • New Customers Rate • Customer Retention Rate • Sales Forecast Accuracy • Market Share Growth • Marketing Expenses • Product Availability • Loading Time • Not On-Time In-Full (NOTIF)
  • 21.
    Continuous Improvement Toolkit. www.citoolkit.com Examples of Performance Indicators: - KPIs Finance and Accounting Maintenance Human Resources • Net Profit Margin • Cost of Goods Sold • Operating Income • Cost per Unit • Working Capital • Accounts Receivable Turnover • Inventory Turnover Ratio • Return on Investment (ROI) • Budget Variance • Capital Expenditure (CAPEX) • Monthly Department Expenses • Response Time to Breakdown • Mean Time Between Failures • Mean Time to Repair • Spare Parts Inventory Turnover • Work Orders Completed • Preventive Maintenance Completed • Repair Cost • Repair Cost per Unit • Maintenance / Repair Downtime • Staff Turnover Ratio • Employee Satisfaction Index • Exit Interview Satisfaction Rate • Internal Promotion Rate • Labor Utilization Rate • High Performing Employees • Training Hours Ratio • Training Attendance Ratio • Absenteeism Rate • Part-Time Employees • Disabled Staff Ratio
  • 22.
    Continuous Improvement Toolkit. www.citoolkit.com Examples of Performance Indicators: - KPIs Health, Safety and Env. Quality Lean • Recorded Safety Observations • Workplace Inspection Audits • Risk Assessments Implemented • Lost Work Days • Significant Injury Cases • Near Miss Cases • First Aid Treatment Cases • Environmental Incidents • Safety Circles Conducted • Satisfaction with Ergonomics • EHS Training Hours • Customer Complaints • Returns from Key Customers • Customer Satisfaction Index • Customer Surveys Conducted • Defects at Customer Site • Defects per Million Opportunities • Defects per Unit • Cost of Non Quality • Quality Personnel to Total Personnel • Quality Circles Conducted • Audits Performed on Schedule • Value Added Time • Takt Time • Operator / Machine Cycle Time • Order Processing Cycle Time • Net Available Time • Work in Process Time • Value Stream Ratio • Process Cycle Efficiency • Uptime Ratio • Overall Equipment Effectiveness • Muda-Free Cost
  • 23.
    Continuous Improvement Toolkit. www.citoolkit.com KPIs and Continuous Improvement:  KPIs are key to the continuous improvement process.  Examples: • Chartered improvement projects • Project charters approved and signed off • SOPs developed after improvement projects • Completed improvement projects • Financial department involvement in improvement projects • Processes perform at 4.5 Sigma or higher • Staff trained in Lean Six Sigma • Savings resulting from an employee suggestions • Time to respond to suggestions • Idea conversion rate • Kaizen events conducted • Cross-industry benchmarking studies conducted - KPIs
  • 24.
    Continuous Improvement Toolkit. www.citoolkit.com Operational Definitions:  A clear and detailed description of a performance indicator.  Ensure consistent data collection.  Ensure standards are applied in the same manner. - KPIs Customer reports fault Fault Fixed? Technician visit Diagnose fault Fault closed 1:Timetorepair(hours) 2: Fixed first time (%) 1: Cup height (mm) 2: Cup diameter (mm)
  • 25.
    Continuous Improvement Toolkit. www.citoolkit.com Components of Operational Definitions: - KPIs Performance Indicator: Perspective: Unit: Description / Formula: Data Source: Measurement Instrument: Process Diagram or Drawings: Method of Test (How): Frequency (When): Decision Criteria: Data Collector (Who): Owner: Baseline: Target:
  • 26.
    Continuous Improvement Toolkit. www.citoolkit.com Utilizing Performance Indicators:  Review the quality of the current data collection methods.  Train staff on CTFs, KPIs, empowerment and process improvement methods.  Start by a few easily understood performance indicators.  Relate to critical success factors and reflect the voice-of-the-customer.  Allow teams to define and select their own performance indicators.  Have performance indicators approved by senior management.  Measure and report only what matters.  Monitor performance using dashboards.  Display at workplace.  Use them as a basis for team meetings and decision making.  Identify and pursue improvement goals. - KPIs
  • 27.
    Continuous Improvement Toolkit. www.citoolkit.com Further Information:  A problem arise when managers struggle to identify the vital few performance indicators, and instead collect and report a vast amount of everything that is easy to measure.  Many of the customer related performance indicators (mentioned earlier) are developed and managed using customer relationship management software. - KPIs