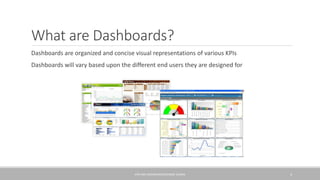
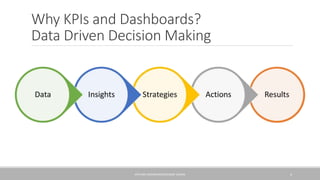
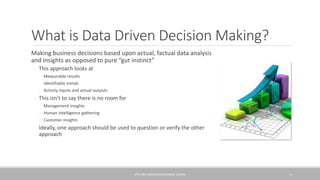
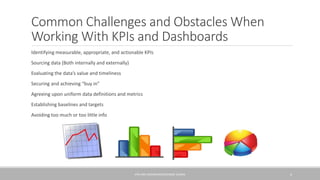
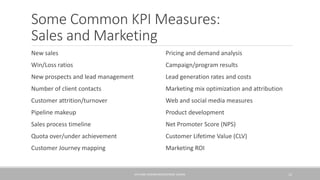
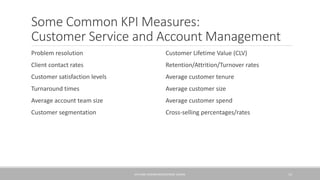
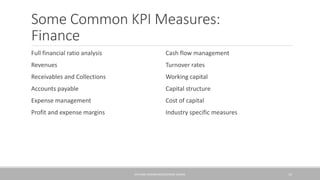
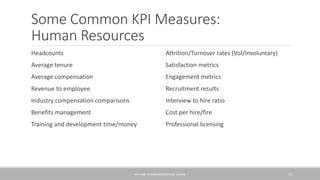
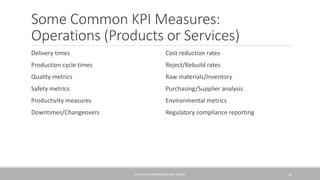
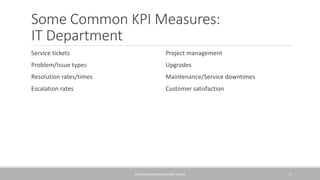
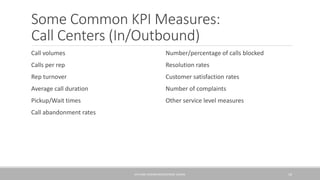
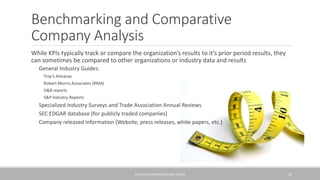
KPIs and Dashboards
GETTING STARTED WITH DATA DRIVEN DECISION MAKING
DECK PREPARED BY GEORGE SLOANE
What are KPIs?
KPIs or Key Performance Indicators are measures that help organizations confirm that they are
on track to meeting goals and objectives
KPIs can cut across the organization (senior management, functional departments, and
operating divisions), but all eventually converge on overall organizational goals and objectives
KPIs should lead to data driven decision making in the form of new or future goals and
objectives, adjustments or changes in best practices, and measuring various initiatives,
programs, and projects
Some KPIs are product/industry specific
KPIS AND DASHBOARDS/GEORGE SLOANE 2
What are Dashboards?
Dashboards are organized and concise visual representations of various KPIs
Dashboards will vary based upon the different end users they are designed for
KPIS AND DASHBOARDS/GEORGE SLOANE 3
Why KPIs and Dashboards?
Data Driven Decision Making
KPIS AND DASHBOARDS/GEORGE SLOANE 4
What is Data Driven Decision Making?
Making business decisions based upon actual, factual data analysis
and insights as opposed to pure “gut instinct”
◦ This approach looks at
◦ Measurable results
◦ Identifiable trends
◦ Activity inputs and actual outputs
◦ This isn’t to say there is no room for
◦ Management insights
◦ Human intelligence gathering
◦ Customer insights
◦ Ideally, one approach should be used to question or verify the other
approach
KPIS AND DASHBOARDS/GEORGE SLOANE 5
Common Challenges and Obstacles When
Working With KPIs and Dashboards
Identifying measurable, appropriate, and actionable KPIs
Sourcing data (Both internally and externally)
Evaluating the data’s value and timeliness
Securing and achieving “buy in”
Agreeing upon uniform data definitions and metrics
Establishing baselines and targets
Avoiding too much or too little info
KPIS AND DASHBOARDS/GEORGE SLOANE 6
KPI and Dashboard Timeframes
The time periods used depend upon the shelf life of the data and end user requirements:
◦ Annual
◦ 3 year views are common
◦ Quarterly
◦ 4-12 quarters are typical
◦ Monthly
◦ 12-15 months is common
◦ 30/60/90 days views used as well
◦ Weekly
◦ Daily
◦ Real-time
KPIS AND DASHBOARDS/GEORGE SLOANE 7
KPI and Dashboards Elements
Measures might be a:
◦ Ratio
◦ Percentage
◦ Dollar amount
◦ Counted Unit:
◦ Activities
◦ Product
◦ People
◦ Time
◦ Transactions
◦ Leads
◦ And more . . .
KPIS AND DASHBOARDS/GEORGE SLOANE 8
Dashboards:
Broad Roll-Ups vs Deep Dives
Broad “roll-up” dashboards are typically high level, across the organization views used by senior
management
◦ Many of the KPIs on these dashboards roll up from the specific functions discussed below
Deep dive dashboards tend to be more specific and “drill down” or “slice and dice” the data.
These dashboards are used by:
◦ Sales and Marketing
◦ Finance or Human Resources
◦ Customer Service and Account Management
◦ IT and Call centers
◦ Operations, Manufacturing, and Product/Service Delivery
KPIS AND DASHBOARDS/GEORGE SLOANE 9
Now Let’s Look at Common Examples . . .
By no means are these all inclusive lists . . .
KPIS AND DASHBOARDS/GEORGE SLOANE 10
Some Common KPI Measures:
Senior Management
Goal achievement gauges
Sales Pipeline
Financial results
◦ Revenues
◦ Operating margins
◦ Net profit
◦ ROE
◦ Cashflow
Project completion gauges
Customer stats and concentrations
Productivity
◦ Revenue per employee
◦ Capacity Utilization
◦ Backlogs
Service levels
◦ On-time delivery
◦ Downtimes
Customer satisfaction
◦ Indices
◦ NPS
Employees
◦ Engagement
◦ Headcount
KPIS AND DASHBOARDS/GEORGE SLOANE 11
Some Common KPI Measures:
Sales and Marketing
New sales
Win/Loss ratios
New prospects and lead management
Number of client contacts
Customer attrition/turnover
Pipeline makeup
Sales process timeline
Quota over/under achievement
Customer Journey mapping
Pricing and demand analysis
Campaign/program results
Lead generation rates and costs
Marketing mix optimization and attribution
Web and social media measures
Product development
Net Promoter Score (NPS)
Customer Lifetime Value (CLV)
Marketing ROI
KPIS AND DASHBOARDS/GEORGE SLOANE 12
Some Common KPI Measures:
Customer Service and Account Management
Problem resolution
Client contact rates
Customer satisfaction levels
Turnaround times
Average account team size
Customer segmentation
Customer Lifetime Value (CLV)
Retention/Attrition/Turnover rates
Average customer tenure
Average customer size
Average customer spend
Cross-selling percentages/rates
KPIS AND DASHBOARDS/GEORGE SLOANE 13
Some Common KPI Measures:
Finance
Full financial ratio analysis
Revenues
Receivables and Collections
Accounts payable
Expense management
Profit and expense margins
Cash flow management
Turnover rates
Working capital
Capital structure
Cost of capital
Industry specific measures
KPIS AND DASHBOARDS/GEORGE SLOANE 14
Some Common KPI Measures:
Human Resources
Headcounts
Average tenure
Average compensation
Revenue to employee
Industry compensation comparisons
Benefits management
Training and development time/money
Attrition/Turnover rates (Vol/Involuntary)
Satisfaction metrics
Engagement metrics
Recruitment results
Interview to hire ratio
Cost per hire/fire
Professional licensing
KPIS AND DASHBOARDS/GEORGE SLOANE 15
Some Common KPI Measures:
Operations (Products or Services)
Delivery times
Production cycle times
Quality metrics
Safety metrics
Productivity measures
Downtimes/Changeovers
Cost reduction rates
Reject/Rebuild rates
Raw materials/Inventory
Purchasing/Supplier analysis
Environmental metrics
Regulatory compliance reporting
KPIS AND DASHBOARDS/GEORGE SLOANE 16
Some Common KPI Measures:
IT Department
Service tickets
Problem/Issue types
Resolution rates/times
Escalation rates
Project management
Upgrades
Maintenance/Service downtimes
Customer satisfaction
KPIS AND DASHBOARDS/GEORGE SLOANE 17
Some Common KPI Measures:
Call Centers (In/Outbound)
Call volumes
Calls per rep
Rep turnover
Average call duration
Pickup/Wait times
Call abandonment rates
Number/percentage of calls blocked
Resolution rates
Customer satisfaction rates
Number of complaints
Other service level measures
KPIS AND DASHBOARDS/GEORGE SLOANE 18
Benchmarking and Comparative
Company Analysis
While KPIs typically track or compare the organization’s results to it’s prior period results, they
can sometimes be compared to other organizations or industry data and results
◦ General Industry Guides:
◦ Troy’s Almanac
◦ Robert Morris Associates (RMA)
◦ D&B reports
◦ S&P Industry Reports
◦ Specialized Industry Surveys and Trade Association Annual Reviews
◦ SEC EDGAR database (for publicly traded companies)
◦ Company released information (Website, press releases, white papers, etc.)
KPIS AND DASHBOARDS/GEORGE SLOANE 19
Forecasting and Projections
While KPIs and Dashboards tend to look backwards on a rolling basis, sometimes forward
looking forecasts and projections can be incorporated as well
◦ Trend analysis
◦ Statistical methods
Forecast methods should be back tested for predictive accuracy
Projections should consider possible outcomes on a best, worst, and probable case scenarios
KPIS AND DASHBOARDS/GEORGE SLOANE 20
Some Useful Data Visualization Tools For
Building KPI Dashboards
MS Excel and Powerpoint
Tableau
Domo
Zoho
And many more . . .
KPIS AND DASHBOARDS/GEORGE SLOANE 21
Developing KPIs and Dashboards:
A Simple Process Overview
Spec out and initiate the project (Including timetables and responsibilities)
Start with goals and objectives
Document specific end user requirements
Identify and define unique and common metrics
Source the data (Timing, availability, format, etc.)
Build and test prototypes on selected end users
Design and validate the actual solution
Launch and seek feedback
Determine ongoing ownership and governance
Continue to make ongoing improvements
KPIS AND DASHBOARDS/GEORGE SLOANE 22
Our KPIs and Dashboards Aren’t Done?
Well, yes and no– it is a continuous improvement approach . . .
KPIS AND DASHBOARDS/GEORGE SLOANE 23
Related Topic Decks You Might be
Interested in:
Decks:
◦ How to Perform More Effective Competitive Intelligence
◦ Data to Results
◦ Data Visualization
◦ Sales Analytics
◦ Win/Loss Analysis
◦ Thoughts on Quantifying Qualitative Data
Infographics:
◦ 360 Degree Company Analysis
◦ Pricing Model Framework
◦ Developing or Streamlining a System or Process
These and other decks can be found at my Slideshare.net account accessible at this link:
◦ Slideshare or http://www.slideshare.net/GeorgeSloane
KPIS AND DASHBOARDS/GEORGE SLOANE 24
Thank You!
This Slide Concludes This Review
For More Information, Please Contact George Sloane at:
◦ AnalyticDesignGuy.com website
◦ LinkedIn
◦ Twitter
◦ Facebook
◦ Google+
◦ Slideshare
◦ Goodreads
• Gmail: gsloane.business@gmail.com
• Phone: (203) 981-4488
KPIS AND DASHBOARDS/GEORGE SLOANE 25

KPIs and Dashboards

  • 1.
    KPIs and Dashboards GETTINGSTARTED WITH DATA DRIVEN DECISION MAKING DECK PREPARED BY GEORGE SLOANE
  • 2.
    What are KPIs? KPIsor Key Performance Indicators are measures that help organizations confirm that they are on track to meeting goals and objectives KPIs can cut across the organization (senior management, functional departments, and operating divisions), but all eventually converge on overall organizational goals and objectives KPIs should lead to data driven decision making in the form of new or future goals and objectives, adjustments or changes in best practices, and measuring various initiatives, programs, and projects Some KPIs are product/industry specific KPIS AND DASHBOARDS/GEORGE SLOANE 2
  • 3.
    What are Dashboards? Dashboardsare organized and concise visual representations of various KPIs Dashboards will vary based upon the different end users they are designed for KPIS AND DASHBOARDS/GEORGE SLOANE 3
  • 4.
    Why KPIs andDashboards? Data Driven Decision Making KPIS AND DASHBOARDS/GEORGE SLOANE 4
  • 5.
    What is DataDriven Decision Making? Making business decisions based upon actual, factual data analysis and insights as opposed to pure “gut instinct” ◦ This approach looks at ◦ Measurable results ◦ Identifiable trends ◦ Activity inputs and actual outputs ◦ This isn’t to say there is no room for ◦ Management insights ◦ Human intelligence gathering ◦ Customer insights ◦ Ideally, one approach should be used to question or verify the other approach KPIS AND DASHBOARDS/GEORGE SLOANE 5
  • 6.
    Common Challenges andObstacles When Working With KPIs and Dashboards Identifying measurable, appropriate, and actionable KPIs Sourcing data (Both internally and externally) Evaluating the data’s value and timeliness Securing and achieving “buy in” Agreeing upon uniform data definitions and metrics Establishing baselines and targets Avoiding too much or too little info KPIS AND DASHBOARDS/GEORGE SLOANE 6
  • 7.
    KPI and DashboardTimeframes The time periods used depend upon the shelf life of the data and end user requirements: ◦ Annual ◦ 3 year views are common ◦ Quarterly ◦ 4-12 quarters are typical ◦ Monthly ◦ 12-15 months is common ◦ 30/60/90 days views used as well ◦ Weekly ◦ Daily ◦ Real-time KPIS AND DASHBOARDS/GEORGE SLOANE 7
  • 8.
    KPI and DashboardsElements Measures might be a: ◦ Ratio ◦ Percentage ◦ Dollar amount ◦ Counted Unit: ◦ Activities ◦ Product ◦ People ◦ Time ◦ Transactions ◦ Leads ◦ And more . . . KPIS AND DASHBOARDS/GEORGE SLOANE 8
  • 9.
    Dashboards: Broad Roll-Ups vsDeep Dives Broad “roll-up” dashboards are typically high level, across the organization views used by senior management ◦ Many of the KPIs on these dashboards roll up from the specific functions discussed below Deep dive dashboards tend to be more specific and “drill down” or “slice and dice” the data. These dashboards are used by: ◦ Sales and Marketing ◦ Finance or Human Resources ◦ Customer Service and Account Management ◦ IT and Call centers ◦ Operations, Manufacturing, and Product/Service Delivery KPIS AND DASHBOARDS/GEORGE SLOANE 9
  • 10.
    Now Let’s Lookat Common Examples . . . By no means are these all inclusive lists . . . KPIS AND DASHBOARDS/GEORGE SLOANE 10
  • 11.
    Some Common KPIMeasures: Senior Management Goal achievement gauges Sales Pipeline Financial results ◦ Revenues ◦ Operating margins ◦ Net profit ◦ ROE ◦ Cashflow Project completion gauges Customer stats and concentrations Productivity ◦ Revenue per employee ◦ Capacity Utilization ◦ Backlogs Service levels ◦ On-time delivery ◦ Downtimes Customer satisfaction ◦ Indices ◦ NPS Employees ◦ Engagement ◦ Headcount KPIS AND DASHBOARDS/GEORGE SLOANE 11
  • 12.
    Some Common KPIMeasures: Sales and Marketing New sales Win/Loss ratios New prospects and lead management Number of client contacts Customer attrition/turnover Pipeline makeup Sales process timeline Quota over/under achievement Customer Journey mapping Pricing and demand analysis Campaign/program results Lead generation rates and costs Marketing mix optimization and attribution Web and social media measures Product development Net Promoter Score (NPS) Customer Lifetime Value (CLV) Marketing ROI KPIS AND DASHBOARDS/GEORGE SLOANE 12
  • 13.
    Some Common KPIMeasures: Customer Service and Account Management Problem resolution Client contact rates Customer satisfaction levels Turnaround times Average account team size Customer segmentation Customer Lifetime Value (CLV) Retention/Attrition/Turnover rates Average customer tenure Average customer size Average customer spend Cross-selling percentages/rates KPIS AND DASHBOARDS/GEORGE SLOANE 13
  • 14.
    Some Common KPIMeasures: Finance Full financial ratio analysis Revenues Receivables and Collections Accounts payable Expense management Profit and expense margins Cash flow management Turnover rates Working capital Capital structure Cost of capital Industry specific measures KPIS AND DASHBOARDS/GEORGE SLOANE 14
  • 15.
    Some Common KPIMeasures: Human Resources Headcounts Average tenure Average compensation Revenue to employee Industry compensation comparisons Benefits management Training and development time/money Attrition/Turnover rates (Vol/Involuntary) Satisfaction metrics Engagement metrics Recruitment results Interview to hire ratio Cost per hire/fire Professional licensing KPIS AND DASHBOARDS/GEORGE SLOANE 15
  • 16.
    Some Common KPIMeasures: Operations (Products or Services) Delivery times Production cycle times Quality metrics Safety metrics Productivity measures Downtimes/Changeovers Cost reduction rates Reject/Rebuild rates Raw materials/Inventory Purchasing/Supplier analysis Environmental metrics Regulatory compliance reporting KPIS AND DASHBOARDS/GEORGE SLOANE 16
  • 17.
    Some Common KPIMeasures: IT Department Service tickets Problem/Issue types Resolution rates/times Escalation rates Project management Upgrades Maintenance/Service downtimes Customer satisfaction KPIS AND DASHBOARDS/GEORGE SLOANE 17
  • 18.
    Some Common KPIMeasures: Call Centers (In/Outbound) Call volumes Calls per rep Rep turnover Average call duration Pickup/Wait times Call abandonment rates Number/percentage of calls blocked Resolution rates Customer satisfaction rates Number of complaints Other service level measures KPIS AND DASHBOARDS/GEORGE SLOANE 18
  • 19.
    Benchmarking and Comparative CompanyAnalysis While KPIs typically track or compare the organization’s results to it’s prior period results, they can sometimes be compared to other organizations or industry data and results ◦ General Industry Guides: ◦ Troy’s Almanac ◦ Robert Morris Associates (RMA) ◦ D&B reports ◦ S&P Industry Reports ◦ Specialized Industry Surveys and Trade Association Annual Reviews ◦ SEC EDGAR database (for publicly traded companies) ◦ Company released information (Website, press releases, white papers, etc.) KPIS AND DASHBOARDS/GEORGE SLOANE 19
  • 20.
    Forecasting and Projections WhileKPIs and Dashboards tend to look backwards on a rolling basis, sometimes forward looking forecasts and projections can be incorporated as well ◦ Trend analysis ◦ Statistical methods Forecast methods should be back tested for predictive accuracy Projections should consider possible outcomes on a best, worst, and probable case scenarios KPIS AND DASHBOARDS/GEORGE SLOANE 20
  • 21.
    Some Useful DataVisualization Tools For Building KPI Dashboards MS Excel and Powerpoint Tableau Domo Zoho And many more . . . KPIS AND DASHBOARDS/GEORGE SLOANE 21
  • 22.
    Developing KPIs andDashboards: A Simple Process Overview Spec out and initiate the project (Including timetables and responsibilities) Start with goals and objectives Document specific end user requirements Identify and define unique and common metrics Source the data (Timing, availability, format, etc.) Build and test prototypes on selected end users Design and validate the actual solution Launch and seek feedback Determine ongoing ownership and governance Continue to make ongoing improvements KPIS AND DASHBOARDS/GEORGE SLOANE 22
  • 23.
    Our KPIs andDashboards Aren’t Done? Well, yes and no– it is a continuous improvement approach . . . KPIS AND DASHBOARDS/GEORGE SLOANE 23
  • 24.
    Related Topic DecksYou Might be Interested in: Decks: ◦ How to Perform More Effective Competitive Intelligence ◦ Data to Results ◦ Data Visualization ◦ Sales Analytics ◦ Win/Loss Analysis ◦ Thoughts on Quantifying Qualitative Data Infographics: ◦ 360 Degree Company Analysis ◦ Pricing Model Framework ◦ Developing or Streamlining a System or Process These and other decks can be found at my Slideshare.net account accessible at this link: ◦ Slideshare or http://www.slideshare.net/GeorgeSloane KPIS AND DASHBOARDS/GEORGE SLOANE 24
  • 25.
    Thank You! This SlideConcludes This Review For More Information, Please Contact George Sloane at: ◦ AnalyticDesignGuy.com website ◦ LinkedIn ◦ Twitter ◦ Facebook ◦ Google+ ◦ Slideshare ◦ Goodreads • Gmail: gsloane.business@gmail.com • Phone: (203) 981-4488 KPIS AND DASHBOARDS/GEORGE SLOANE 25