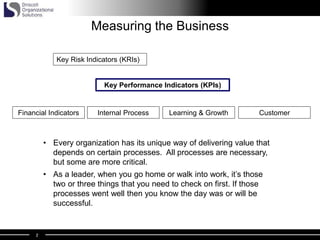
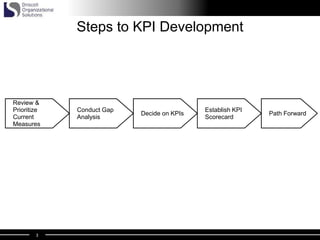
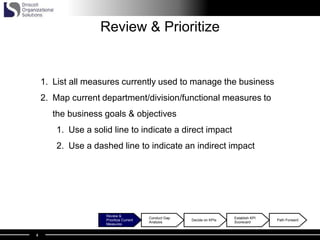
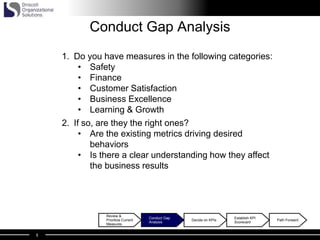
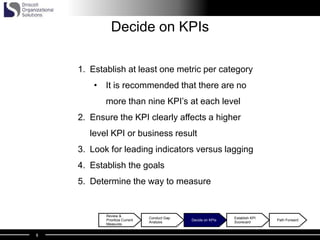
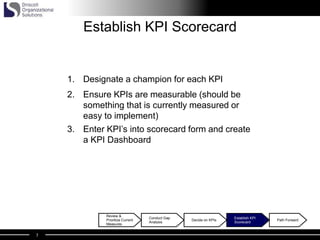
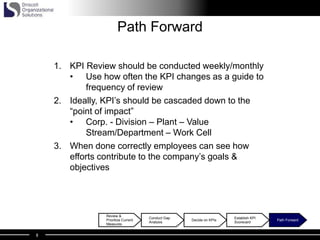
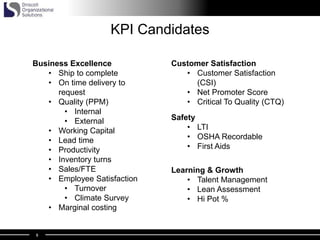
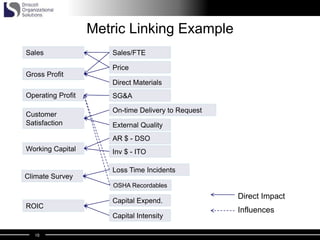
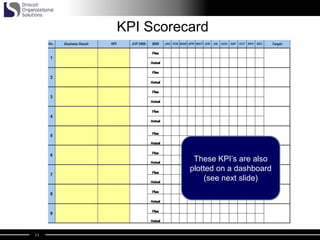
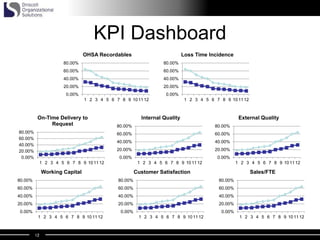
1
Key Performance Indicator (KPI)
Development Overview
2
Measuring the Business
Financial Indicators
Key Performance Indicators (KPIs)
Key Risk Indicators (KRIs)
Internal Process Learning & Growth Customer
• Every organization has its unique way of delivering value that
depends on certain processes. All processes are necessary,
but some are more critical.
• As a leader, when you go home or walk into work, it’s those
two or three things that you need to check on first. If those
processes went well then you know the day was or will be
successful.
3
Steps to KPI Development
Conduct Gap
Analysis
Path Forward
Establish KPI
Scorecard
Decide on KPIs
Review &
Prioritize
Current
Measures
4
Review & Prioritize
1. List all measures currently used to manage the business
2. Map current department/division/functional measures to
the business goals & objectives
1. Use a solid line to indicate a direct impact
2. Use a dashed line to indicate an indirect impact
Conduct Gap
Analysis
Path Forward
Establish KPI
Scorecard
Decide on KPIs
Review &
Prioritize Current
Measures
5
Conduct Gap Analysis
Conduct Gap
Analysis
Path Forward
Establish KPI
Scorecard
Decide on KPIs
Review &
Prioritize Current
Measures
1. Do you have measures in the following categories:
• Safety
• Finance
• Customer Satisfaction
• Business Excellence
• Learning & Growth
2. If so, are they the right ones?
• Are the existing metrics driving desired
behaviors
• Is there a clear understanding how they affect
the business results
6
Decide on KPIs
Conduct Gap
Analysis
Path Forward
Establish KPI
Scorecard
Decide on KPIs
Review &
Prioritize Current
Measures
1. Establish at least one metric per category
• It is recommended that there are no
more than nine KPI’s at each level
2. Ensure the KPI clearly affects a higher
level KPI or business result
3. Look for leading indicators versus lagging
4. Establish the goals
5. Determine the way to measure
7
Establish KPI Scorecard
Conduct Gap
Analysis
Path Forward
Establish KPI
Scorecard
Decide on KPIs
Review &
Prioritize Current
Measures
1. Designate a champion for each KPI
2. Ensure KPIs are measurable (should be
something that is currently measured or
easy to implement)
3. Enter KPI’s into scorecard form and create
a KPI Dashboard
8
Path Forward
Conduct Gap
Analysis
Path Forward
Establish KPI
Scorecard
Decide on KPIs
Review &
Prioritize Current
Measures
1. KPI Review should be conducted weekly/monthly
• Use how often the KPI changes as a guide to
frequency of review
2. Ideally, KPI’s should be cascaded down to the
“point of impact”
• Corp. - Division – Plant – Value
Stream/Department – Work Cell
3. When done correctly employees can see how
efforts contribute to the company’s goals &
objectives
9
Business Excellence
• Ship to complete
• On time delivery to
request
• Quality (PPM)
• Internal
• External
• Working Capital
• Lead time
• Productivity
• Inventory turns
• Sales/FTE
• Employee Satisfaction
• Turnover
• Climate Survey
• Marginal costing
Customer Satisfaction
• Customer Satisfaction
(CSI)
• Net Promoter Score
• Critical To Quality (CTQ)
Safety
• LTI
• OSHA Recordable
• First Aids
Learning & Growth
• Talent Management
• Lean Assessment
• Hi Pot %
KPI Candidates
10
Metric Linking Example
Operating Profit
Sales
Price
Direct Materials
Gross Profit
SG&A
AR $ - DSO
Inv $ - ITO
Capital Expend.
ROIC
Capital Intensity
Loss Time Incidents
Sales/FTE
On-time Delivery to Request
External Quality
Working Capital
Climate Survey
Customer
Satisfaction
OSHA Recordables
Direct Impact
Influences
11
KPI Scorecard
These KPI’s are also
plotted on a dashboard
(see next slide)
12
KPI Dashboard
0.00%
20.00%
40.00%
60.00%
80.00%
1 2 3 4 5 6 7 8 9 101112
Sales/FTE
0.00%
20.00%
40.00%
60.00%
80.00%
1 2 3 4 5 6 7 8 9 101112
On-Time Delivery to
Request
0.00%
20.00%
40.00%
60.00%
80.00%
1 2 3 4 5 6 7 8 9 101112
External Quality
0.00%
20.00%
40.00%
60.00%
80.00%
1 2 3 4 5 6 7 8 9 101112
Working Capital
0.00%
20.00%
40.00%
60.00%
80.00%
1 2 3 4 5 6 7 8 9 101112
Customer Satisfaction
0.00%
20.00%
40.00%
60.00%
80.00%
1 2 3 4 5 6 7 8 9 101112
Loss Time Incidence
0.00%
20.00%
40.00%
60.00%
80.00%
1 2 3 4 5 6 7 8 9 101112
OHSA Recordables
0.00%
20.00%
40.00%
60.00%
80.00%
1 2 3 4 5 6 7 8 9 101112
Internal Quality

KPI Development Overview

  • 1.
    1 Key Performance Indicator(KPI) Development Overview
  • 2.
    2 Measuring the Business FinancialIndicators Key Performance Indicators (KPIs) Key Risk Indicators (KRIs) Internal Process Learning & Growth Customer • Every organization has its unique way of delivering value that depends on certain processes. All processes are necessary, but some are more critical. • As a leader, when you go home or walk into work, it’s those two or three things that you need to check on first. If those processes went well then you know the day was or will be successful.
  • 3.
    3 Steps to KPIDevelopment Conduct Gap Analysis Path Forward Establish KPI Scorecard Decide on KPIs Review & Prioritize Current Measures
  • 4.
    4 Review & Prioritize 1.List all measures currently used to manage the business 2. Map current department/division/functional measures to the business goals & objectives 1. Use a solid line to indicate a direct impact 2. Use a dashed line to indicate an indirect impact Conduct Gap Analysis Path Forward Establish KPI Scorecard Decide on KPIs Review & Prioritize Current Measures
  • 5.
    5 Conduct Gap Analysis ConductGap Analysis Path Forward Establish KPI Scorecard Decide on KPIs Review & Prioritize Current Measures 1. Do you have measures in the following categories: • Safety • Finance • Customer Satisfaction • Business Excellence • Learning & Growth 2. If so, are they the right ones? • Are the existing metrics driving desired behaviors • Is there a clear understanding how they affect the business results
  • 6.
    6 Decide on KPIs ConductGap Analysis Path Forward Establish KPI Scorecard Decide on KPIs Review & Prioritize Current Measures 1. Establish at least one metric per category • It is recommended that there are no more than nine KPI’s at each level 2. Ensure the KPI clearly affects a higher level KPI or business result 3. Look for leading indicators versus lagging 4. Establish the goals 5. Determine the way to measure
  • 7.
    7 Establish KPI Scorecard ConductGap Analysis Path Forward Establish KPI Scorecard Decide on KPIs Review & Prioritize Current Measures 1. Designate a champion for each KPI 2. Ensure KPIs are measurable (should be something that is currently measured or easy to implement) 3. Enter KPI’s into scorecard form and create a KPI Dashboard
  • 8.
    8 Path Forward Conduct Gap Analysis PathForward Establish KPI Scorecard Decide on KPIs Review & Prioritize Current Measures 1. KPI Review should be conducted weekly/monthly • Use how often the KPI changes as a guide to frequency of review 2. Ideally, KPI’s should be cascaded down to the “point of impact” • Corp. - Division – Plant – Value Stream/Department – Work Cell 3. When done correctly employees can see how efforts contribute to the company’s goals & objectives
  • 9.
    9 Business Excellence • Shipto complete • On time delivery to request • Quality (PPM) • Internal • External • Working Capital • Lead time • Productivity • Inventory turns • Sales/FTE • Employee Satisfaction • Turnover • Climate Survey • Marginal costing Customer Satisfaction • Customer Satisfaction (CSI) • Net Promoter Score • Critical To Quality (CTQ) Safety • LTI • OSHA Recordable • First Aids Learning & Growth • Talent Management • Lean Assessment • Hi Pot % KPI Candidates
  • 10.
    10 Metric Linking Example OperatingProfit Sales Price Direct Materials Gross Profit SG&A AR $ - DSO Inv $ - ITO Capital Expend. ROIC Capital Intensity Loss Time Incidents Sales/FTE On-time Delivery to Request External Quality Working Capital Climate Survey Customer Satisfaction OSHA Recordables Direct Impact Influences
  • 11.
    11 KPI Scorecard These KPI’sare also plotted on a dashboard (see next slide)
  • 12.
    12 KPI Dashboard 0.00% 20.00% 40.00% 60.00% 80.00% 1 23 4 5 6 7 8 9 101112 Sales/FTE 0.00% 20.00% 40.00% 60.00% 80.00% 1 2 3 4 5 6 7 8 9 101112 On-Time Delivery to Request 0.00% 20.00% 40.00% 60.00% 80.00% 1 2 3 4 5 6 7 8 9 101112 External Quality 0.00% 20.00% 40.00% 60.00% 80.00% 1 2 3 4 5 6 7 8 9 101112 Working Capital 0.00% 20.00% 40.00% 60.00% 80.00% 1 2 3 4 5 6 7 8 9 101112 Customer Satisfaction 0.00% 20.00% 40.00% 60.00% 80.00% 1 2 3 4 5 6 7 8 9 101112 Loss Time Incidence 0.00% 20.00% 40.00% 60.00% 80.00% 1 2 3 4 5 6 7 8 9 101112 OHSA Recordables 0.00% 20.00% 40.00% 60.00% 80.00% 1 2 3 4 5 6 7 8 9 101112 Internal Quality