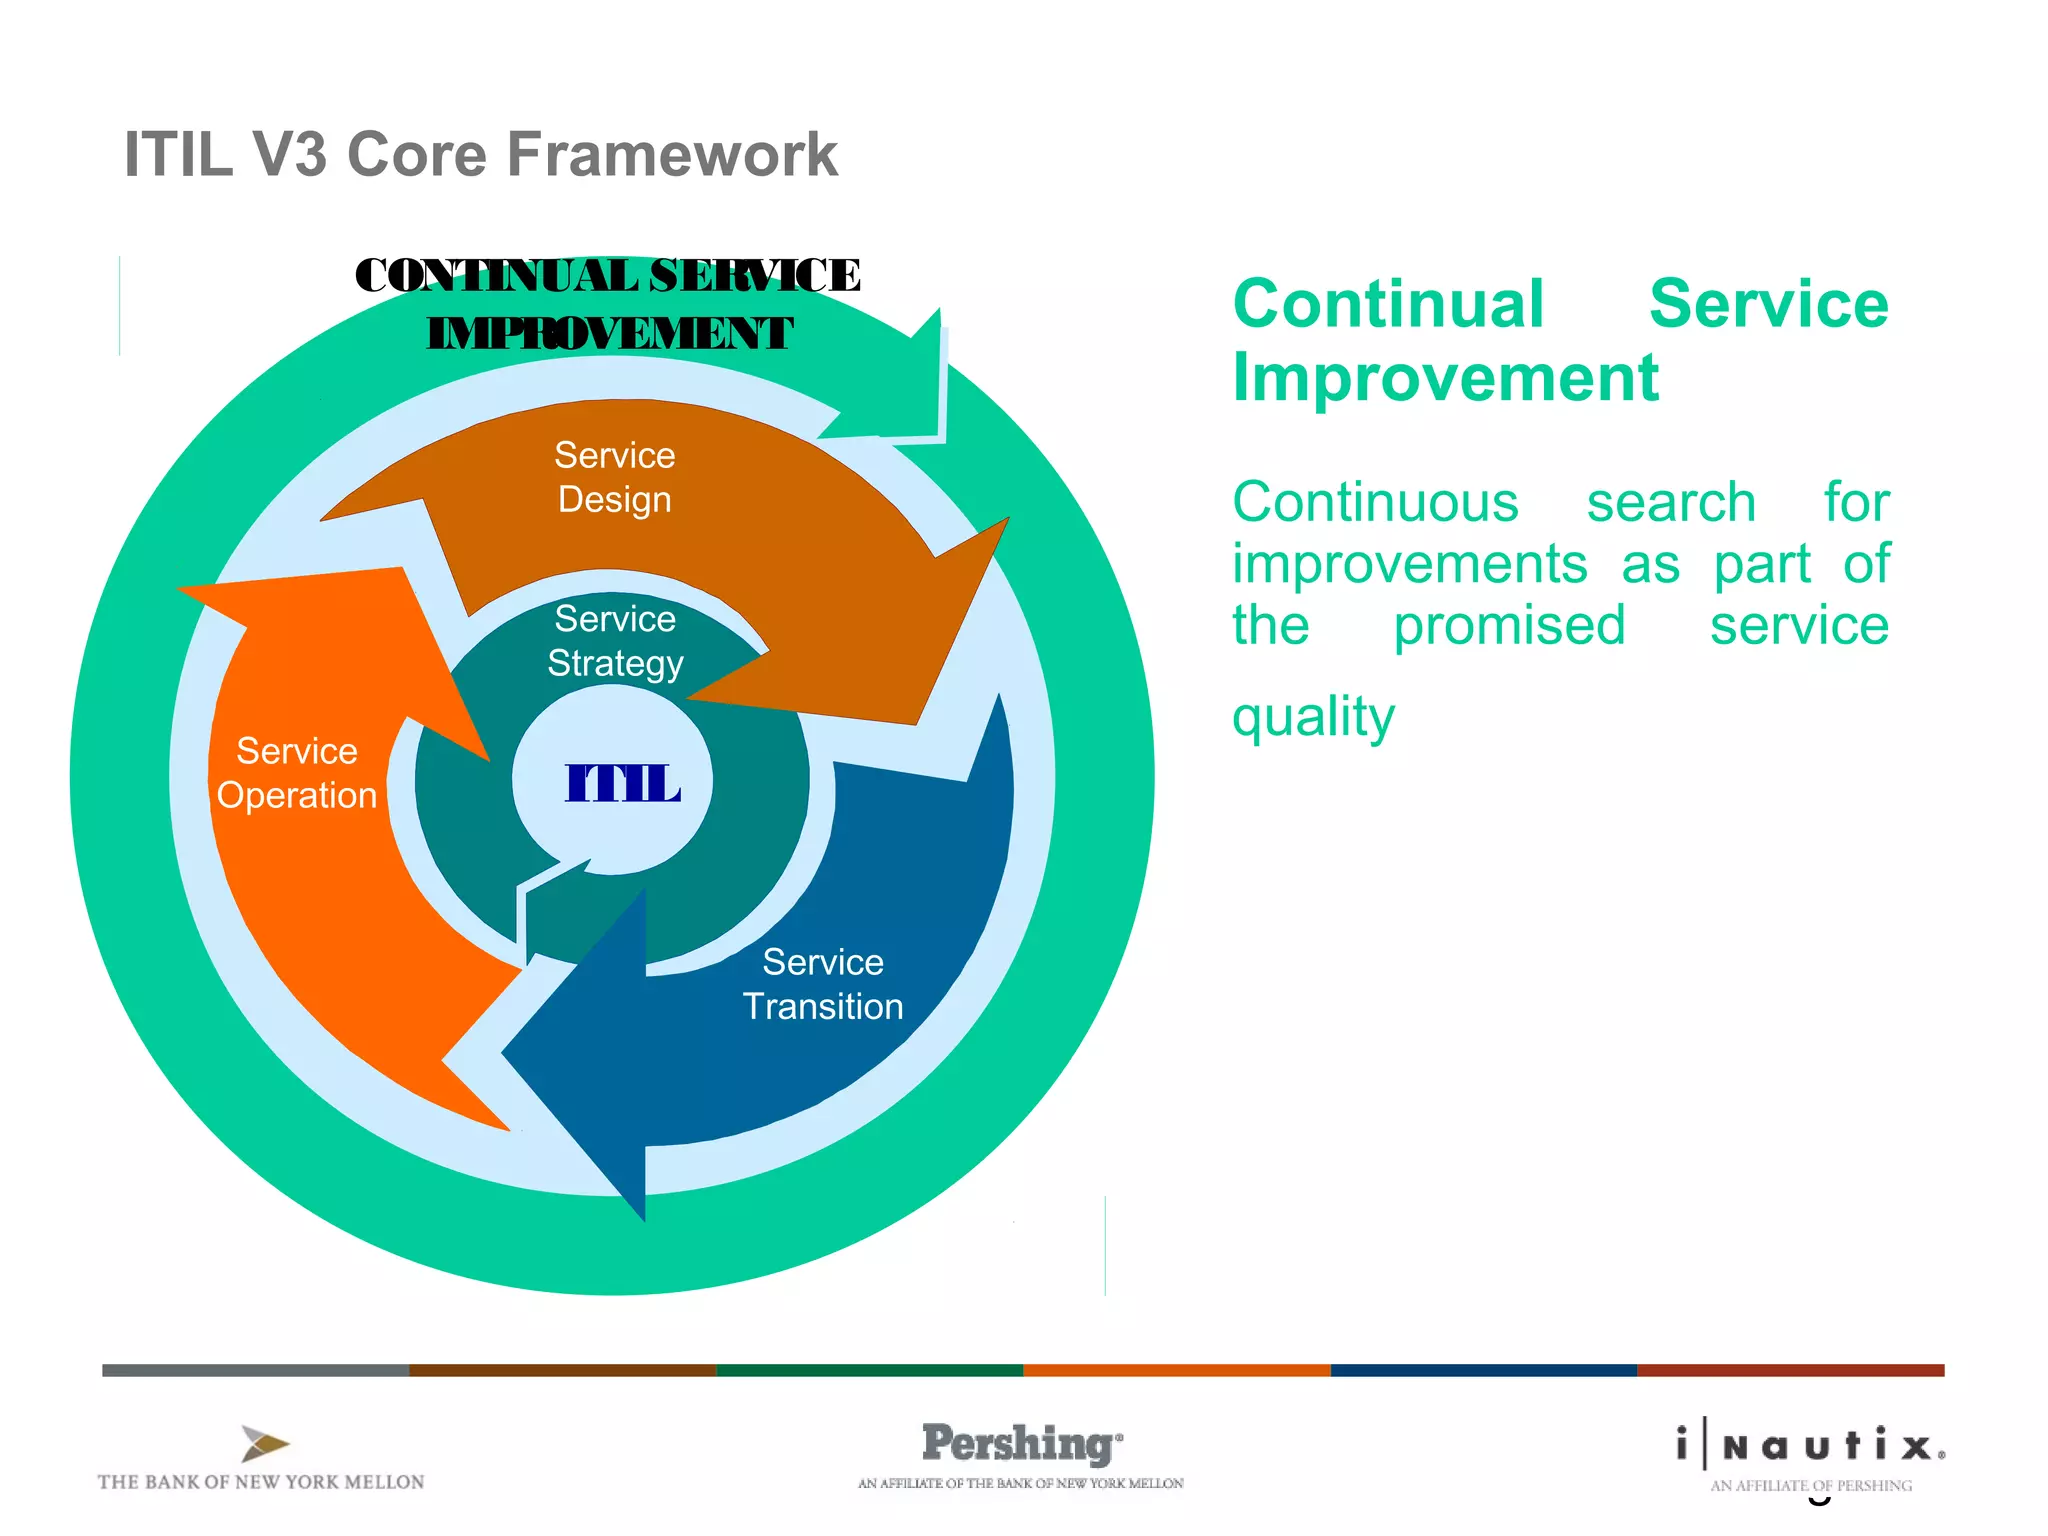
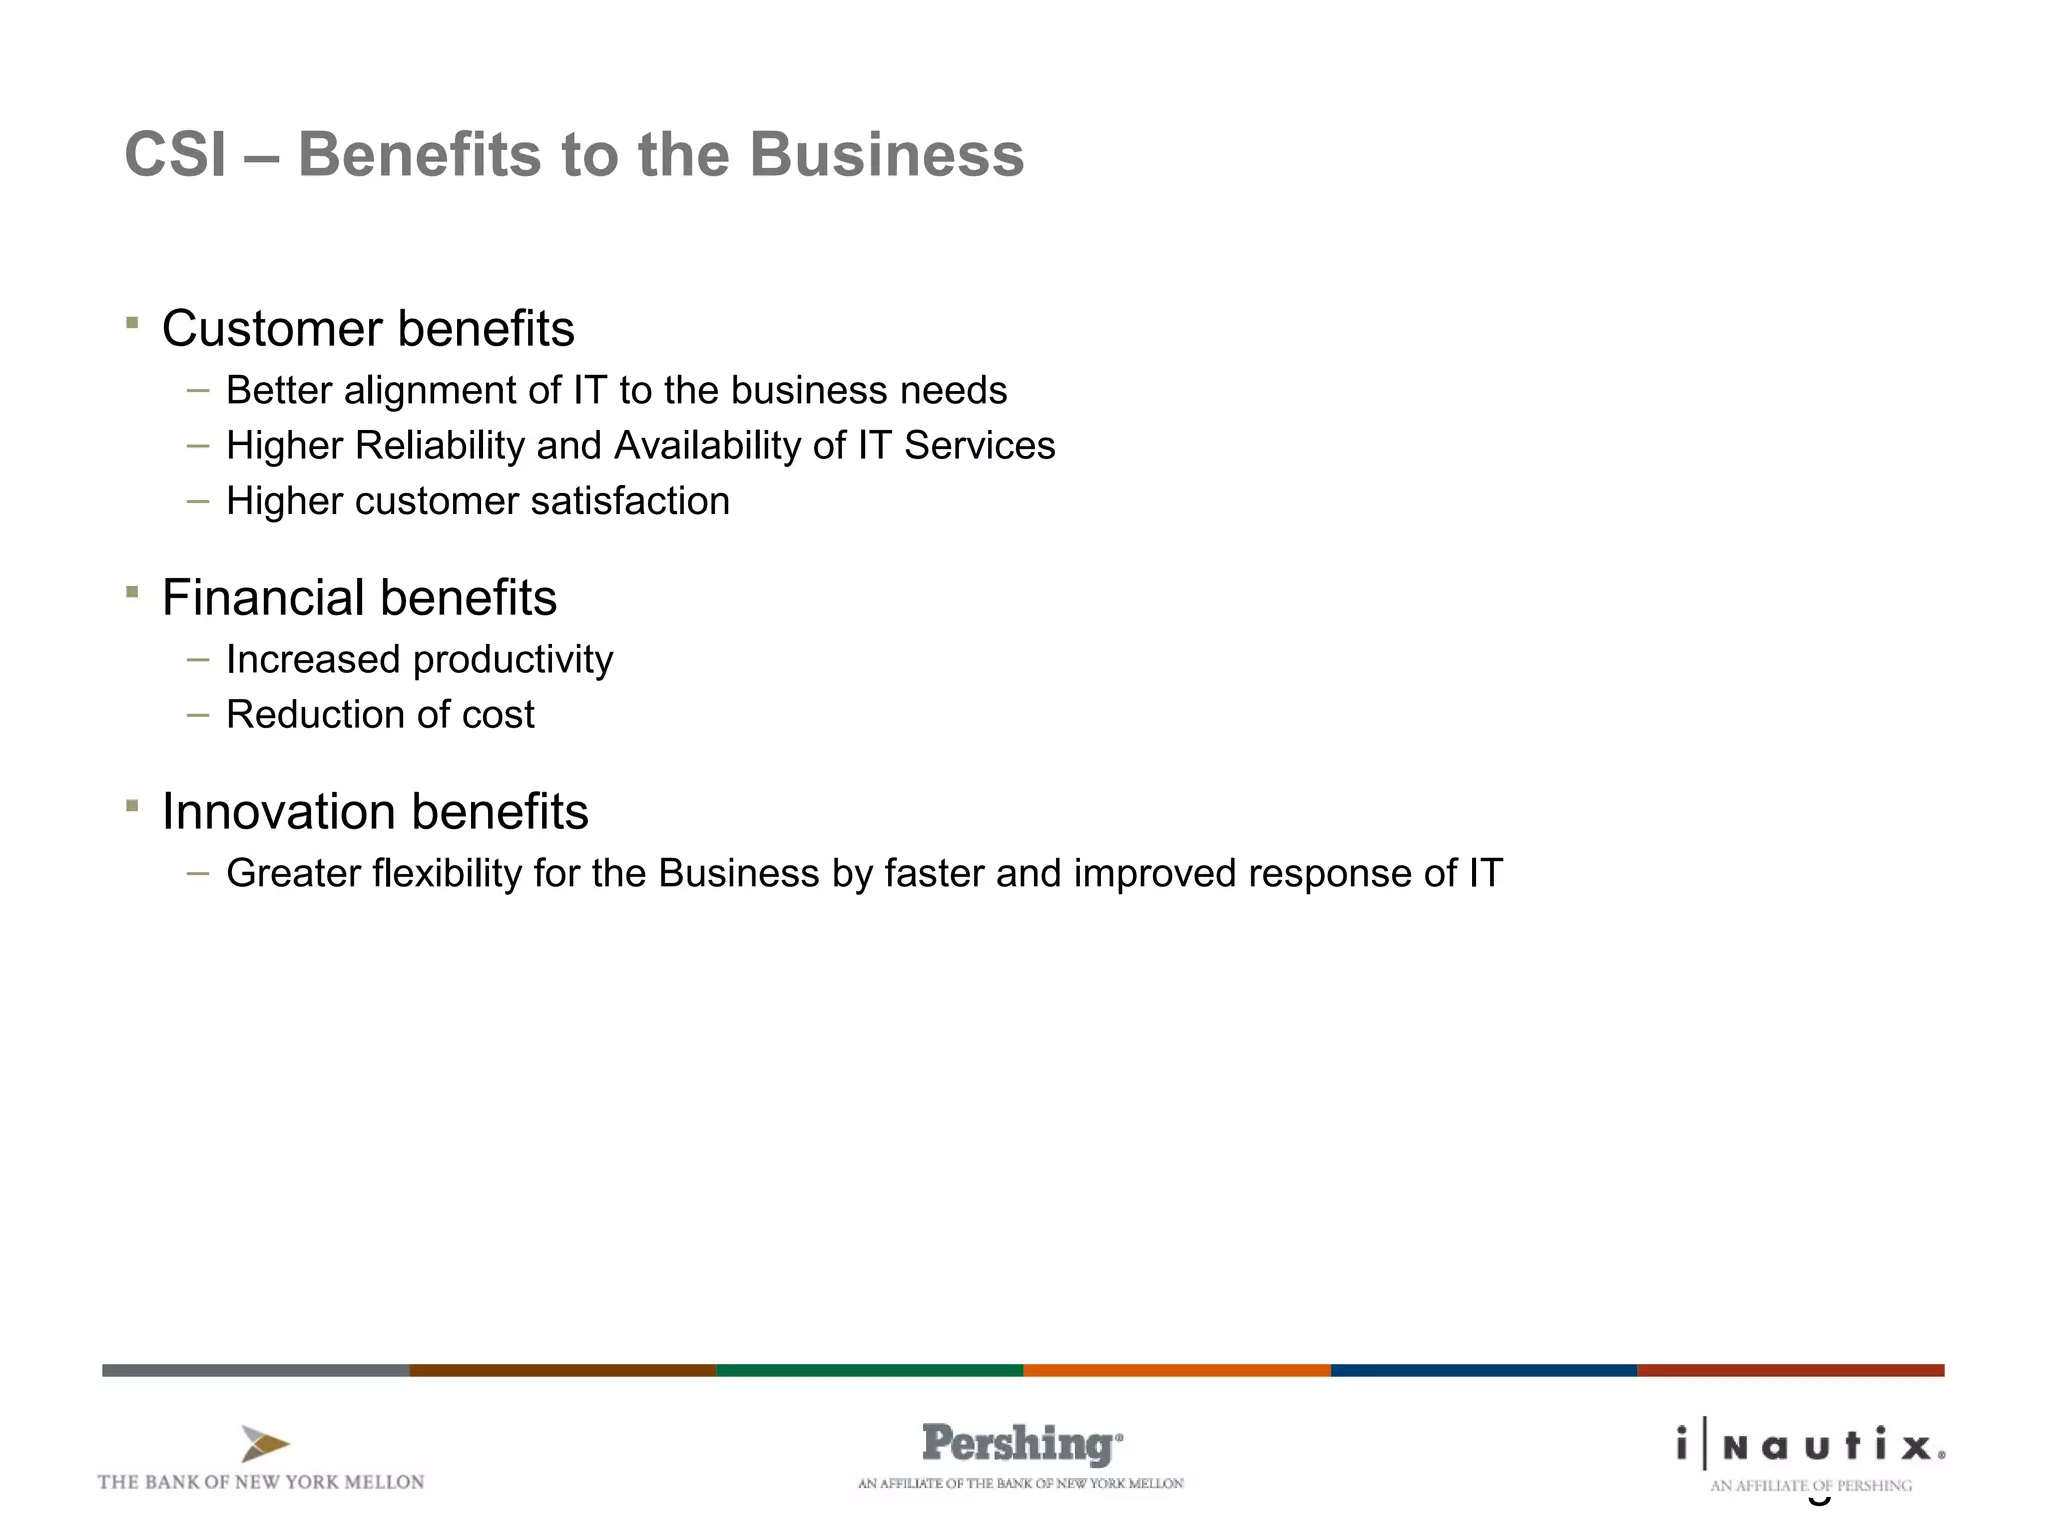
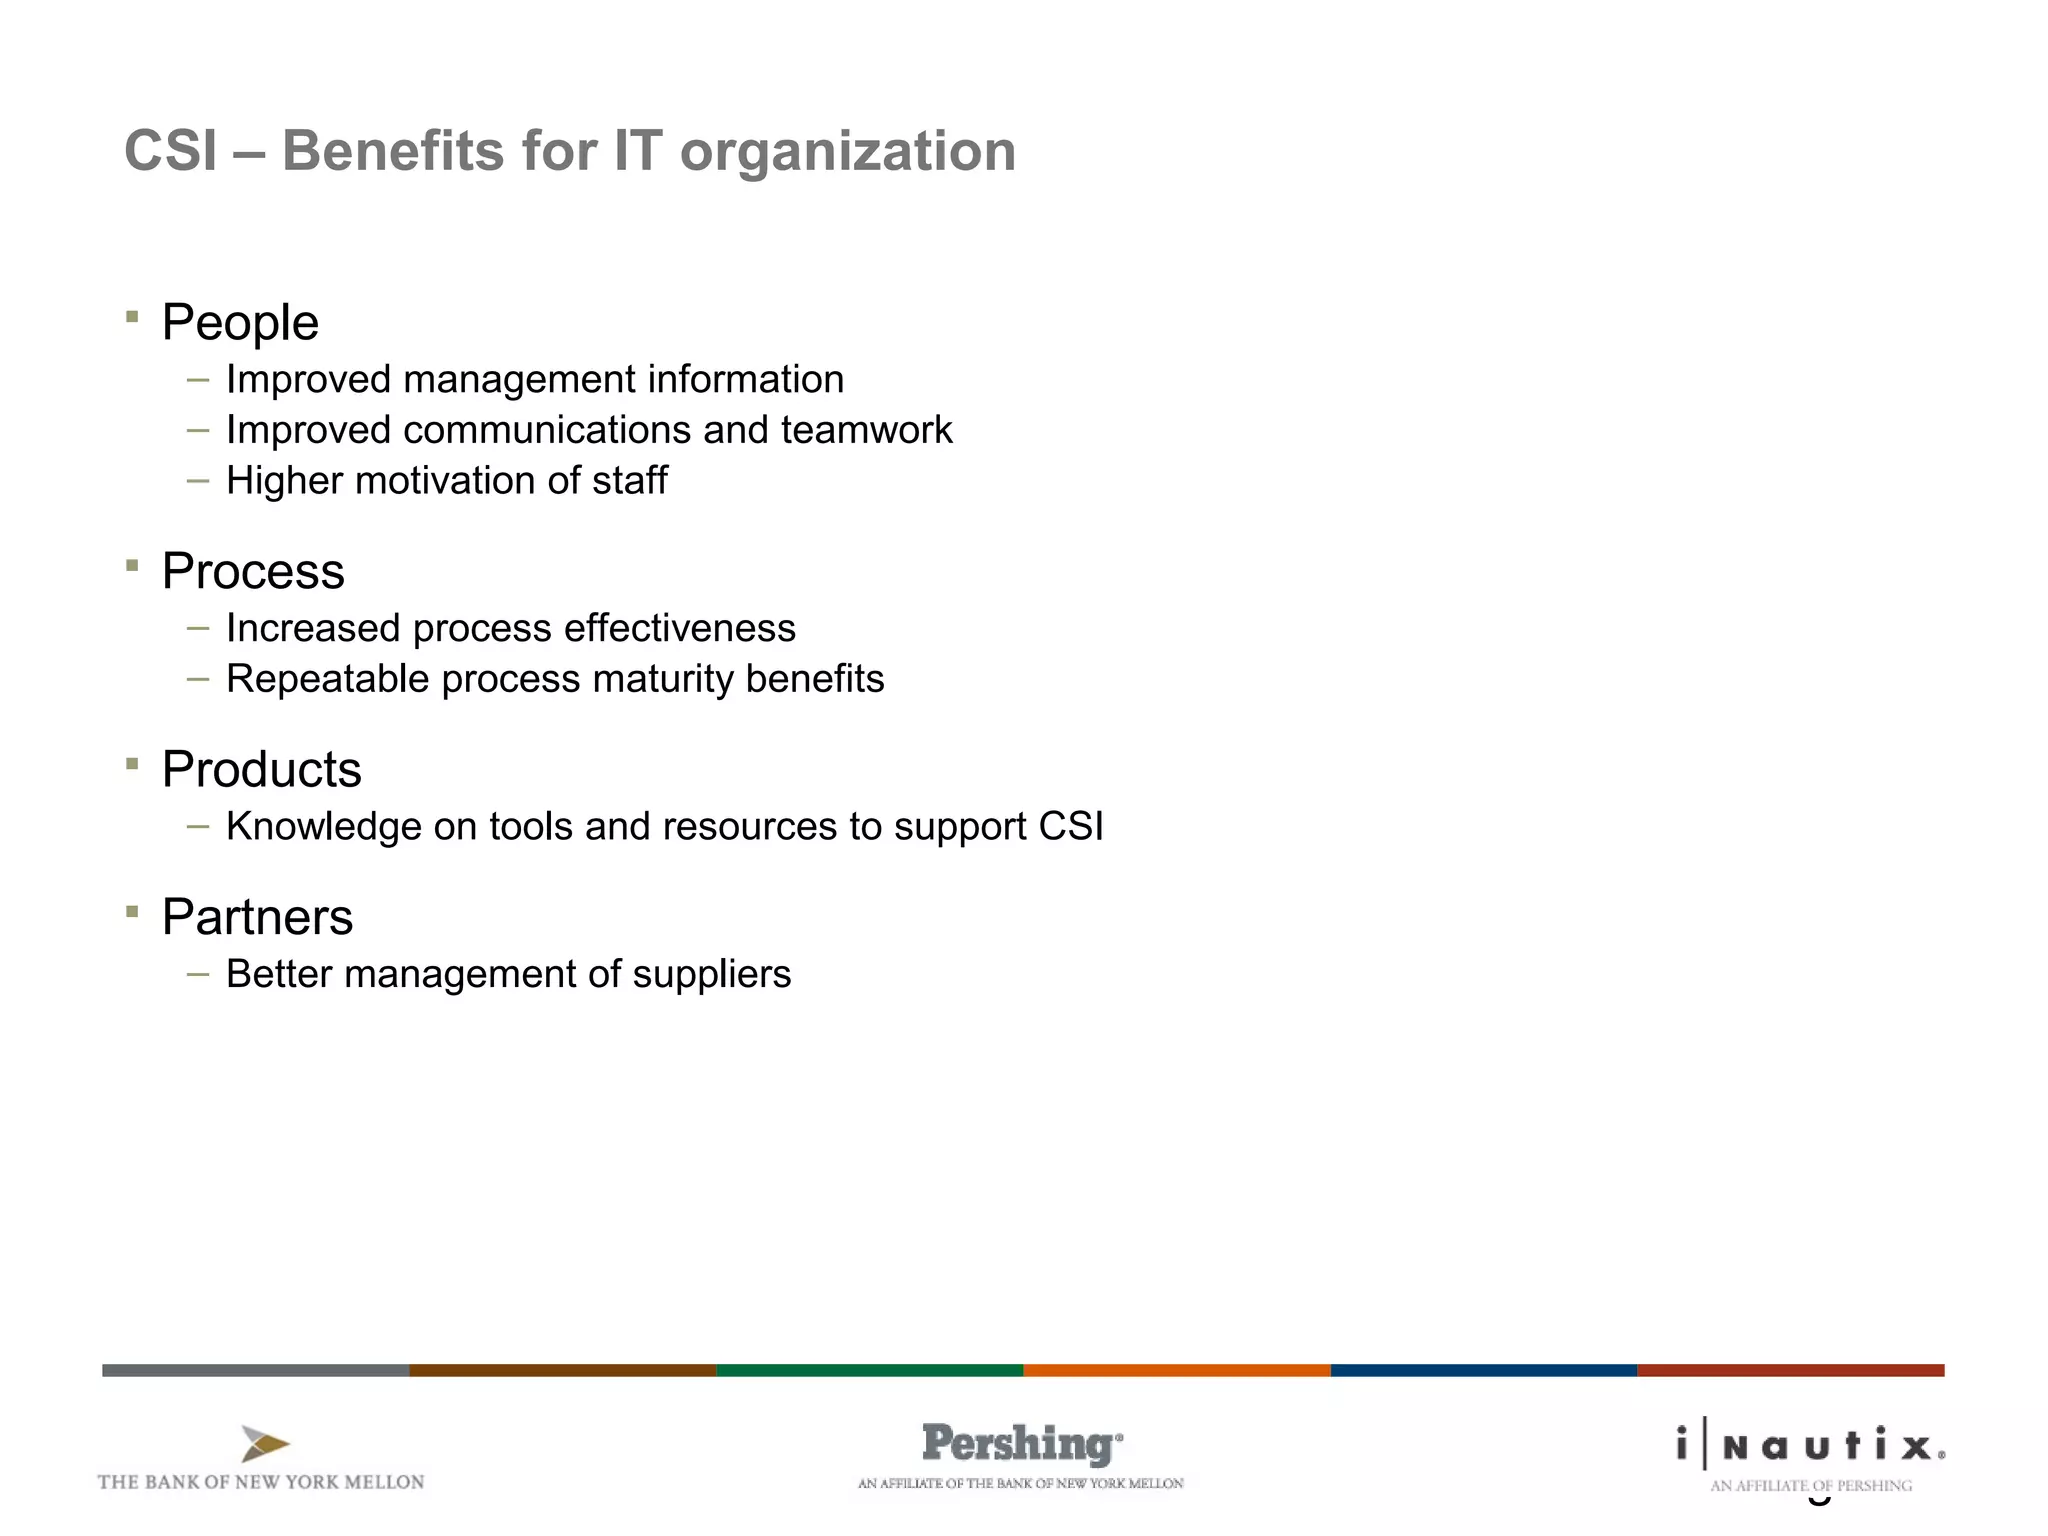
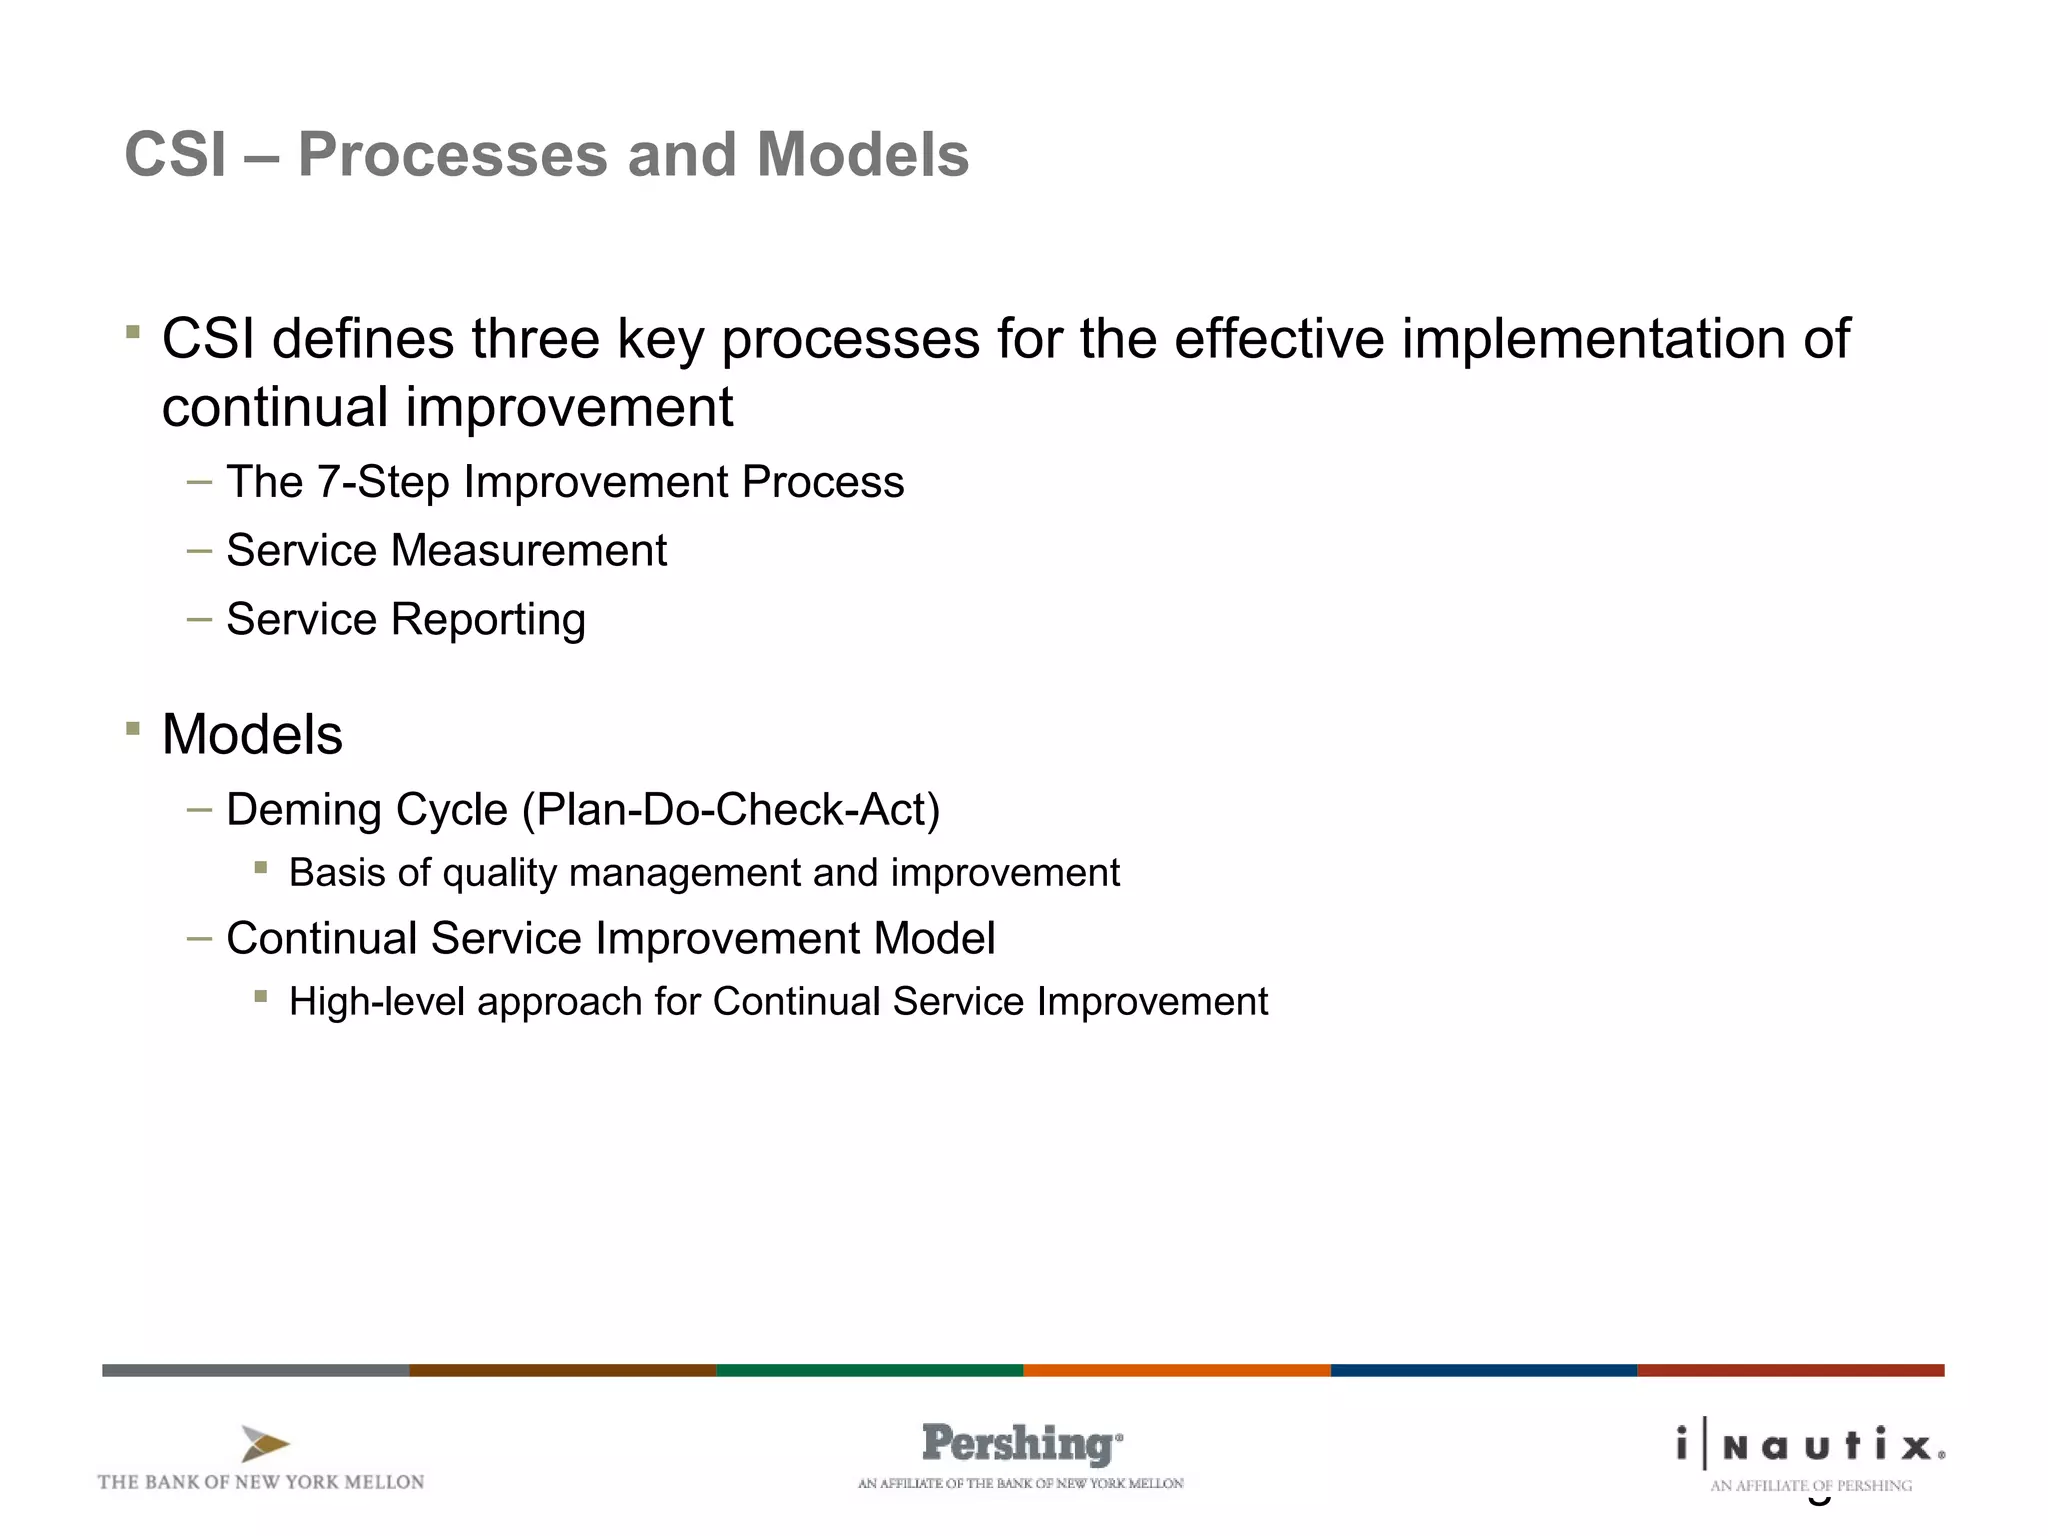
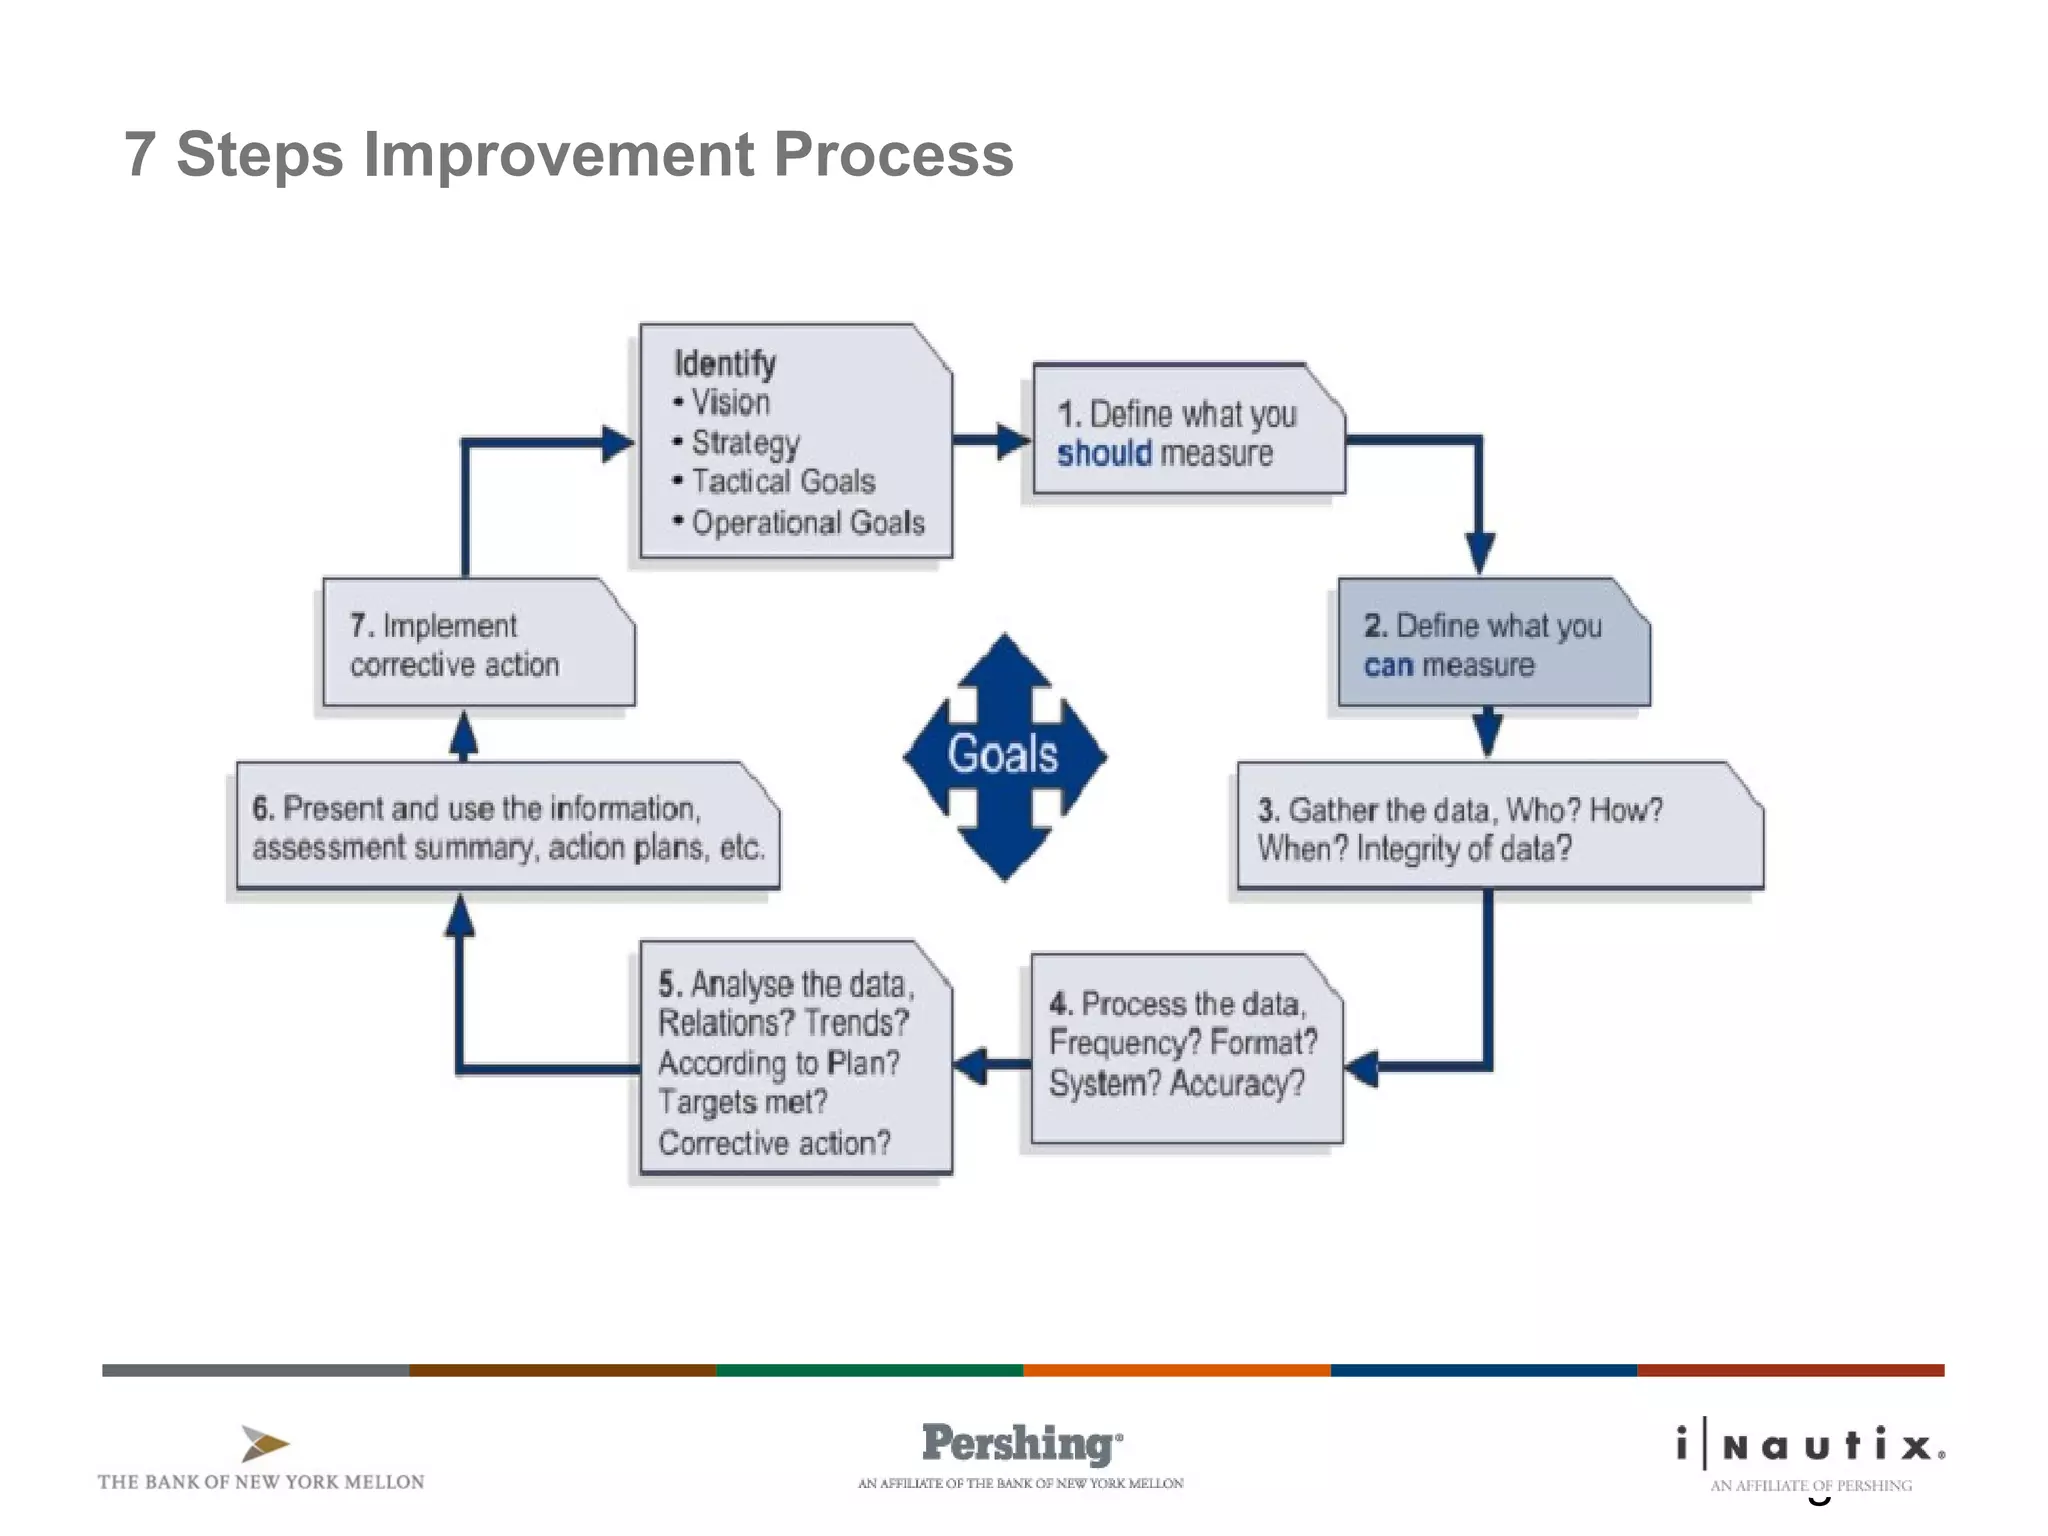
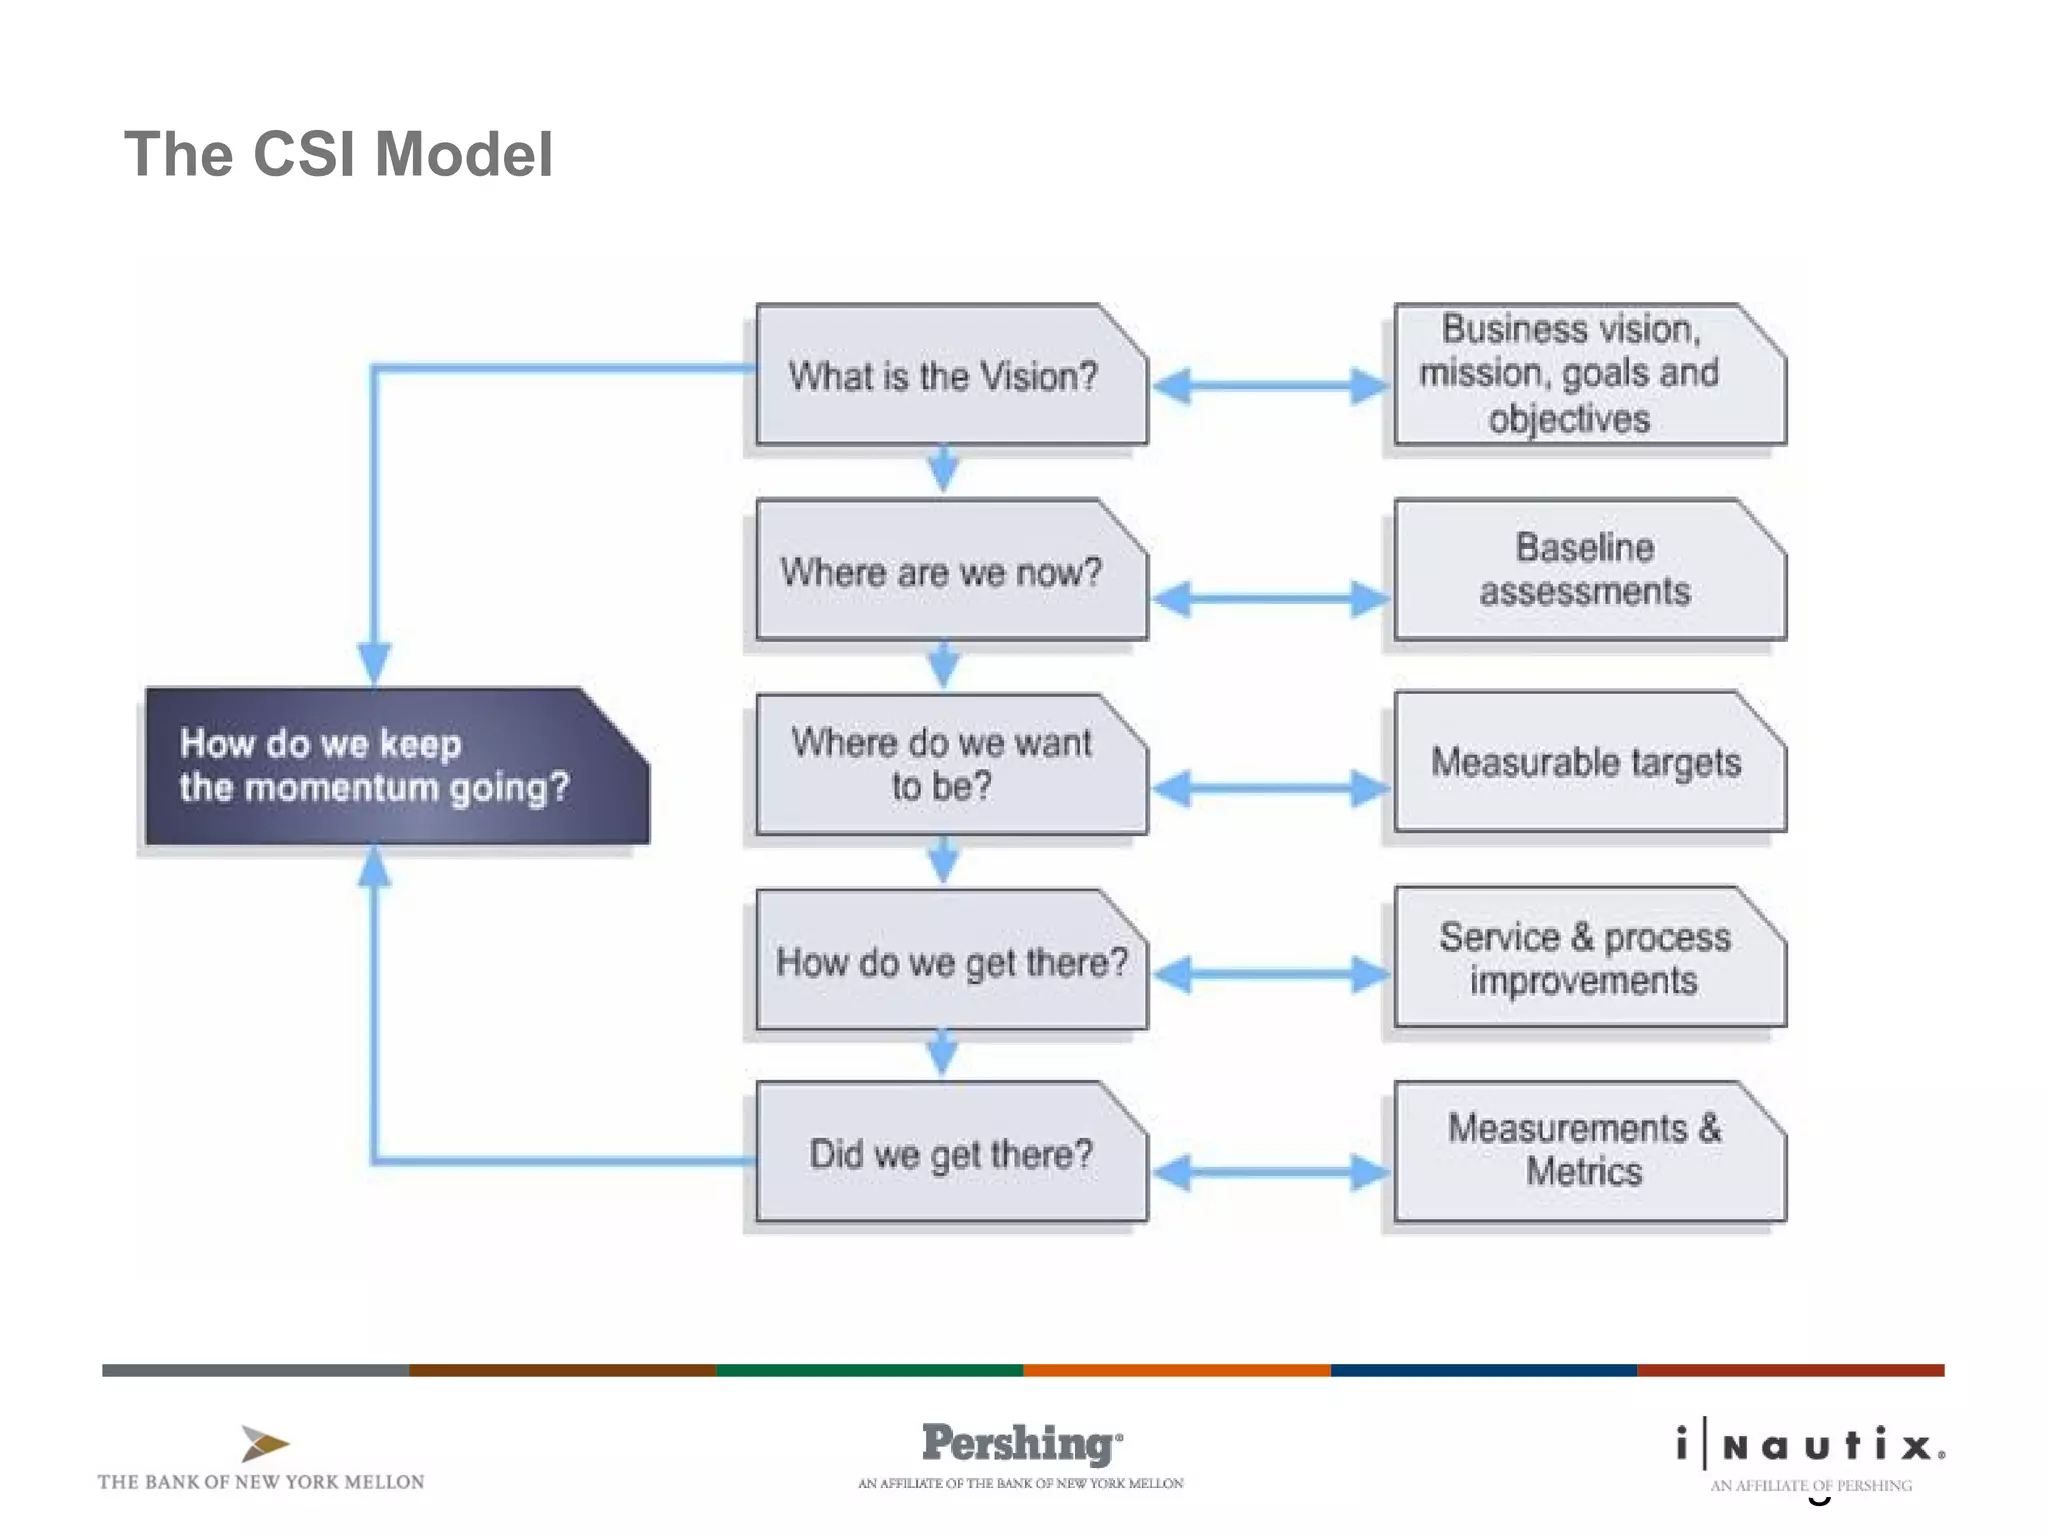
Page 1
Se rvice
De sig n
Se rvice
ITIL
Service
Strategy
Service
Operation
Service
Design
CONTINUAL SERVICE
IMPROVEMENT
Service
Transition
ITIL V3 Core Framework
Continual Service
Improvement
Continuous search for
improvements as part of
the promised service
quality
Page 2
Continual Service Improvement
 CSI focuses on improving the services of the IT organization as well as the
internal processes.
 CSI combines principles, practices and methods from quality management.
Change management and capability improvement,
 CSI is not a new concept, but for most organizations the concept has not
moved beyond the discussion stage.
 Fundamental to the concept of “CSI” is that improvement happens all the
time.
Page 3
CSI - Objectives
 Make recommendations for improvements
 Review and analyze SLA results
 Identify and implement activities to improve IT Services and
Processes
 Improve cost effectiveness without sacrificing customer satisfaction
 Choose and employ quality management methods
Page 4
CSI – Value to the Business
 Improvement needs justification : the benefits must outweigh the
costs.
 Benefits
– Return on Investment (ROI)
– Value on Investment (VOI)
– Intangibles
Page 5
CSI – Benefits to the Business
 Customer benefits
– Better alignment of IT to the business needs
– Higher Reliability and Availability of IT Services
– Higher customer satisfaction
 Financial benefits
– Increased productivity
– Reduction of cost
 Innovation benefits
– Greater flexibility for the Business by faster and improved response of IT
Page 6
CSI – Benefits for IT organization
 People
– Improved management information
– Improved communications and teamwork
– Higher motivation of staff
 Process
– Increased process effectiveness
– Repeatable process maturity benefits
 Products
– Knowledge on tools and resources to support CSI
 Partners
– Better management of suppliers
Page 7
CSI – Processes and Models
 CSI defines three key processes for the effective implementation of
continual improvement
– The 7-Step Improvement Process
– Service Measurement
– Service Reporting
 Models
– Deming Cycle (Plan-Do-Check-Act)
 Basis of quality management and improvement
– Continual Service Improvement Model
 High-level approach for Continual Service Improvement
Page 8
7 Steps Improvement Process
Page 9
Step 1 – Define Data Requirement
 Identify & Link
– Vision, Mission, Goals & Objectives
– Critical Success Factors
– Service Level Targets
– Staff Roles & Responsibilities
Page 10
Step 2 – Define Data Capability
 Identify Data Collection Capabilities
– Service Managements Tools
– Monitoring Capability
– Reporting Tools
– Query Tools
– Modeling Tools
 Identify Data Structures
– Processes, Procedures & Work Instructions
– Reports & Databases
Page 11
Step 3 – Gather Data
 Monitor
– Detecting Exceptions (….. is it down?)
– Detecting Resolutions (…..is it up?)
 Exhibit Flexibility to Accommodate Dynamic Needs
– Avoids Being Overwhelmed by Data
– Spotlight Approach
– Requires Close Cooperation Between CSI & SO
 Three Types of Metrics
– Technology – component or application-based metrics
– Process - Critical Success Factor(CSF), KPI
– Service - End to end metrics
Page 12
Step 4 – Process Data
 Frequency
 Format
 Tools
 Quality Assurance
Page 13
Step 5 – Analyze Data
 Trends
– Positive & Negative
 Corrective Action Requirements
 Conformance to Plan
 Meeting Established Targets
 Identification of Structural Problems
 Financial Impact of Service Gap
Page 14
Step 6 – Present & User Data
 Turn Information into Wisdom
 Audience
– Business Process Owners
– Service Owners
– Management
 Business & IT
– Internal IT
 Plan
 Coordinate
 Schedule
 Identify Incremental Improvement
Page 15
Step 7 – Implement Corrective Action
 Actions
– Optimize
– Improve
– Corrective Services
 Implement via Service
– Strategy
– Design
– Transition
– Operations
 The 7-Step Improvement Process is continual and loops back to the
beginning.
Page 16
Service Measurement
 There are four basic reasons to monitor and measure, to:
– validate previous decisions that have been made
– direct activities in order to meet set targets - this is the most prevalent reason for
monitoring and measuring
– justify that a course of action is required, with factual evidence or
– intervene at the appropriate point and take corrective action.
 There are three types of metrics that an organization needs to collect to
support CSI activities as well as other process activities.
– Technology metrics: often associated with component and applicationbased
metrics such as performance, availability.
– Process metrics: captured in the form of Critical Success Factors (CSFs), Key
Performance Indicators (KPIs) and activity metrics.
– Service metrics: the results of the end-to-end service.
 Component/technology metrics are used to compute the service metrics.
Page 17
Service Reporting
 A significant amount of data is collated and monitored by IT in the
daily delivery of quality service to the business, but only a small
subset is of real interest and importance to the business.
 The business likes to see a historical representation of the past
period’s performance that portrays their experience, but it is more
concerned with those historical events that continue to be a threat
going forward, and how IT intends to mitigate against such threats.
Page 18
PDCA (Deming Cycle)
 PDCA provides a method for
improving any process systematically
 The goal is to identify errors or
omissions that cause the output of
the process to fall short of
expectations
Page 19
Four steps in the PDCA cycle
 Plan how to improve a service first by identifying and measuring Key
Performance Indicators (KPIs)
 Do (implement) changes designed to improve the KPIs.
 Check KPI performance to evaluate if the changes are achieving the
desired result.
 Act (implement) changes on a larger scale if the experiment is
successful.
Page 20
PDCA (Deming Cycle)
 PDCA is useful anywhere the objective is improved performance
Page 21
The CSI Model
Page 22
Frameworks, Models & Quality Systems
 Frameworks
– ITIL, CobiT, PMBok, Prince2
 Models
– CMM, CMMI, eSCM
 Standards
– ISO 20000, ISO27000-2005, ISO 17799-2005, ISO 15504, ISO 19770-2006
 Quality Systems
– Six Sigma & Lean Six Sigma (DMAIC)
 Define, Measure, Analyze, Improve, Control
Page 23
CSI Roles
 Service Manager
 CSI Manager
 Service Owner
 Process Owner
 Service Knowledge Manager
 Reporting Analyst
Page 24
Expectation after the ITIL@iNautix training
Page 25
Get Ready for Internal Certification
Page 26

7 itil v3 csi 7 v1.8

  • 1.
    Page 1 Se rvice Desig n Se rvice ITIL Service Strategy Service Operation Service Design CONTINUAL SERVICE IMPROVEMENT Service Transition ITIL V3 Core Framework Continual Service Improvement Continuous search for improvements as part of the promised service quality
  • 2.
    Page 2 Continual ServiceImprovement  CSI focuses on improving the services of the IT organization as well as the internal processes.  CSI combines principles, practices and methods from quality management. Change management and capability improvement,  CSI is not a new concept, but for most organizations the concept has not moved beyond the discussion stage.  Fundamental to the concept of “CSI” is that improvement happens all the time.
  • 3.
    Page 3 CSI -Objectives  Make recommendations for improvements  Review and analyze SLA results  Identify and implement activities to improve IT Services and Processes  Improve cost effectiveness without sacrificing customer satisfaction  Choose and employ quality management methods
  • 4.
    Page 4 CSI –Value to the Business  Improvement needs justification : the benefits must outweigh the costs.  Benefits – Return on Investment (ROI) – Value on Investment (VOI) – Intangibles
  • 5.
    Page 5 CSI –Benefits to the Business  Customer benefits – Better alignment of IT to the business needs – Higher Reliability and Availability of IT Services – Higher customer satisfaction  Financial benefits – Increased productivity – Reduction of cost  Innovation benefits – Greater flexibility for the Business by faster and improved response of IT
  • 6.
    Page 6 CSI –Benefits for IT organization  People – Improved management information – Improved communications and teamwork – Higher motivation of staff  Process – Increased process effectiveness – Repeatable process maturity benefits  Products – Knowledge on tools and resources to support CSI  Partners – Better management of suppliers
  • 7.
    Page 7 CSI –Processes and Models  CSI defines three key processes for the effective implementation of continual improvement – The 7-Step Improvement Process – Service Measurement – Service Reporting  Models – Deming Cycle (Plan-Do-Check-Act)  Basis of quality management and improvement – Continual Service Improvement Model  High-level approach for Continual Service Improvement
  • 8.
    Page 8 7 StepsImprovement Process
  • 9.
    Page 9 Step 1– Define Data Requirement  Identify & Link – Vision, Mission, Goals & Objectives – Critical Success Factors – Service Level Targets – Staff Roles & Responsibilities
  • 10.
    Page 10 Step 2– Define Data Capability  Identify Data Collection Capabilities – Service Managements Tools – Monitoring Capability – Reporting Tools – Query Tools – Modeling Tools  Identify Data Structures – Processes, Procedures & Work Instructions – Reports & Databases
  • 11.
    Page 11 Step 3– Gather Data  Monitor – Detecting Exceptions (….. is it down?) – Detecting Resolutions (…..is it up?)  Exhibit Flexibility to Accommodate Dynamic Needs – Avoids Being Overwhelmed by Data – Spotlight Approach – Requires Close Cooperation Between CSI & SO  Three Types of Metrics – Technology – component or application-based metrics – Process - Critical Success Factor(CSF), KPI – Service - End to end metrics
  • 12.
    Page 12 Step 4– Process Data  Frequency  Format  Tools  Quality Assurance
  • 13.
    Page 13 Step 5– Analyze Data  Trends – Positive & Negative  Corrective Action Requirements  Conformance to Plan  Meeting Established Targets  Identification of Structural Problems  Financial Impact of Service Gap
  • 14.
    Page 14 Step 6– Present & User Data  Turn Information into Wisdom  Audience – Business Process Owners – Service Owners – Management  Business & IT – Internal IT  Plan  Coordinate  Schedule  Identify Incremental Improvement
  • 15.
    Page 15 Step 7– Implement Corrective Action  Actions – Optimize – Improve – Corrective Services  Implement via Service – Strategy – Design – Transition – Operations  The 7-Step Improvement Process is continual and loops back to the beginning.
  • 16.
    Page 16 Service Measurement There are four basic reasons to monitor and measure, to: – validate previous decisions that have been made – direct activities in order to meet set targets - this is the most prevalent reason for monitoring and measuring – justify that a course of action is required, with factual evidence or – intervene at the appropriate point and take corrective action.  There are three types of metrics that an organization needs to collect to support CSI activities as well as other process activities. – Technology metrics: often associated with component and applicationbased metrics such as performance, availability. – Process metrics: captured in the form of Critical Success Factors (CSFs), Key Performance Indicators (KPIs) and activity metrics. – Service metrics: the results of the end-to-end service.  Component/technology metrics are used to compute the service metrics.
  • 17.
    Page 17 Service Reporting A significant amount of data is collated and monitored by IT in the daily delivery of quality service to the business, but only a small subset is of real interest and importance to the business.  The business likes to see a historical representation of the past period’s performance that portrays their experience, but it is more concerned with those historical events that continue to be a threat going forward, and how IT intends to mitigate against such threats.
  • 18.
    Page 18 PDCA (DemingCycle)  PDCA provides a method for improving any process systematically  The goal is to identify errors or omissions that cause the output of the process to fall short of expectations
  • 19.
    Page 19 Four stepsin the PDCA cycle  Plan how to improve a service first by identifying and measuring Key Performance Indicators (KPIs)  Do (implement) changes designed to improve the KPIs.  Check KPI performance to evaluate if the changes are achieving the desired result.  Act (implement) changes on a larger scale if the experiment is successful.
  • 20.
    Page 20 PDCA (DemingCycle)  PDCA is useful anywhere the objective is improved performance
  • 21.
  • 22.
    Page 22 Frameworks, Models& Quality Systems  Frameworks – ITIL, CobiT, PMBok, Prince2  Models – CMM, CMMI, eSCM  Standards – ISO 20000, ISO27000-2005, ISO 17799-2005, ISO 15504, ISO 19770-2006  Quality Systems – Six Sigma & Lean Six Sigma (DMAIC)  Define, Measure, Analyze, Improve, Control
  • 23.
    Page 23 CSI Roles Service Manager  CSI Manager  Service Owner  Process Owner  Service Knowledge Manager  Reporting Analyst
  • 24.
    Page 24 Expectation afterthe ITIL@iNautix training
  • 25.
    Page 25 Get Readyfor Internal Certification
  • 26.

Editor's Notes

  • #20 Plan how to improve a service first by identifying and measuring Key Performance Indicators (KPIs) and come up with ideas for improving them. Do (implement) changes designed to improve the KPIs. Try to minimize disruption while testing whether the changes will work or not. Check KPI performance to evaluate if the changes are achieving the desired result. Act (implement) changes on a larger scale if the experiment is successful. Example: The KPI (Key Performance Indicators) for Incident management are: Percentage of Incidents handled within agreed resolution time Percentage of Incidents assigned incorrectly Percentage of Incidents resolved by the Service Desk ( and by the networking team, etc.) Number of Incidents processed per agent.