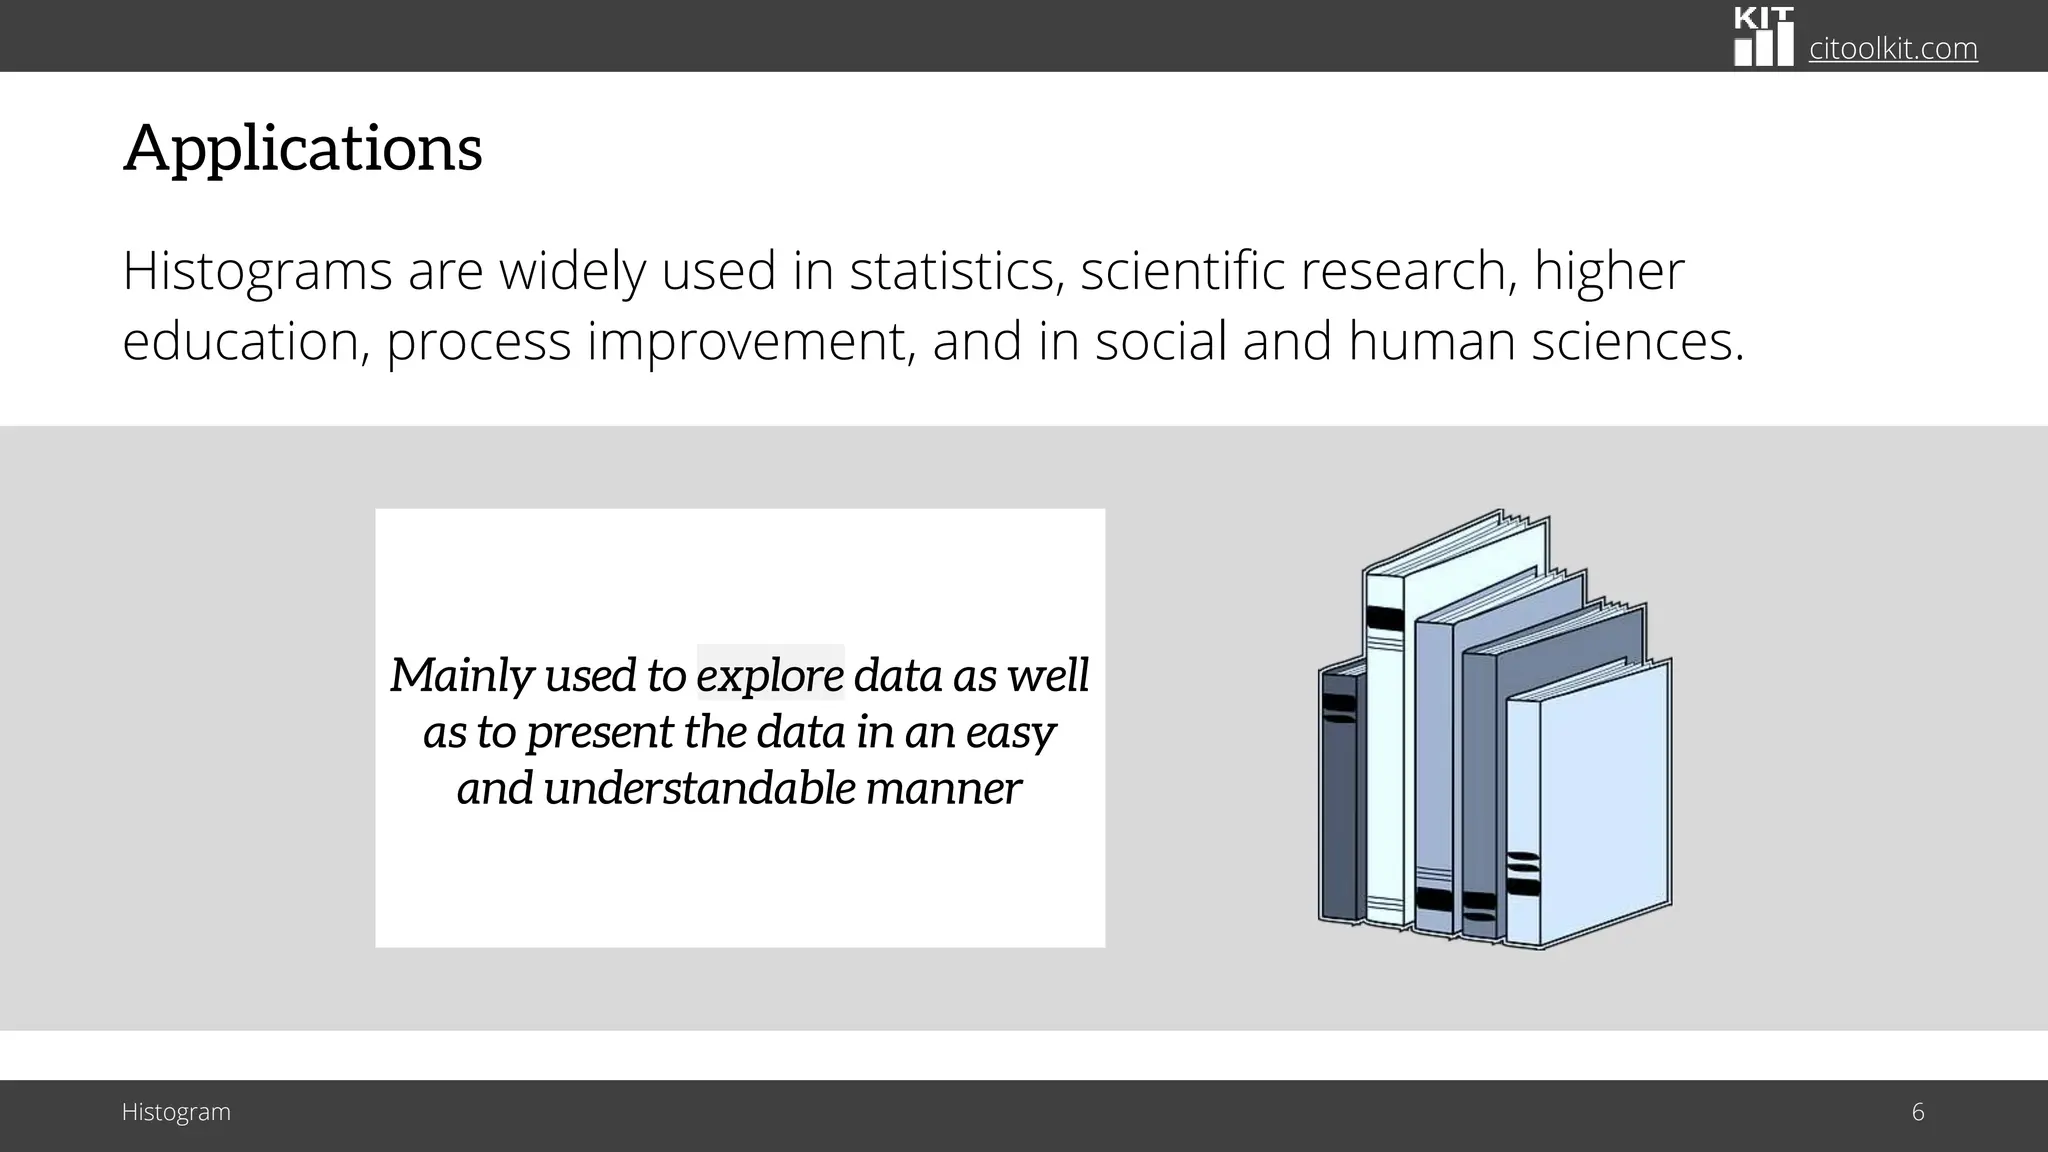
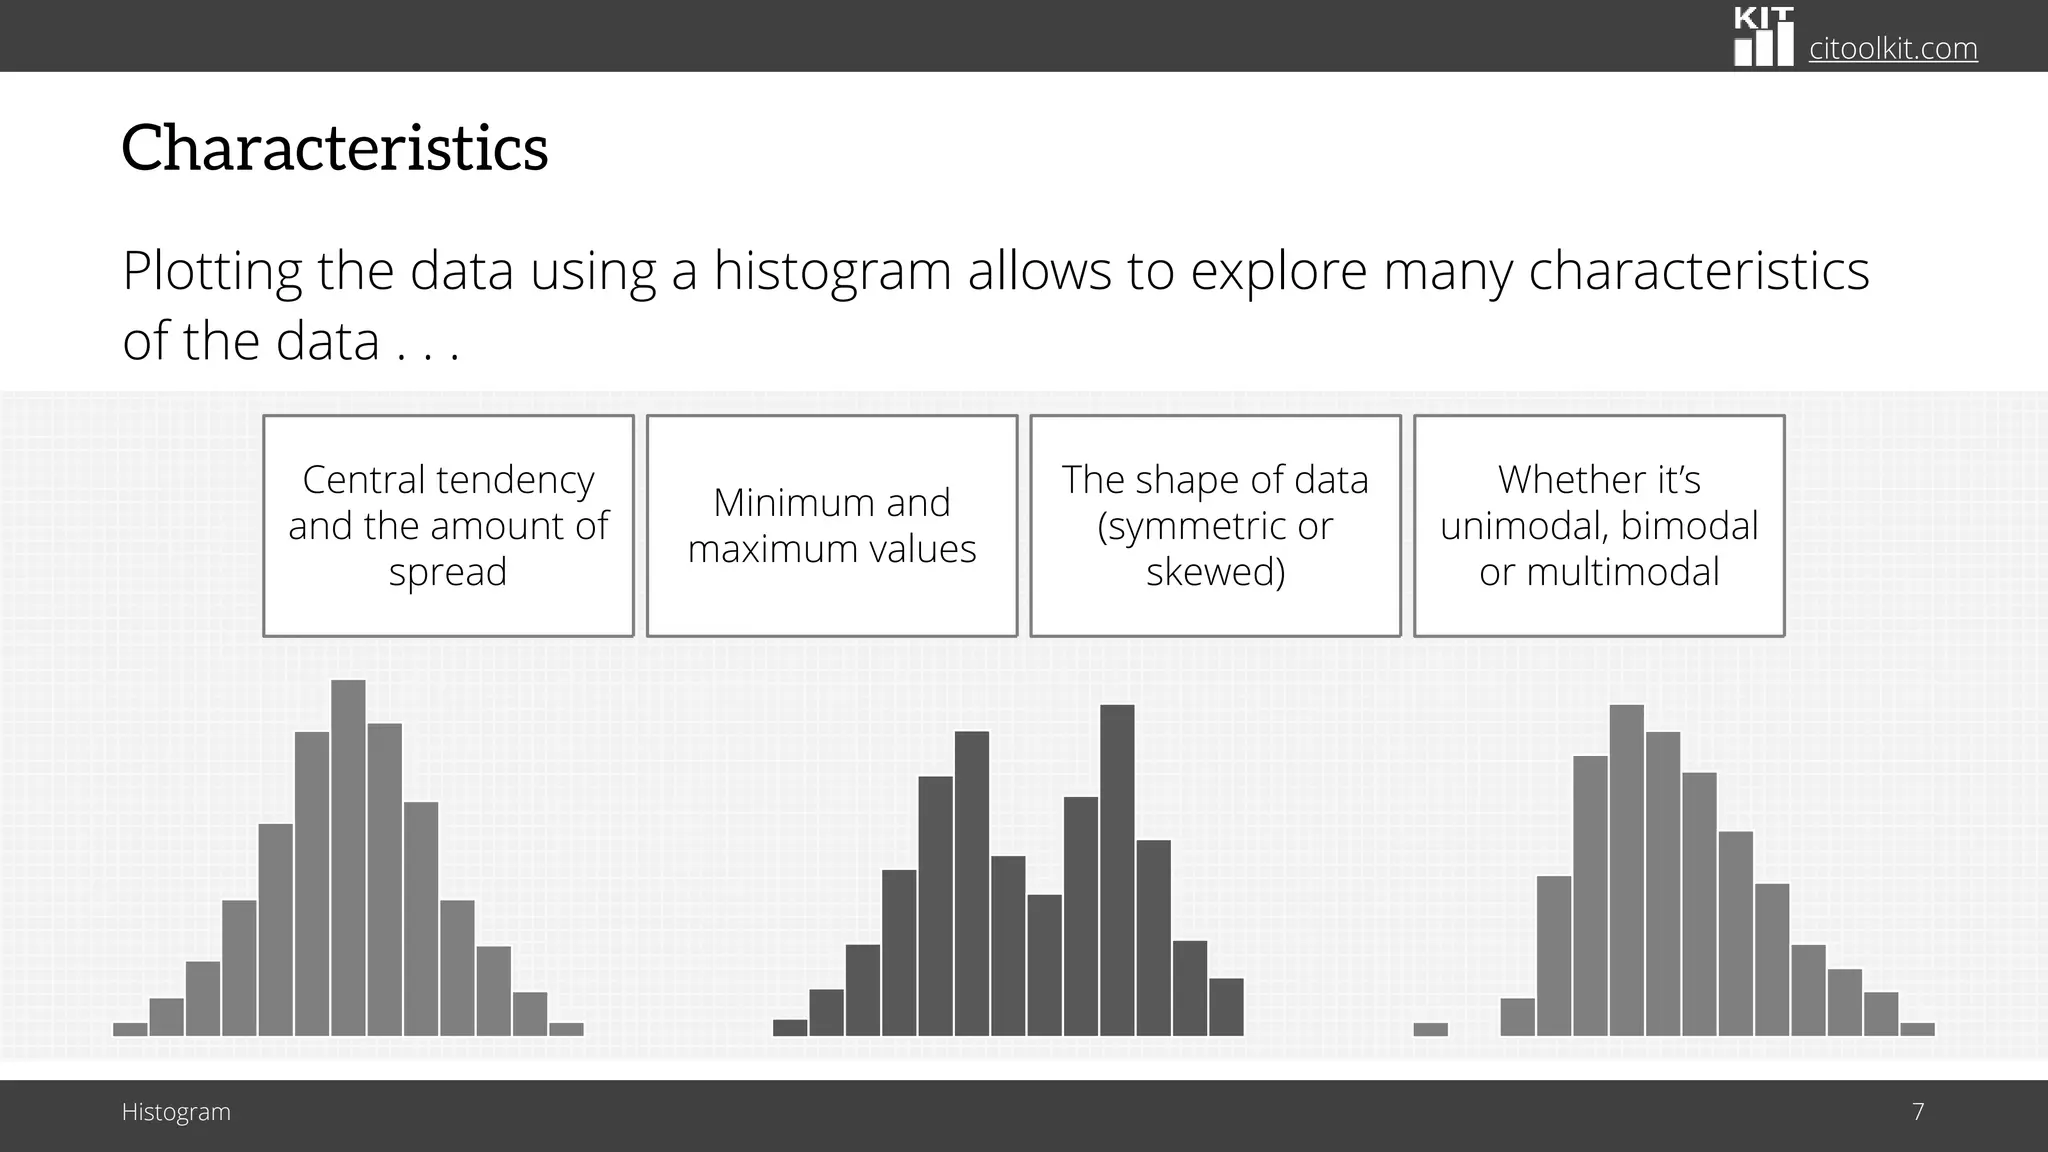
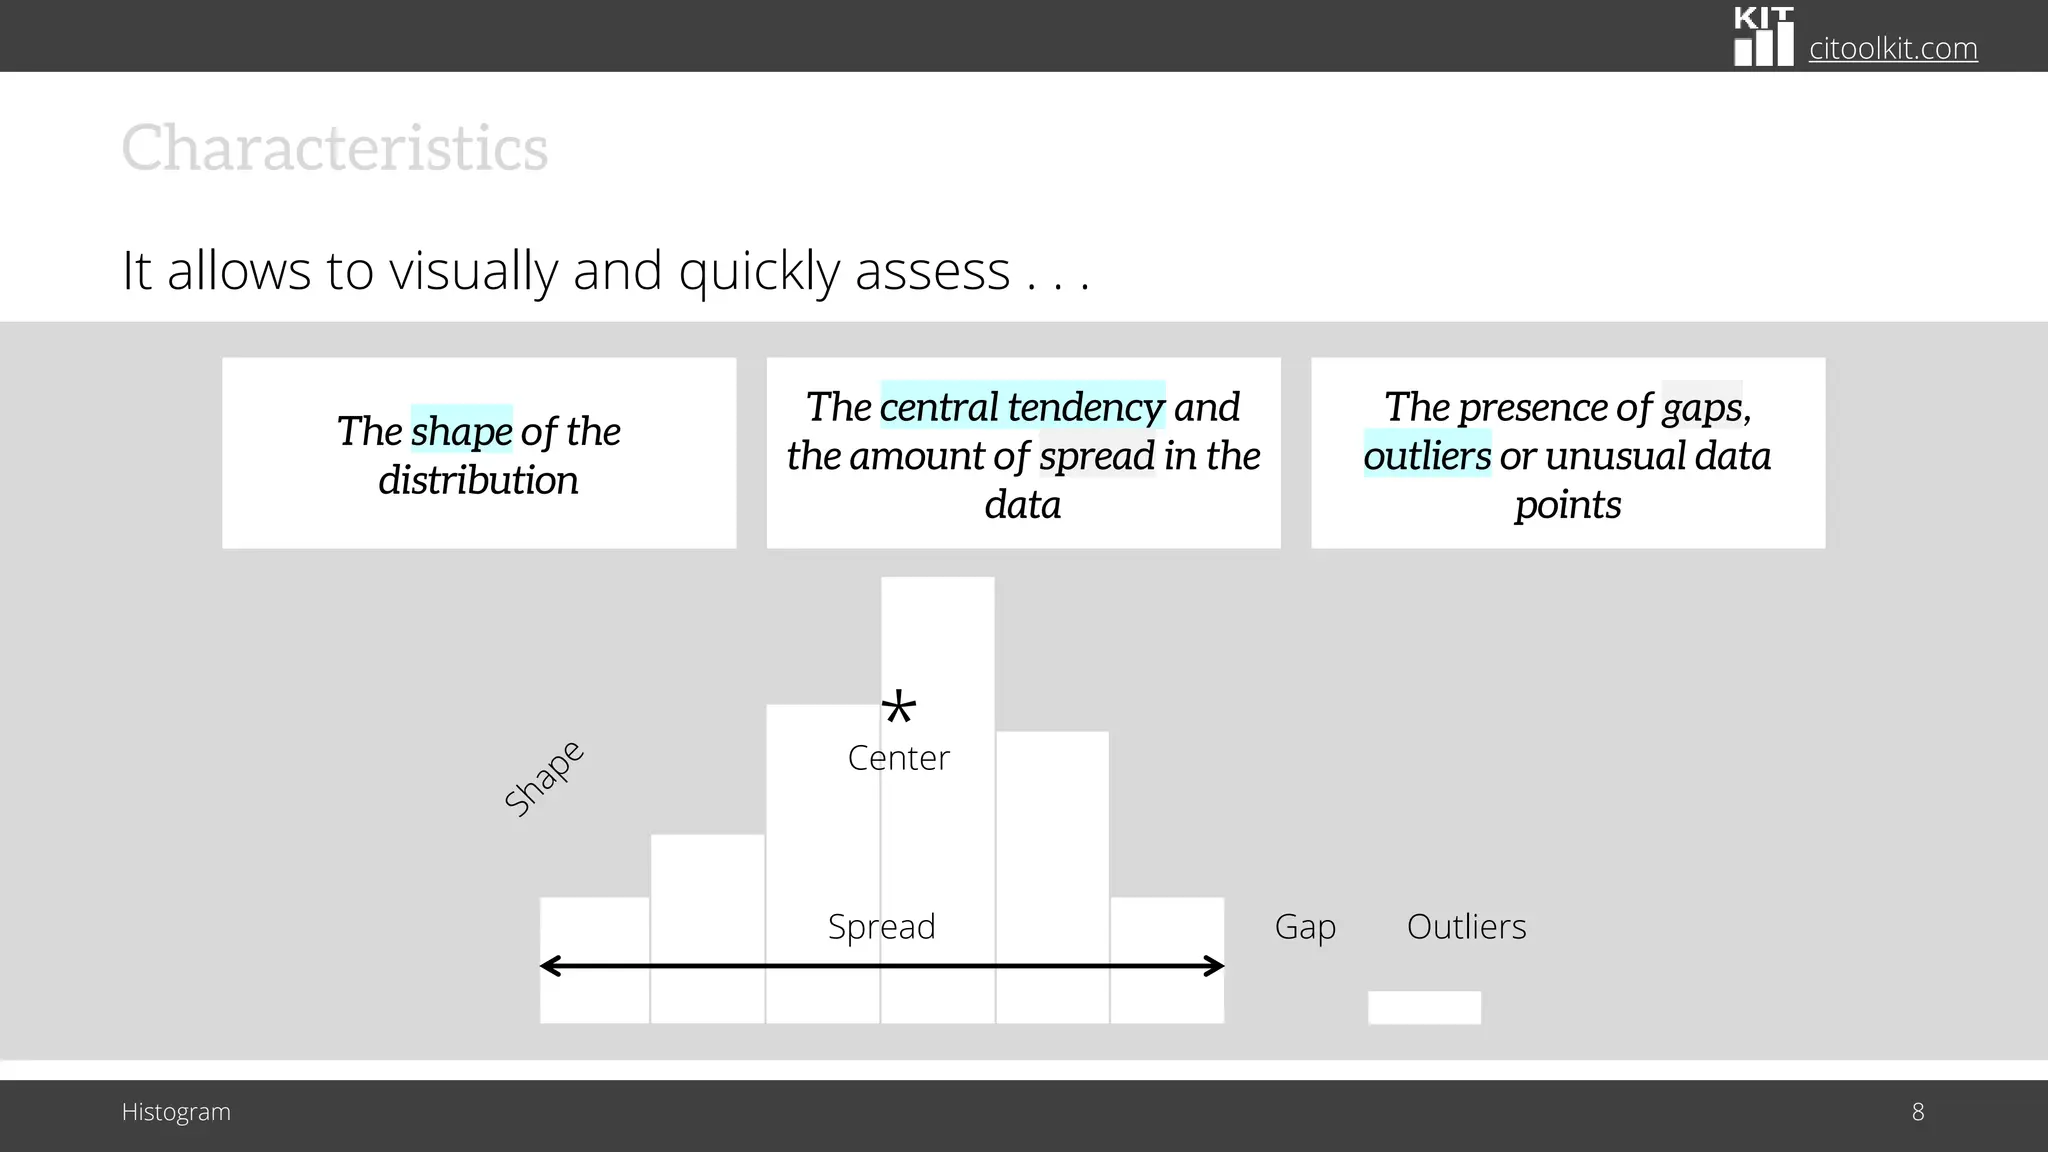
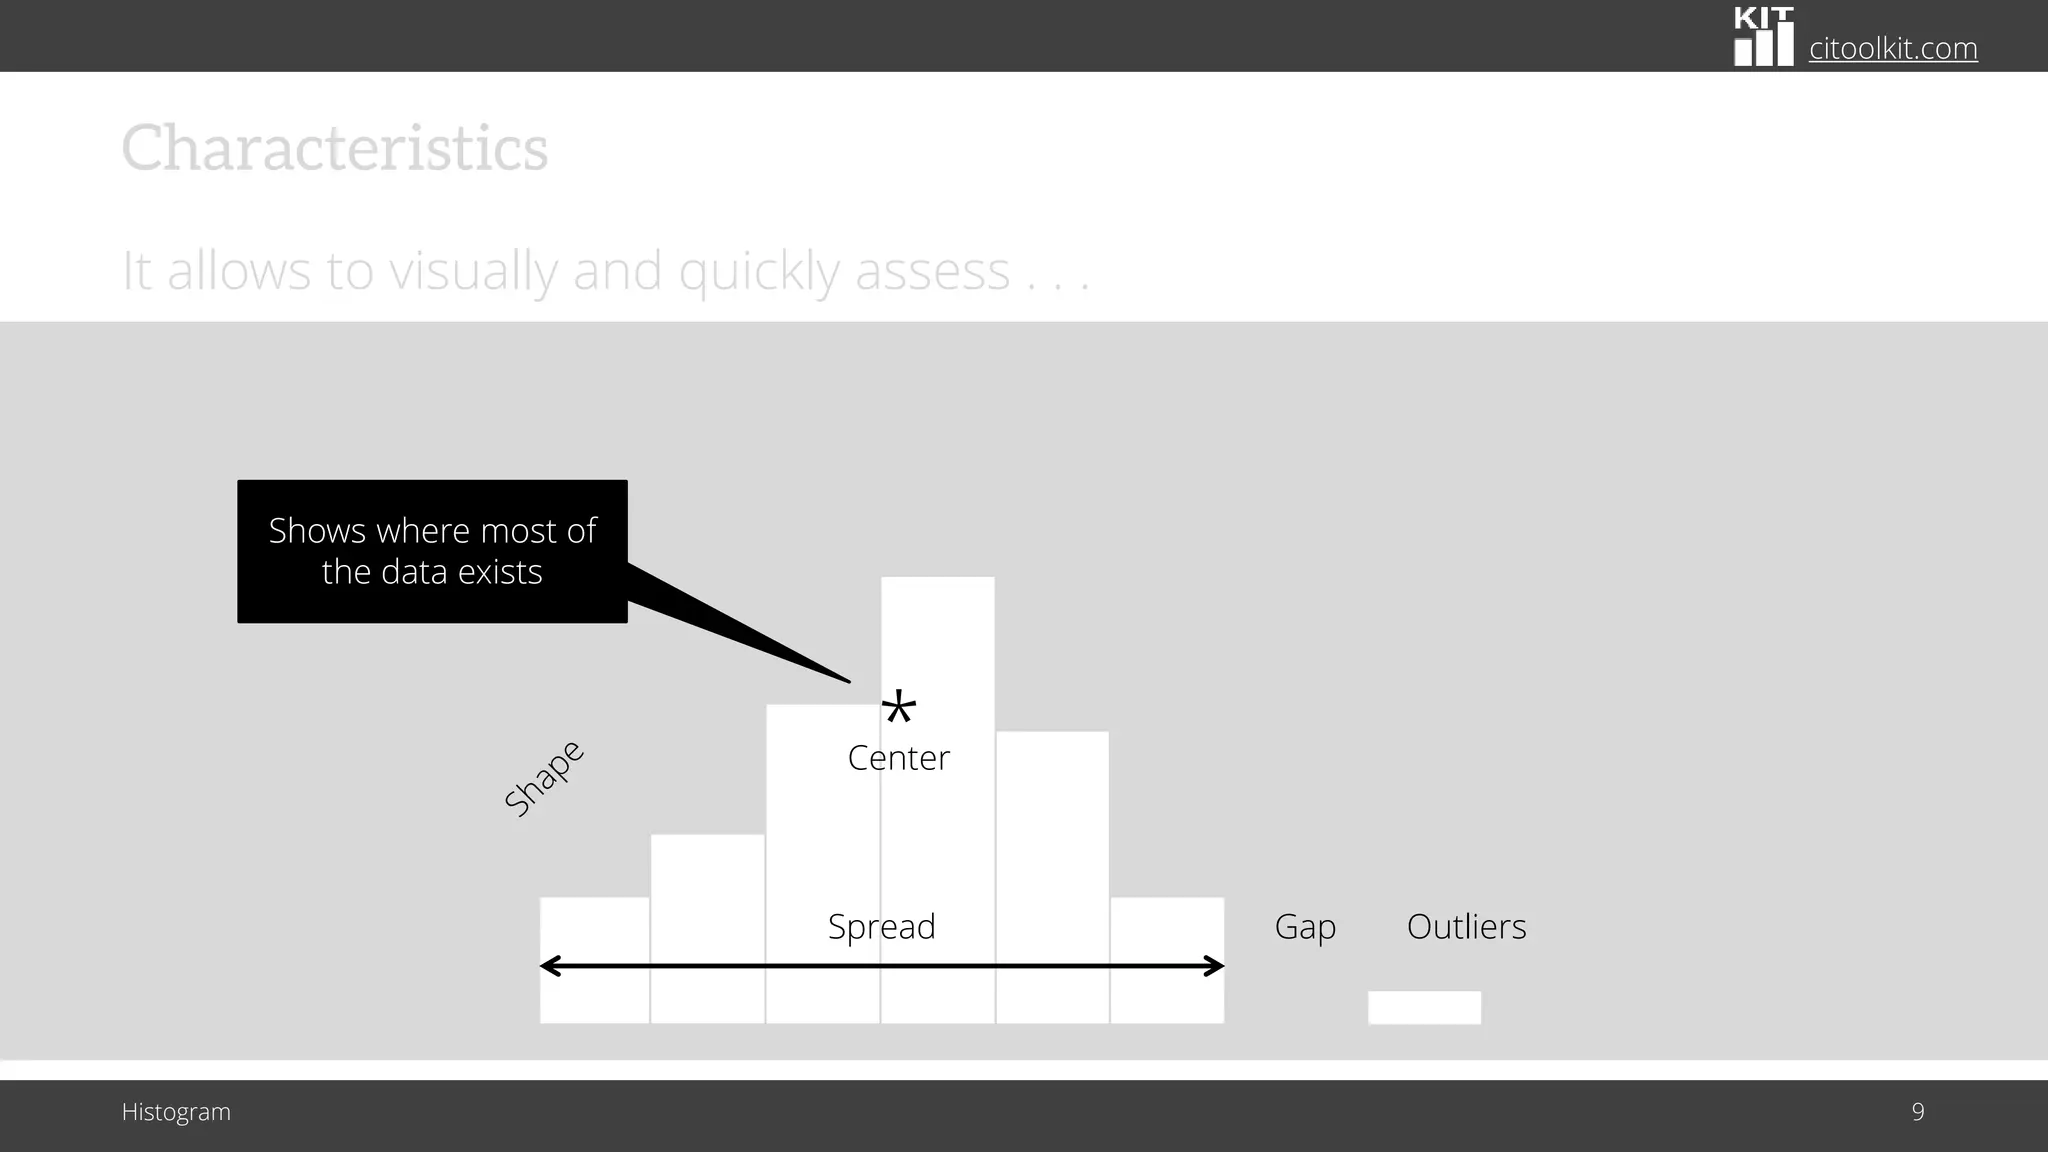
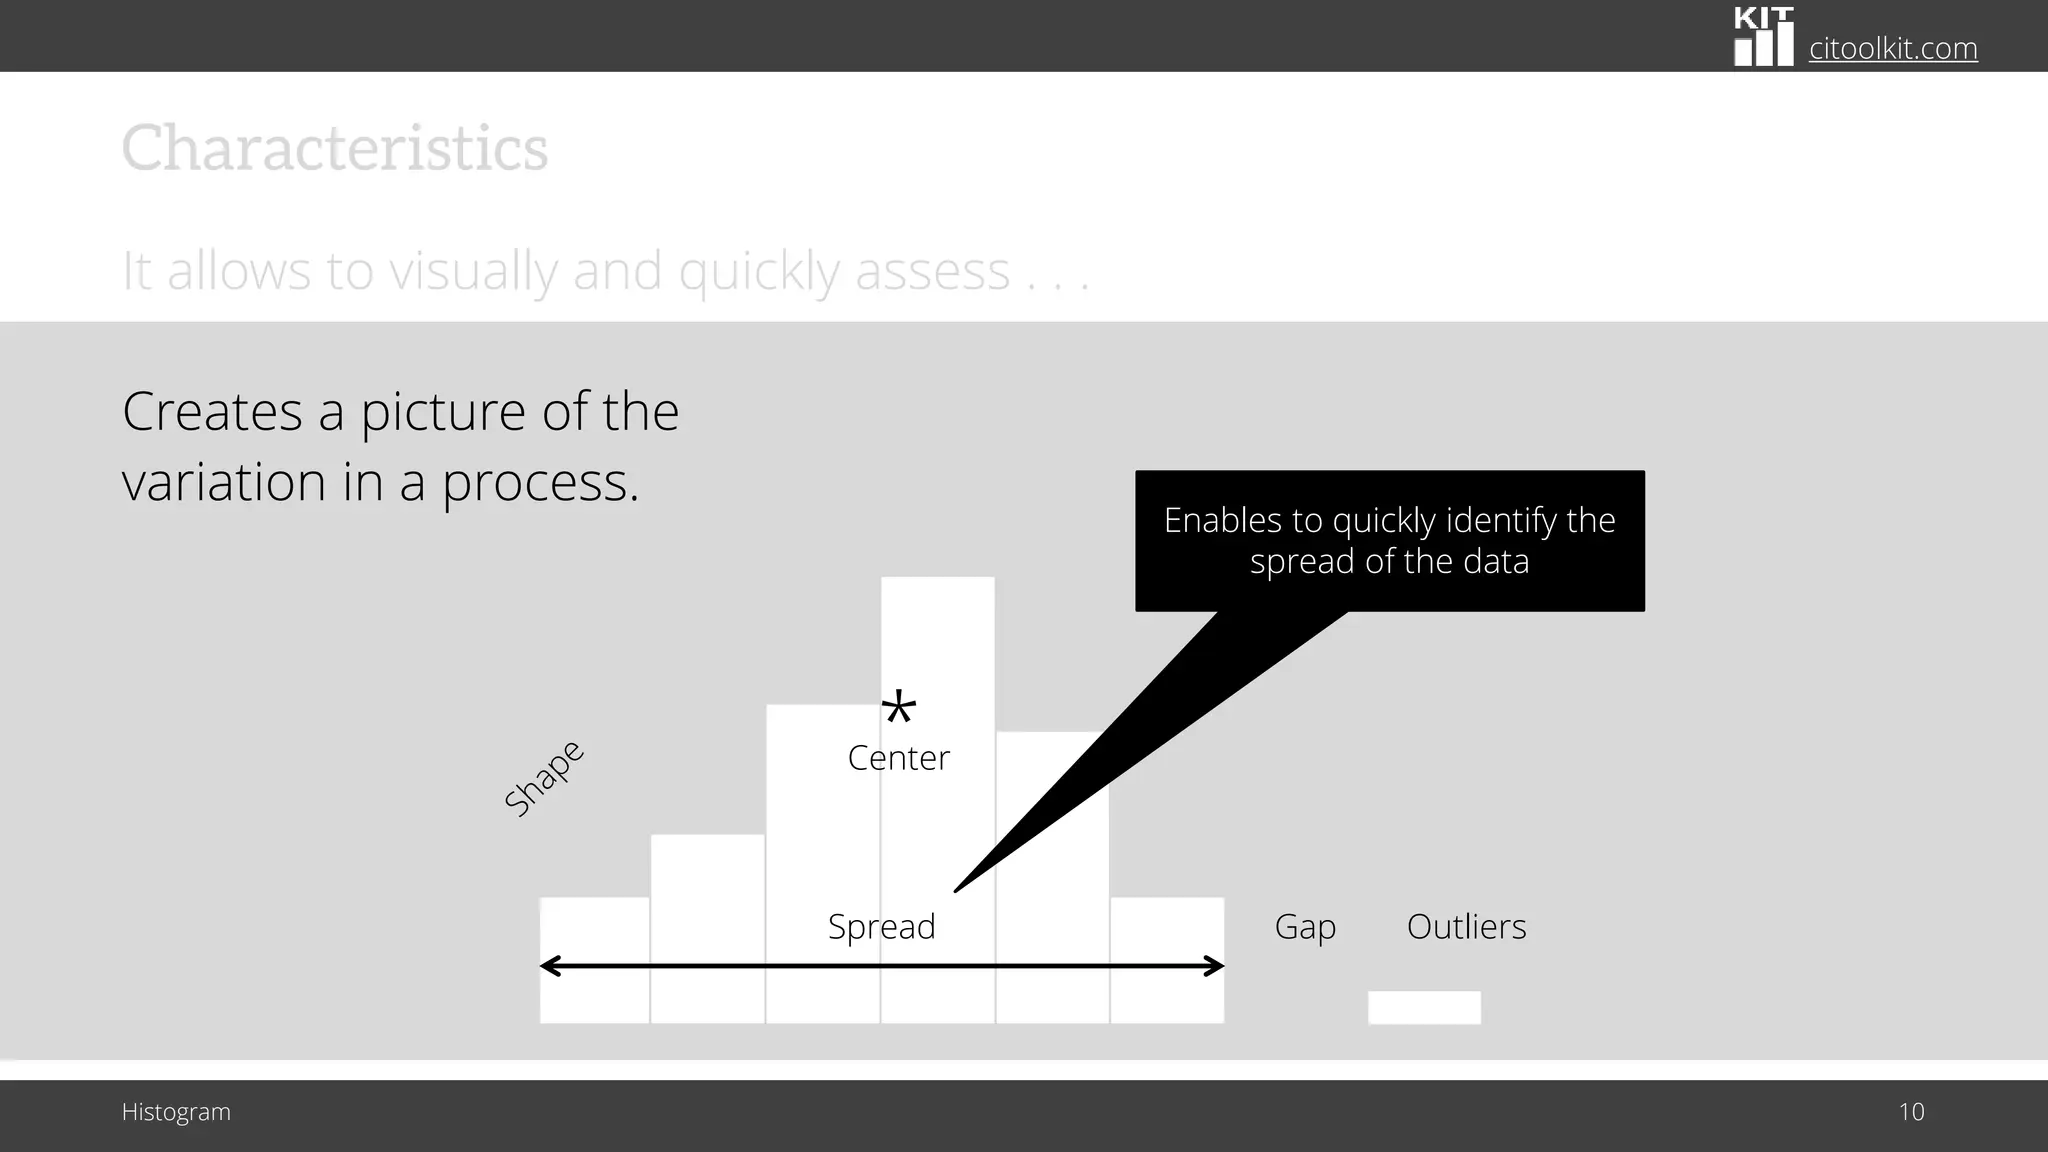
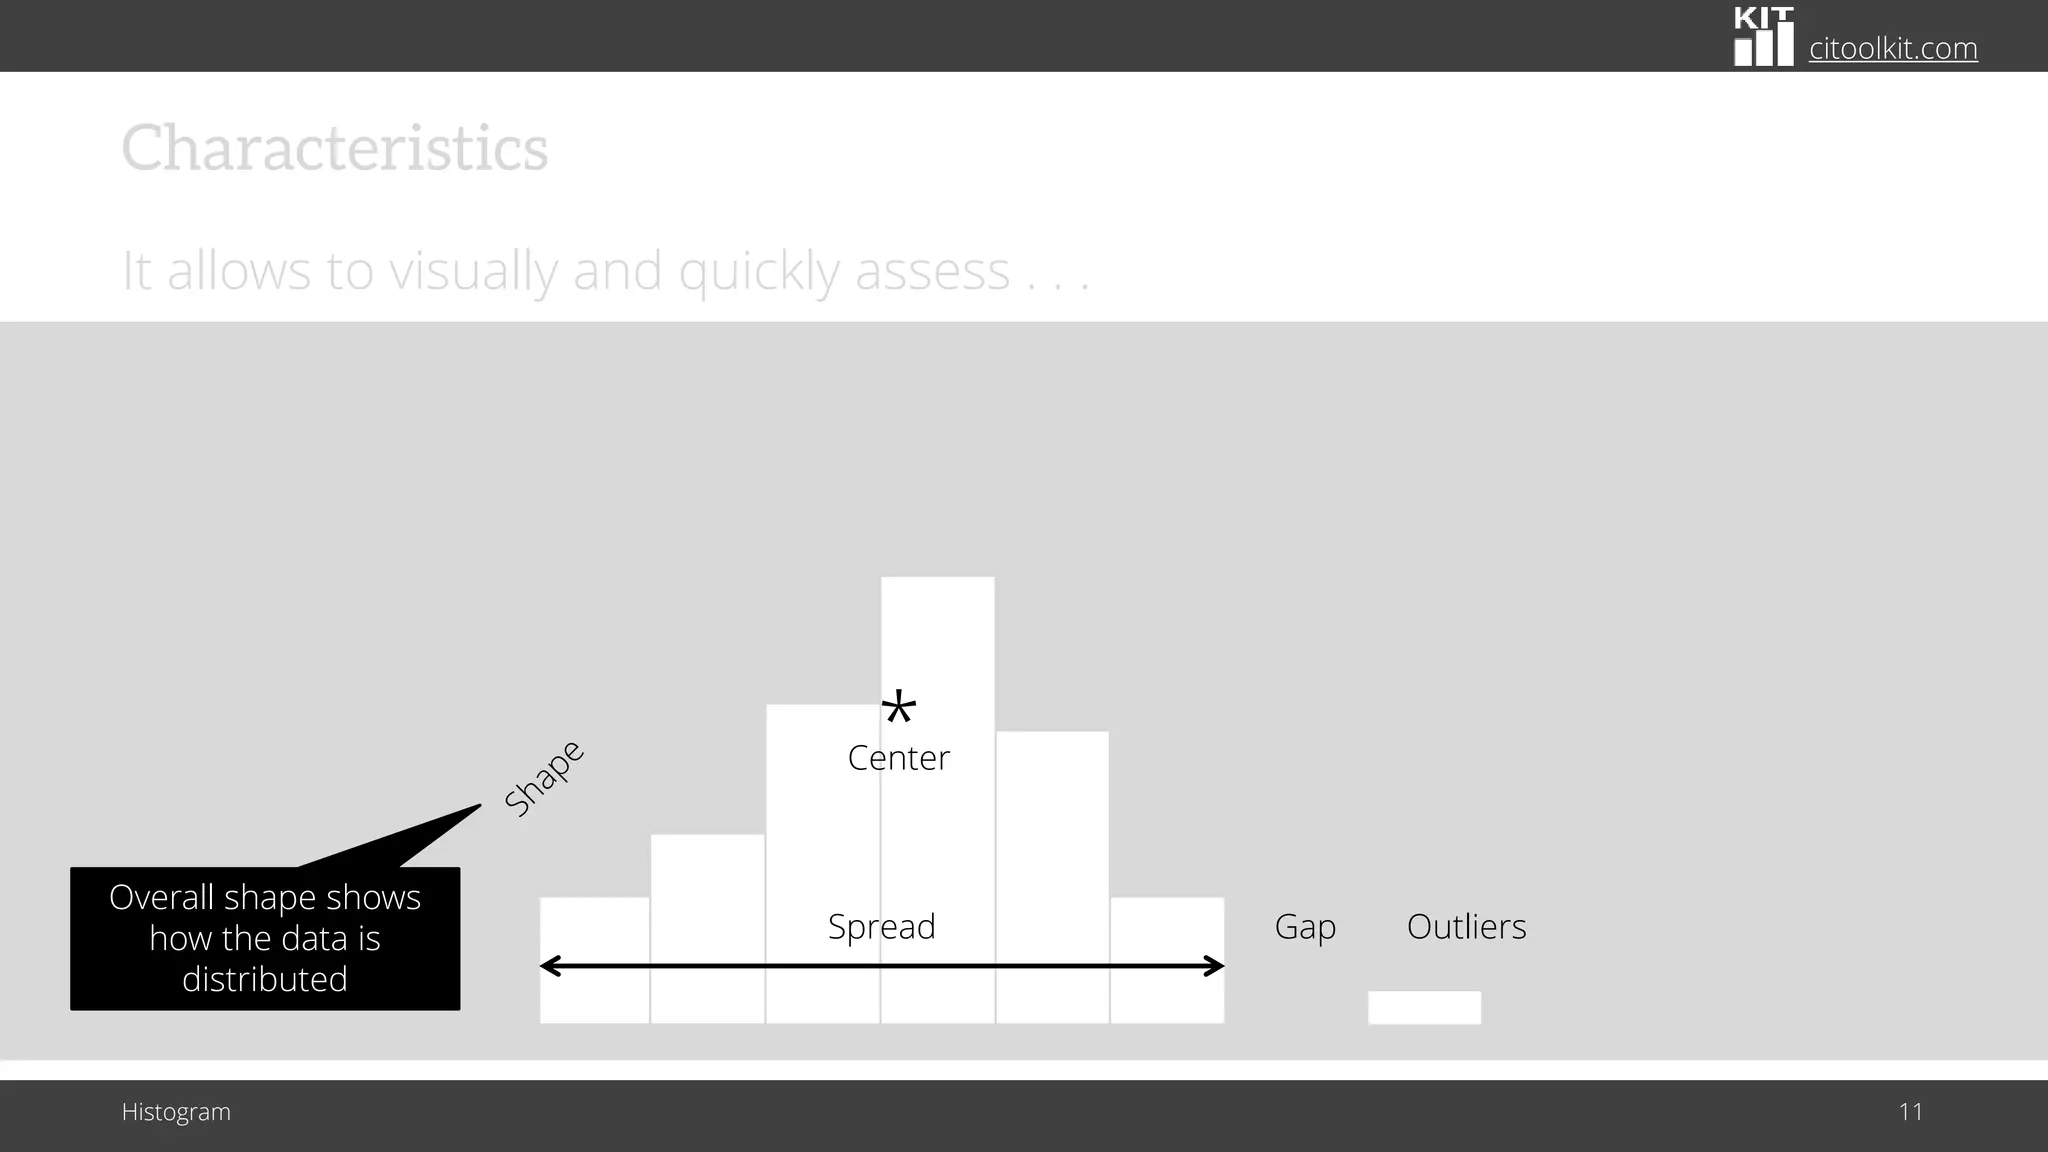
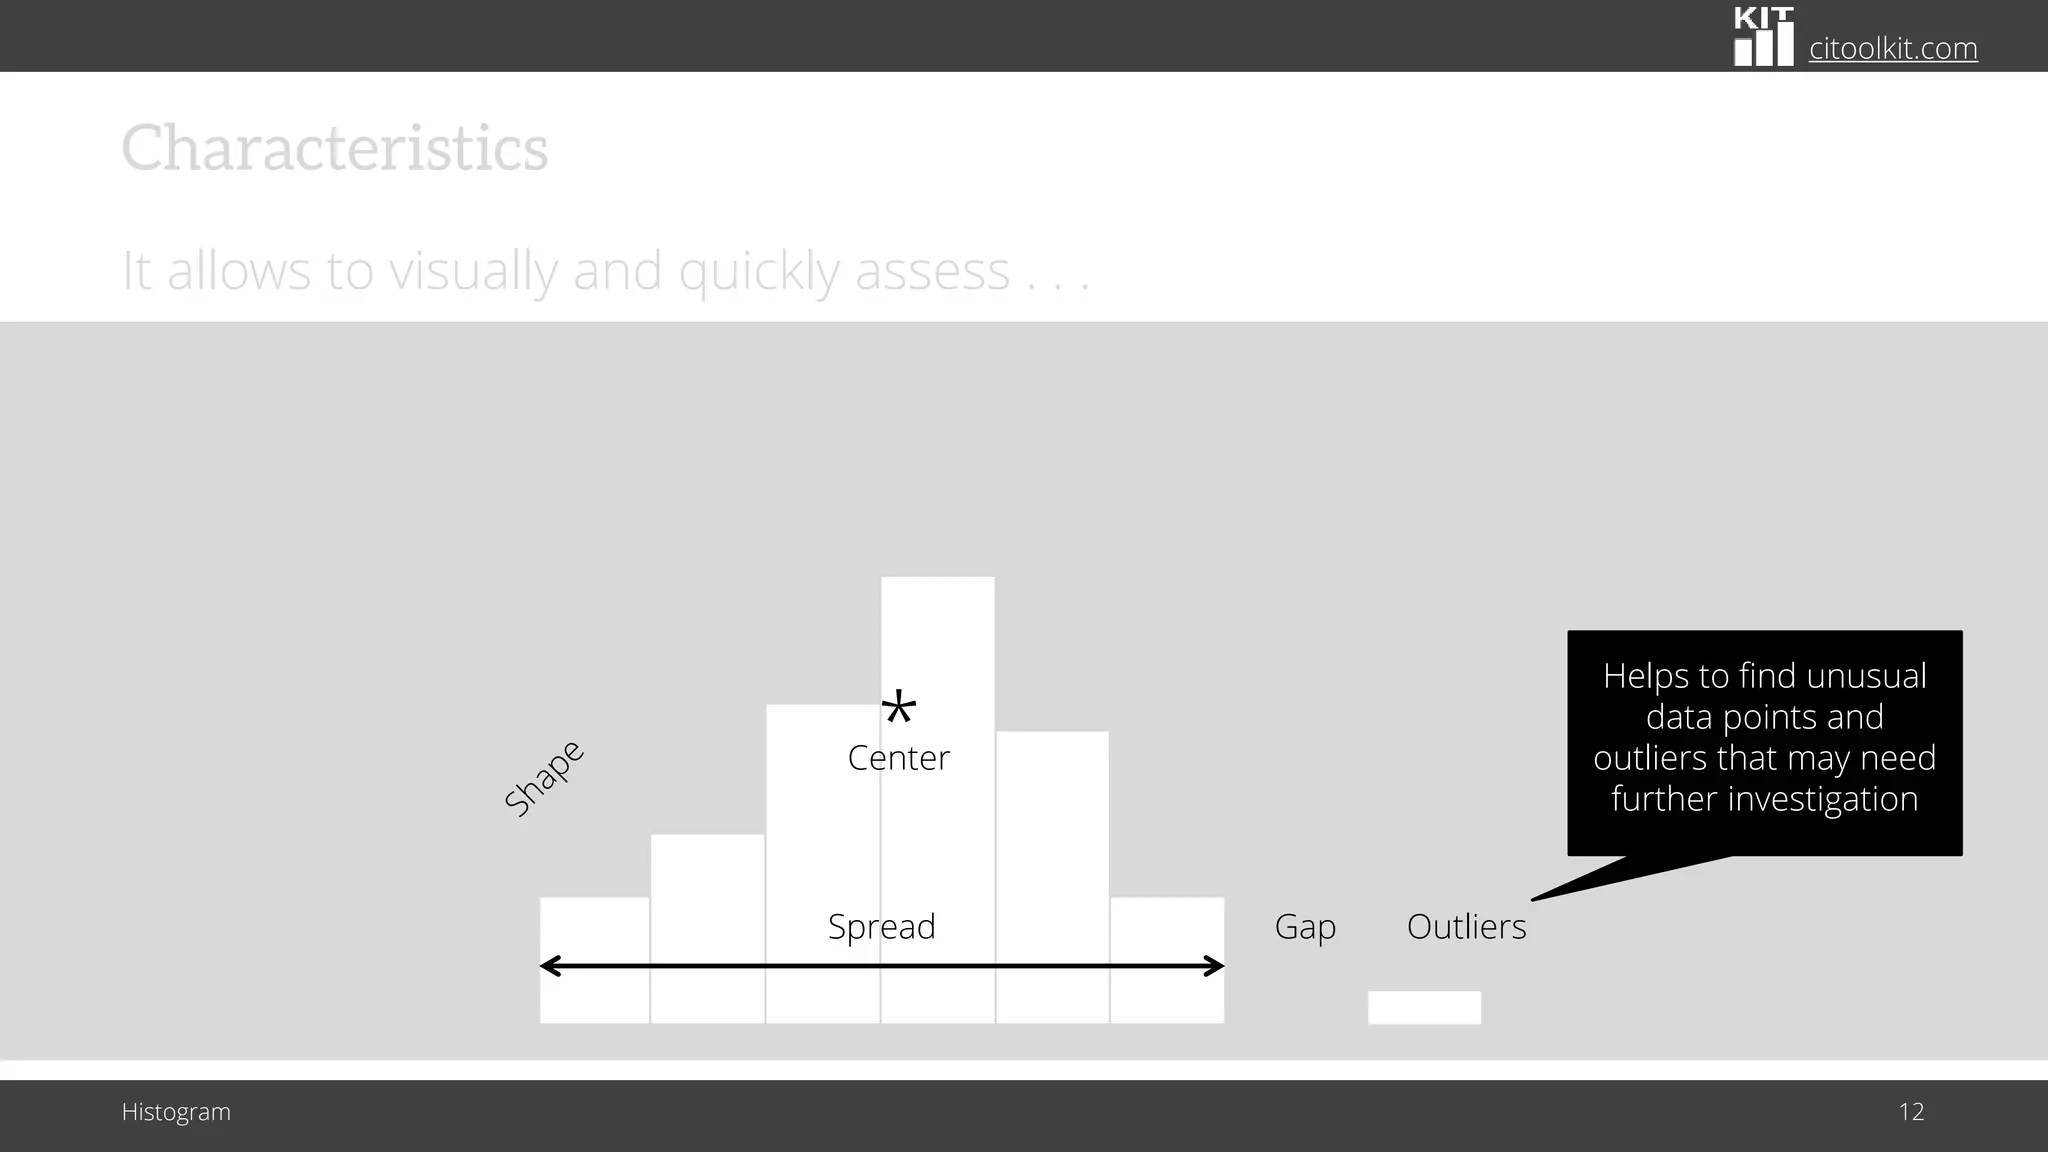
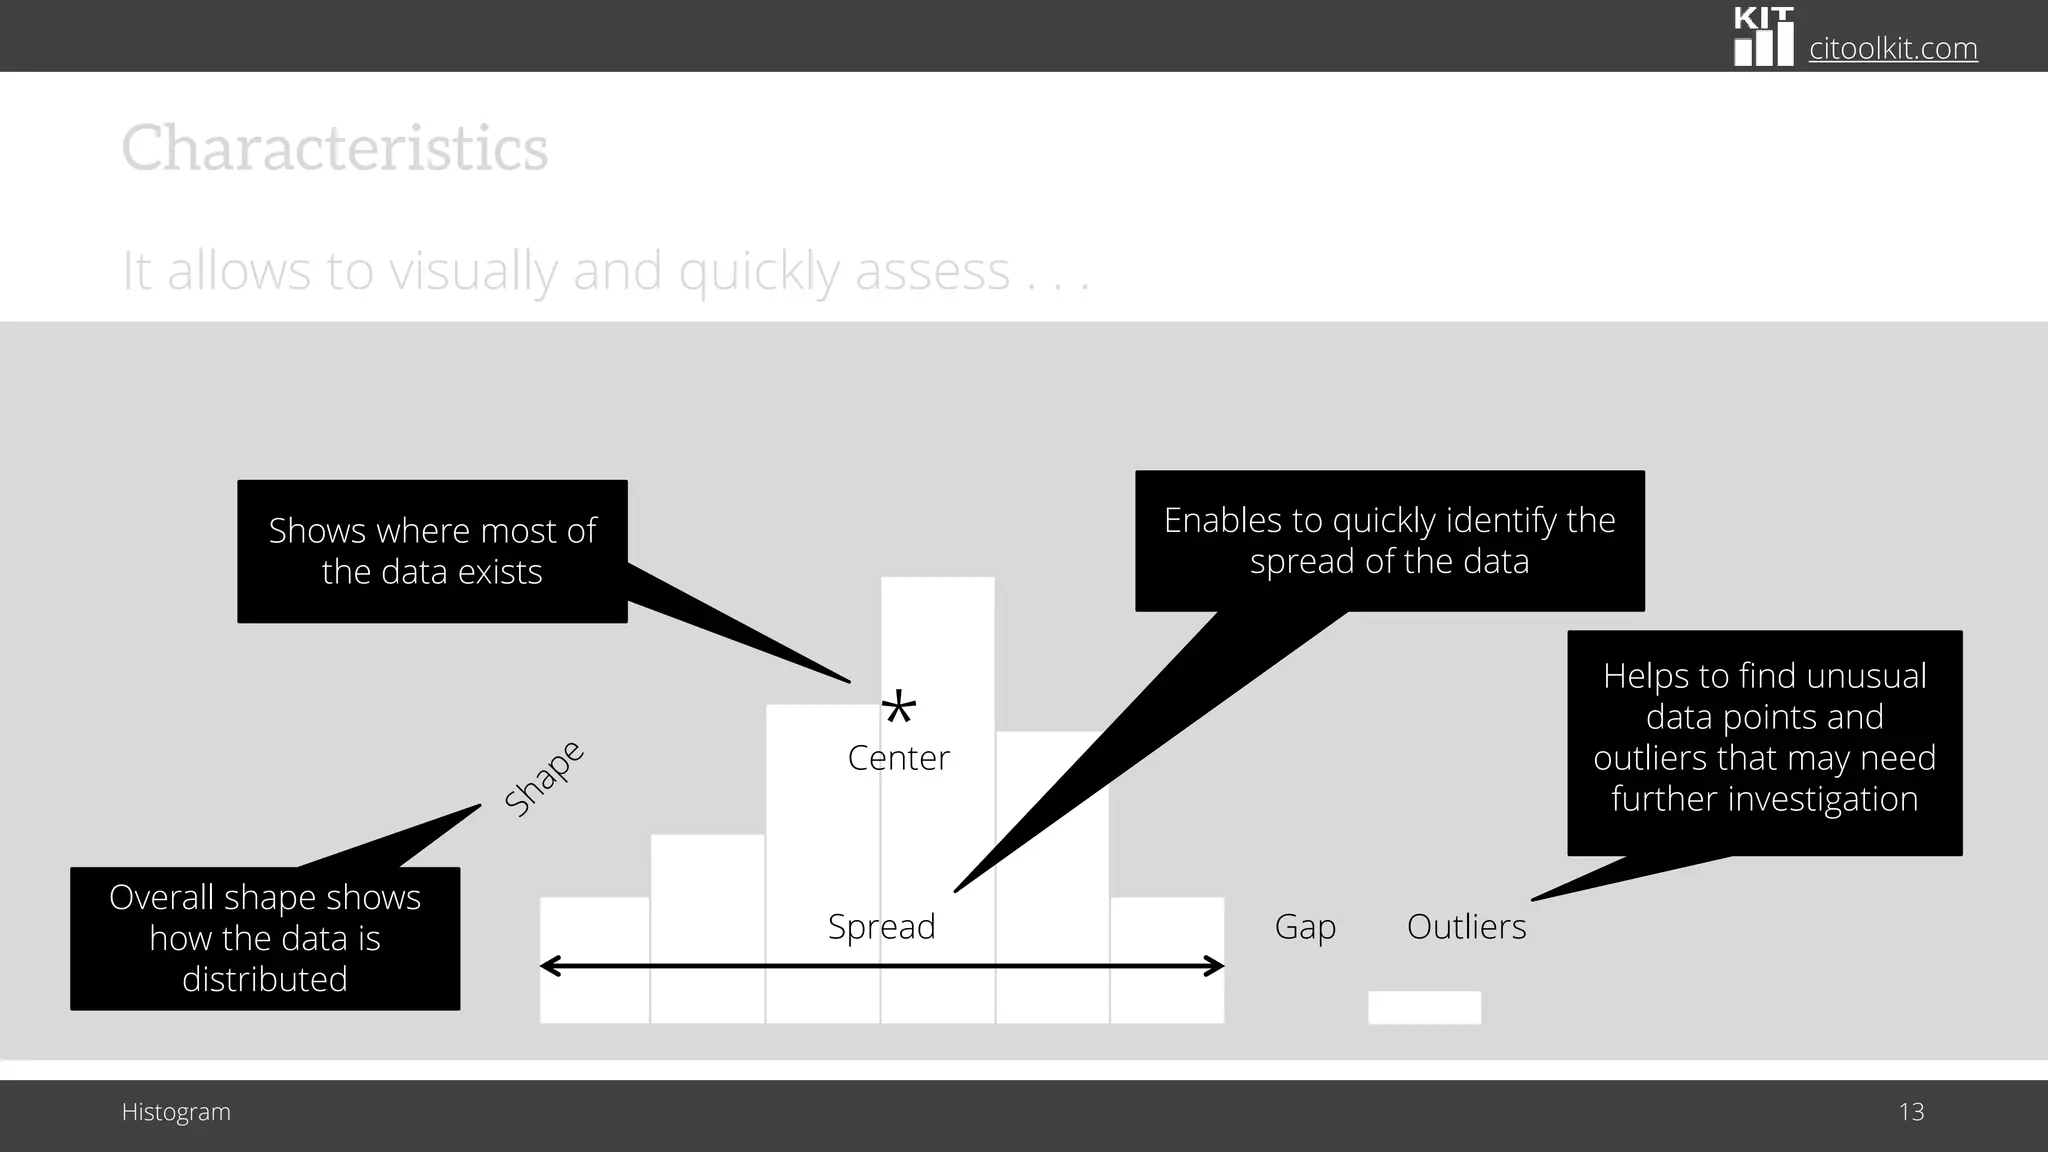
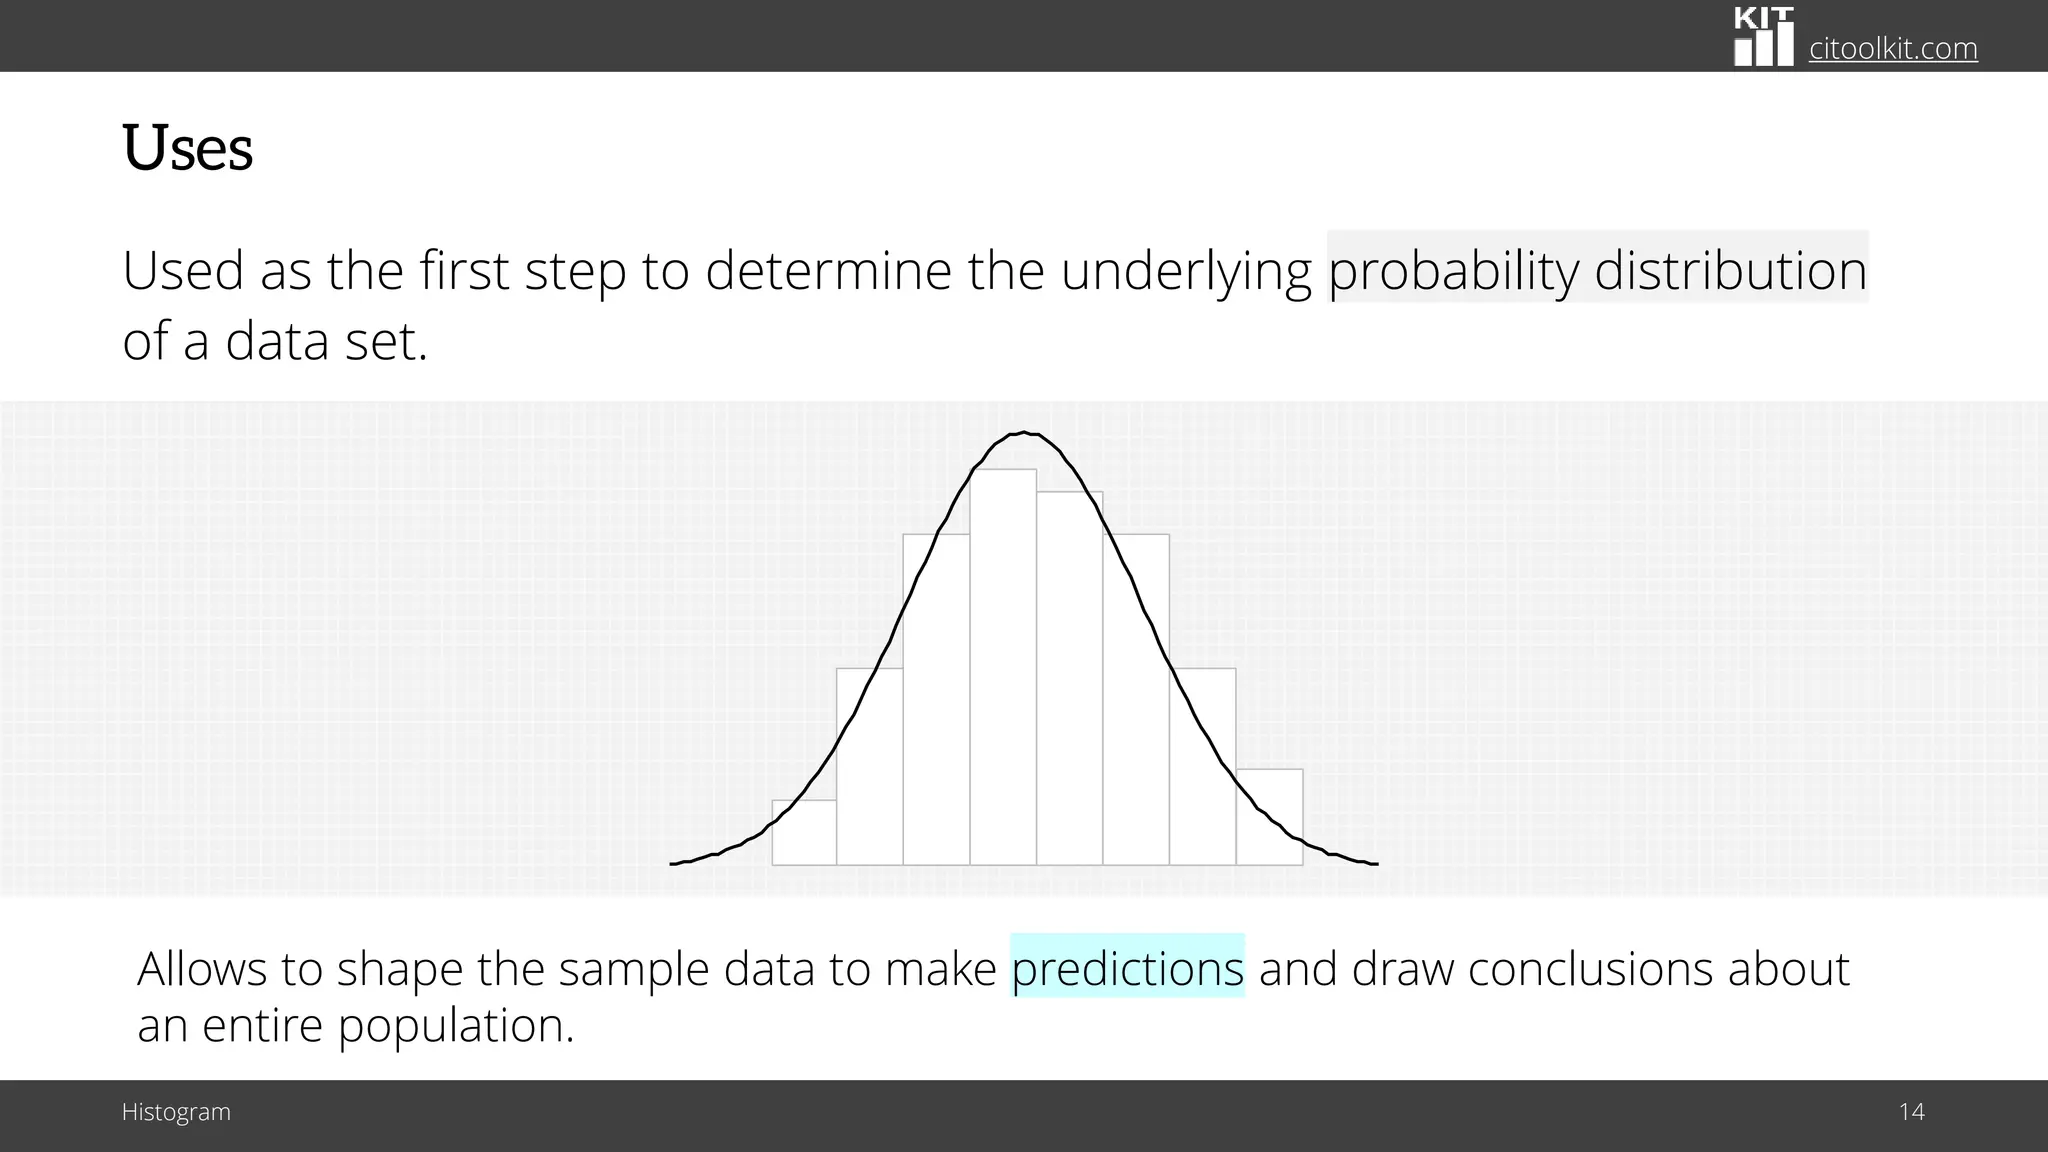
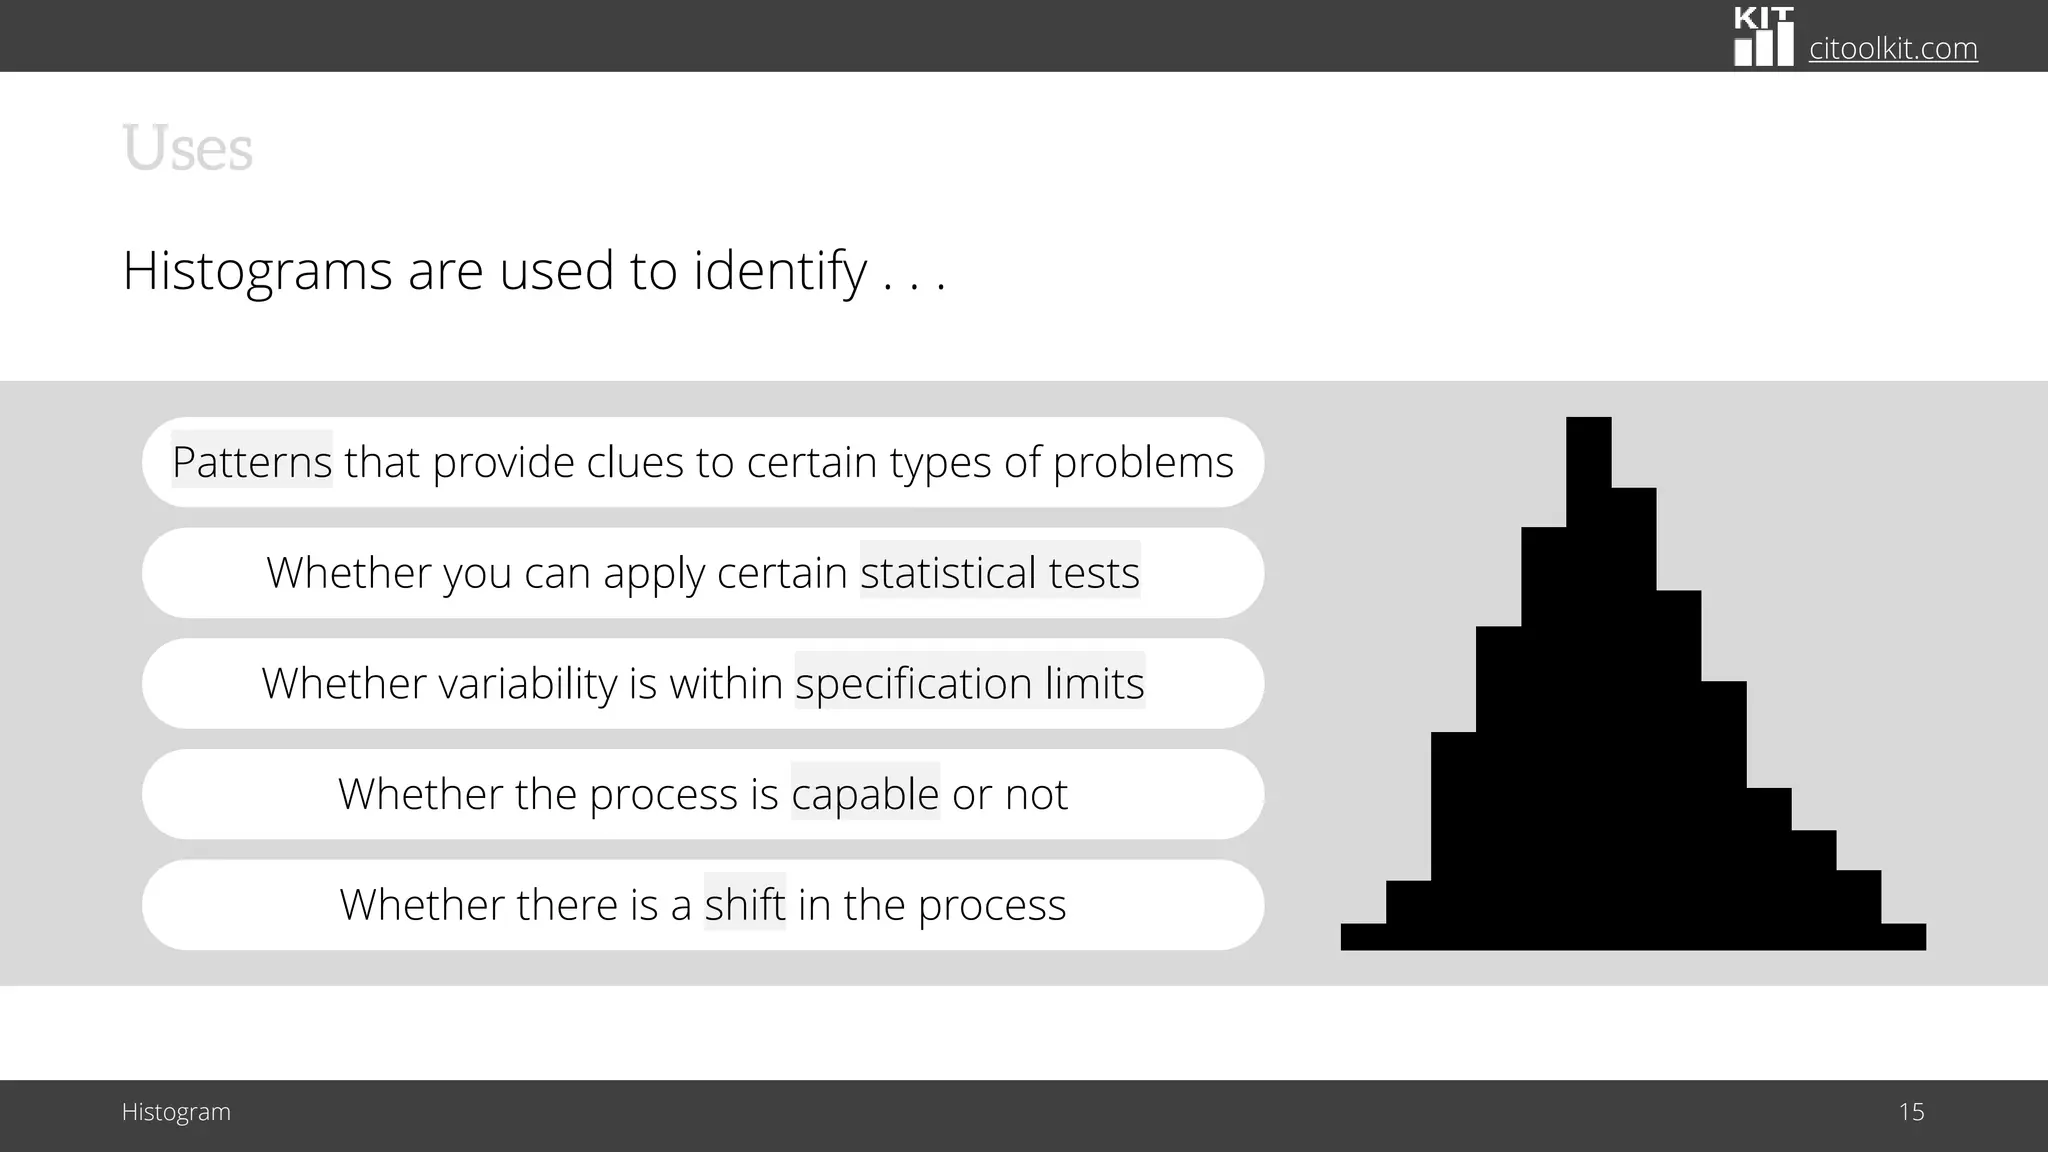
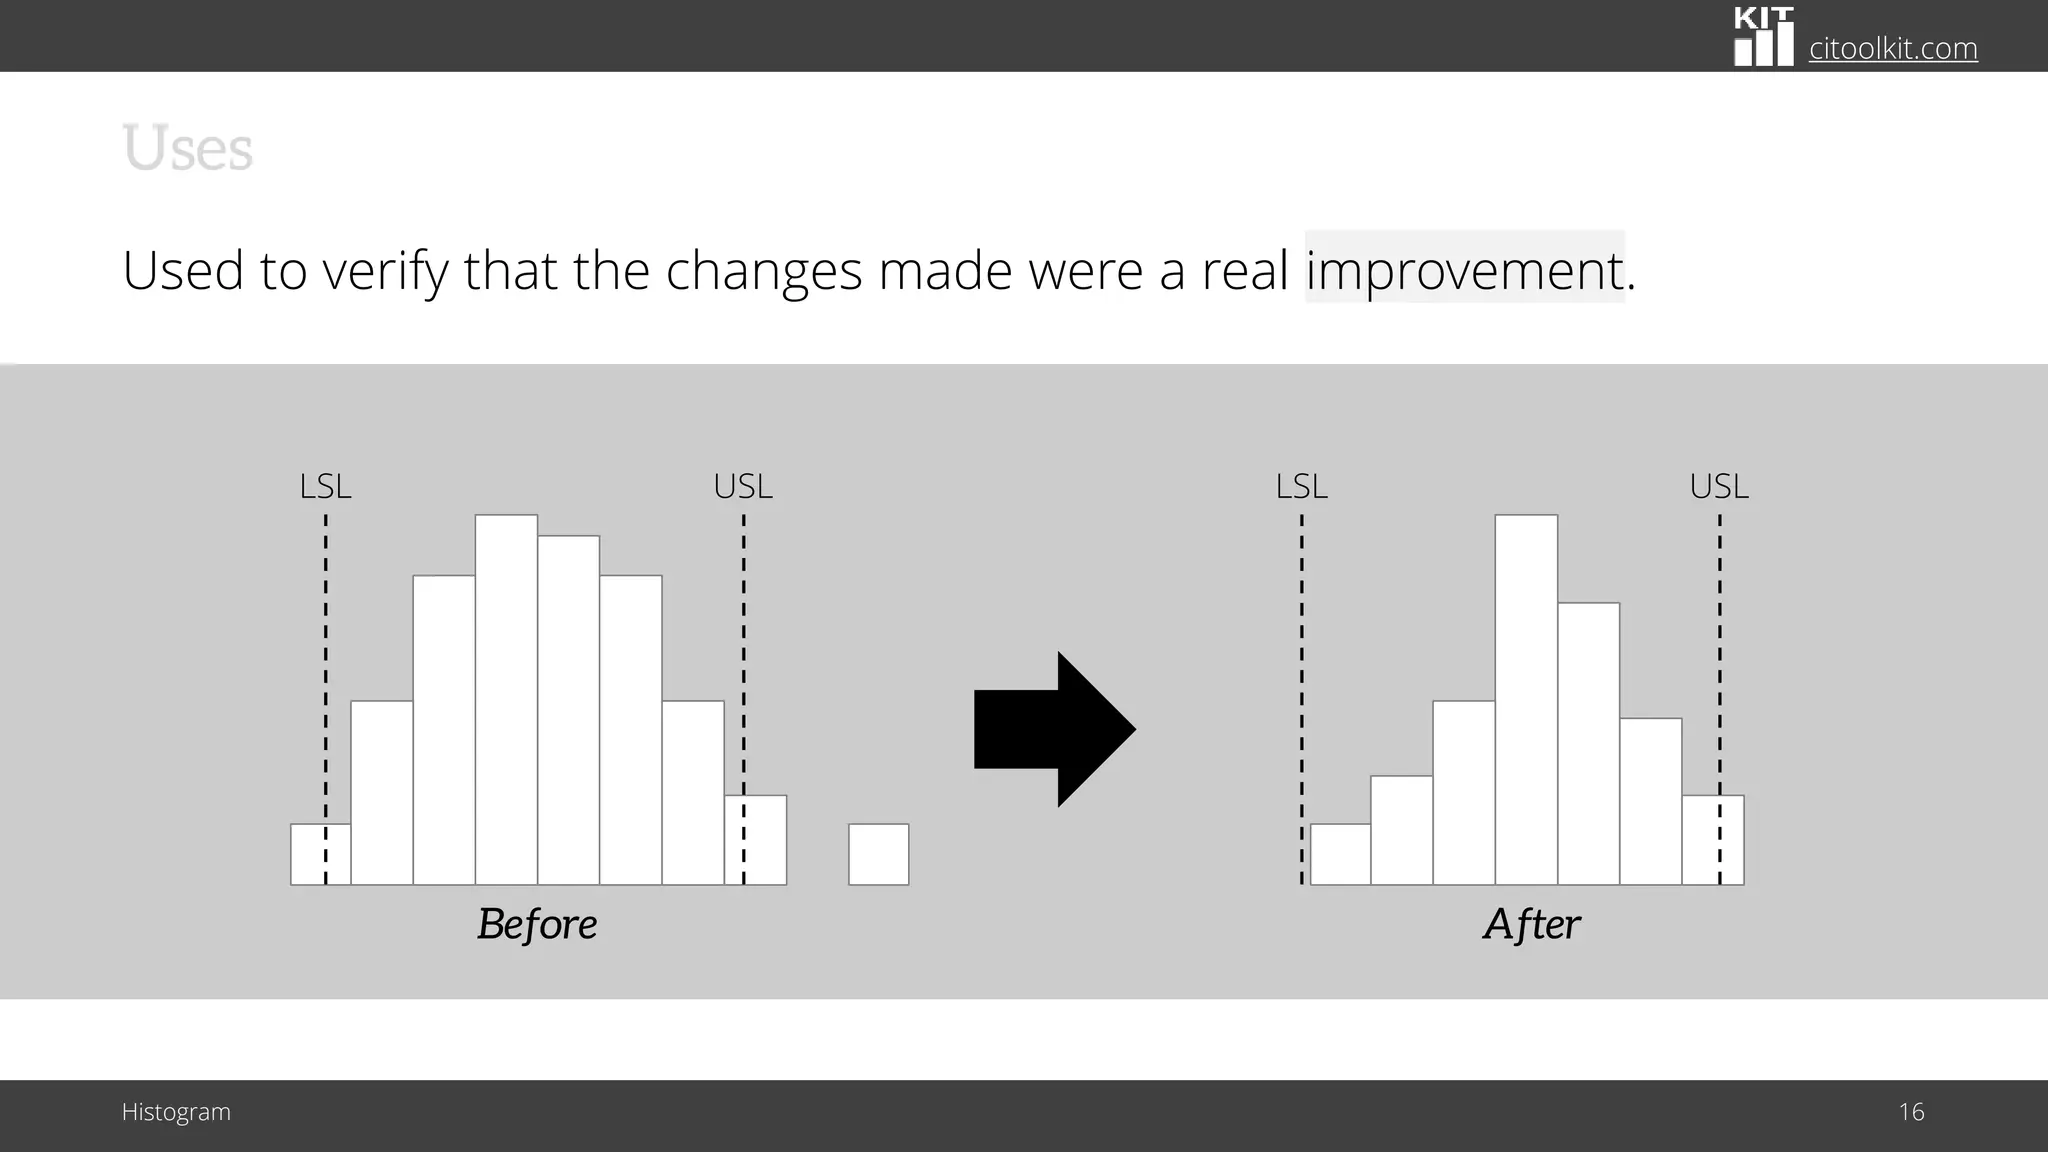
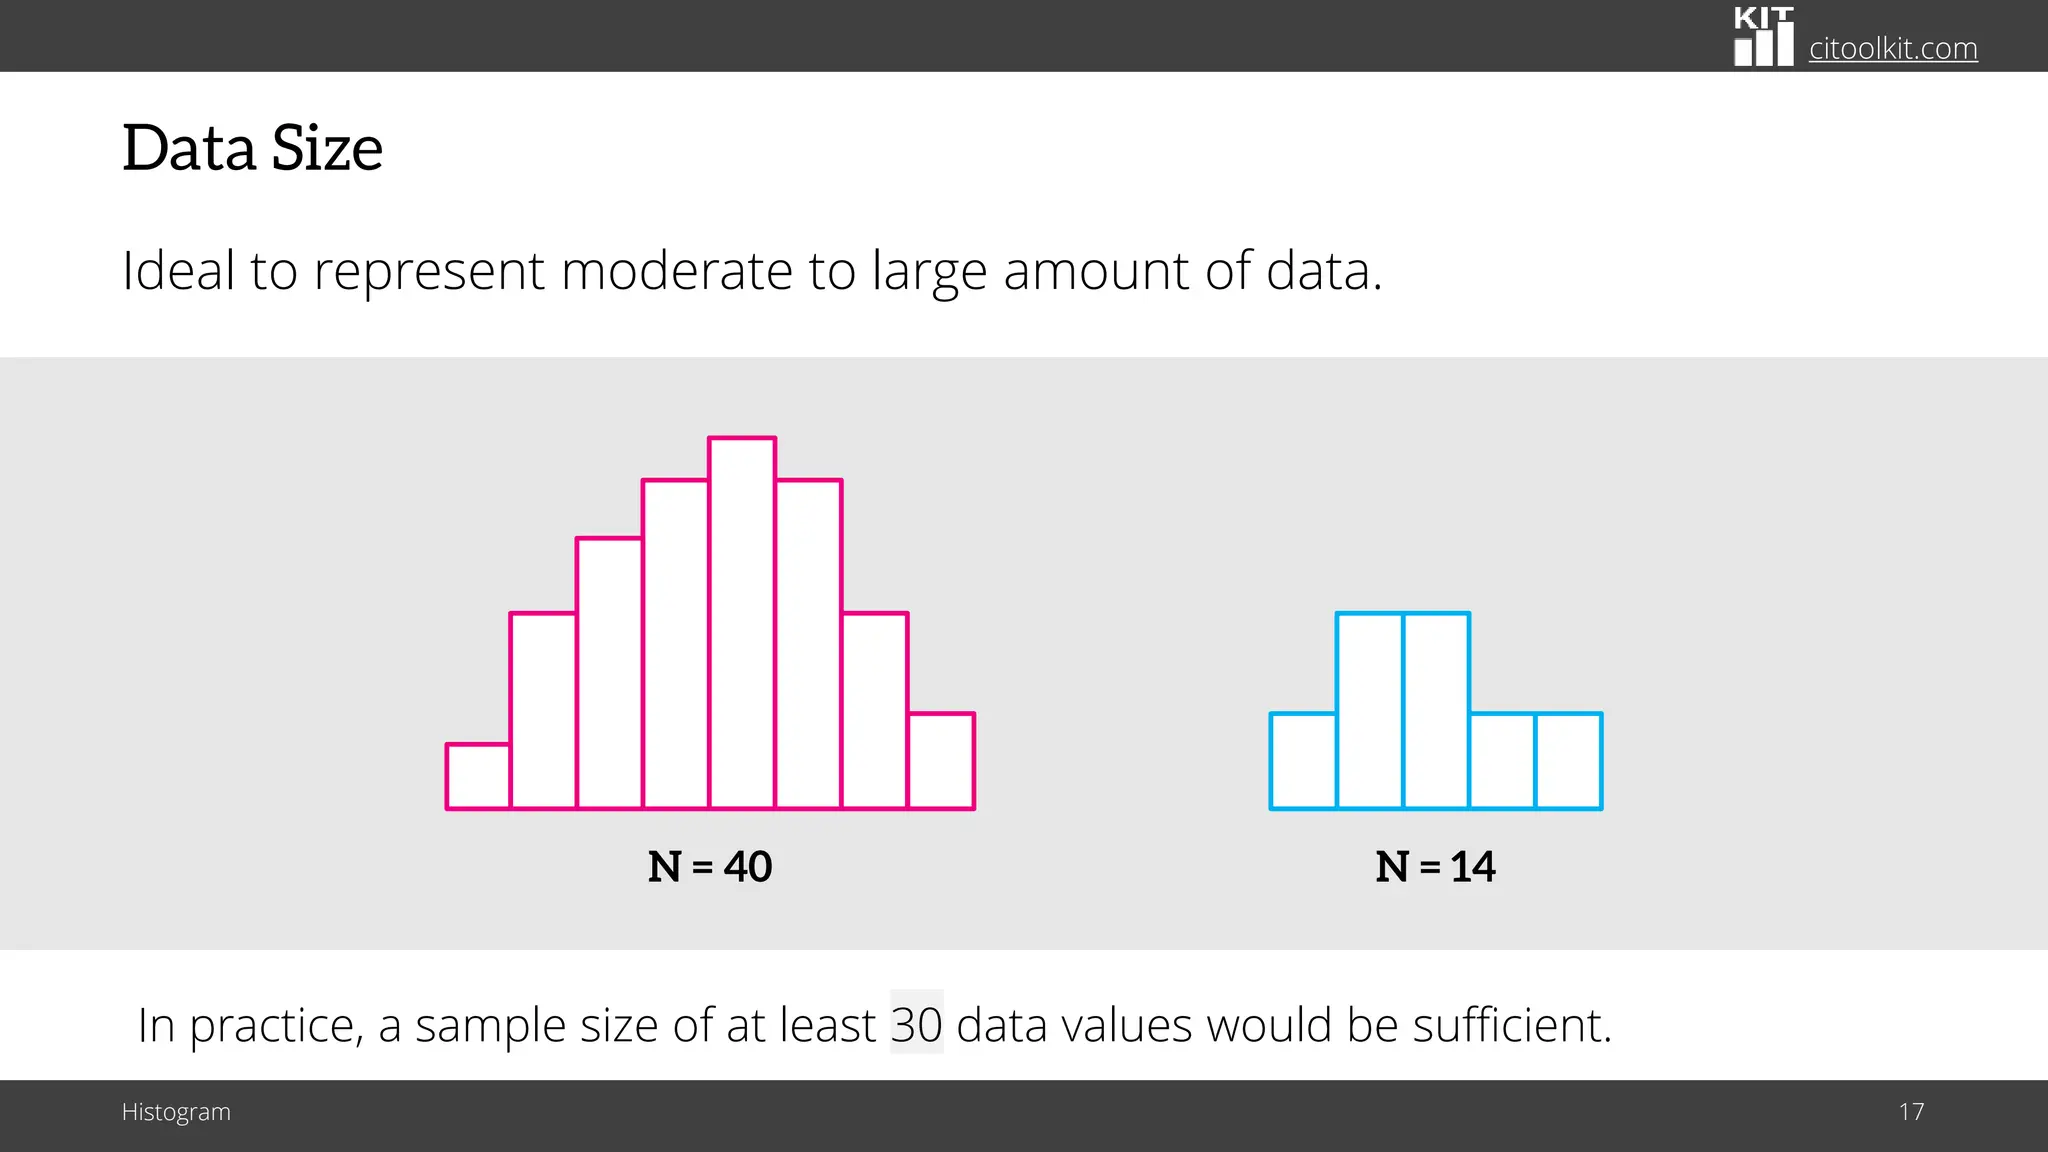
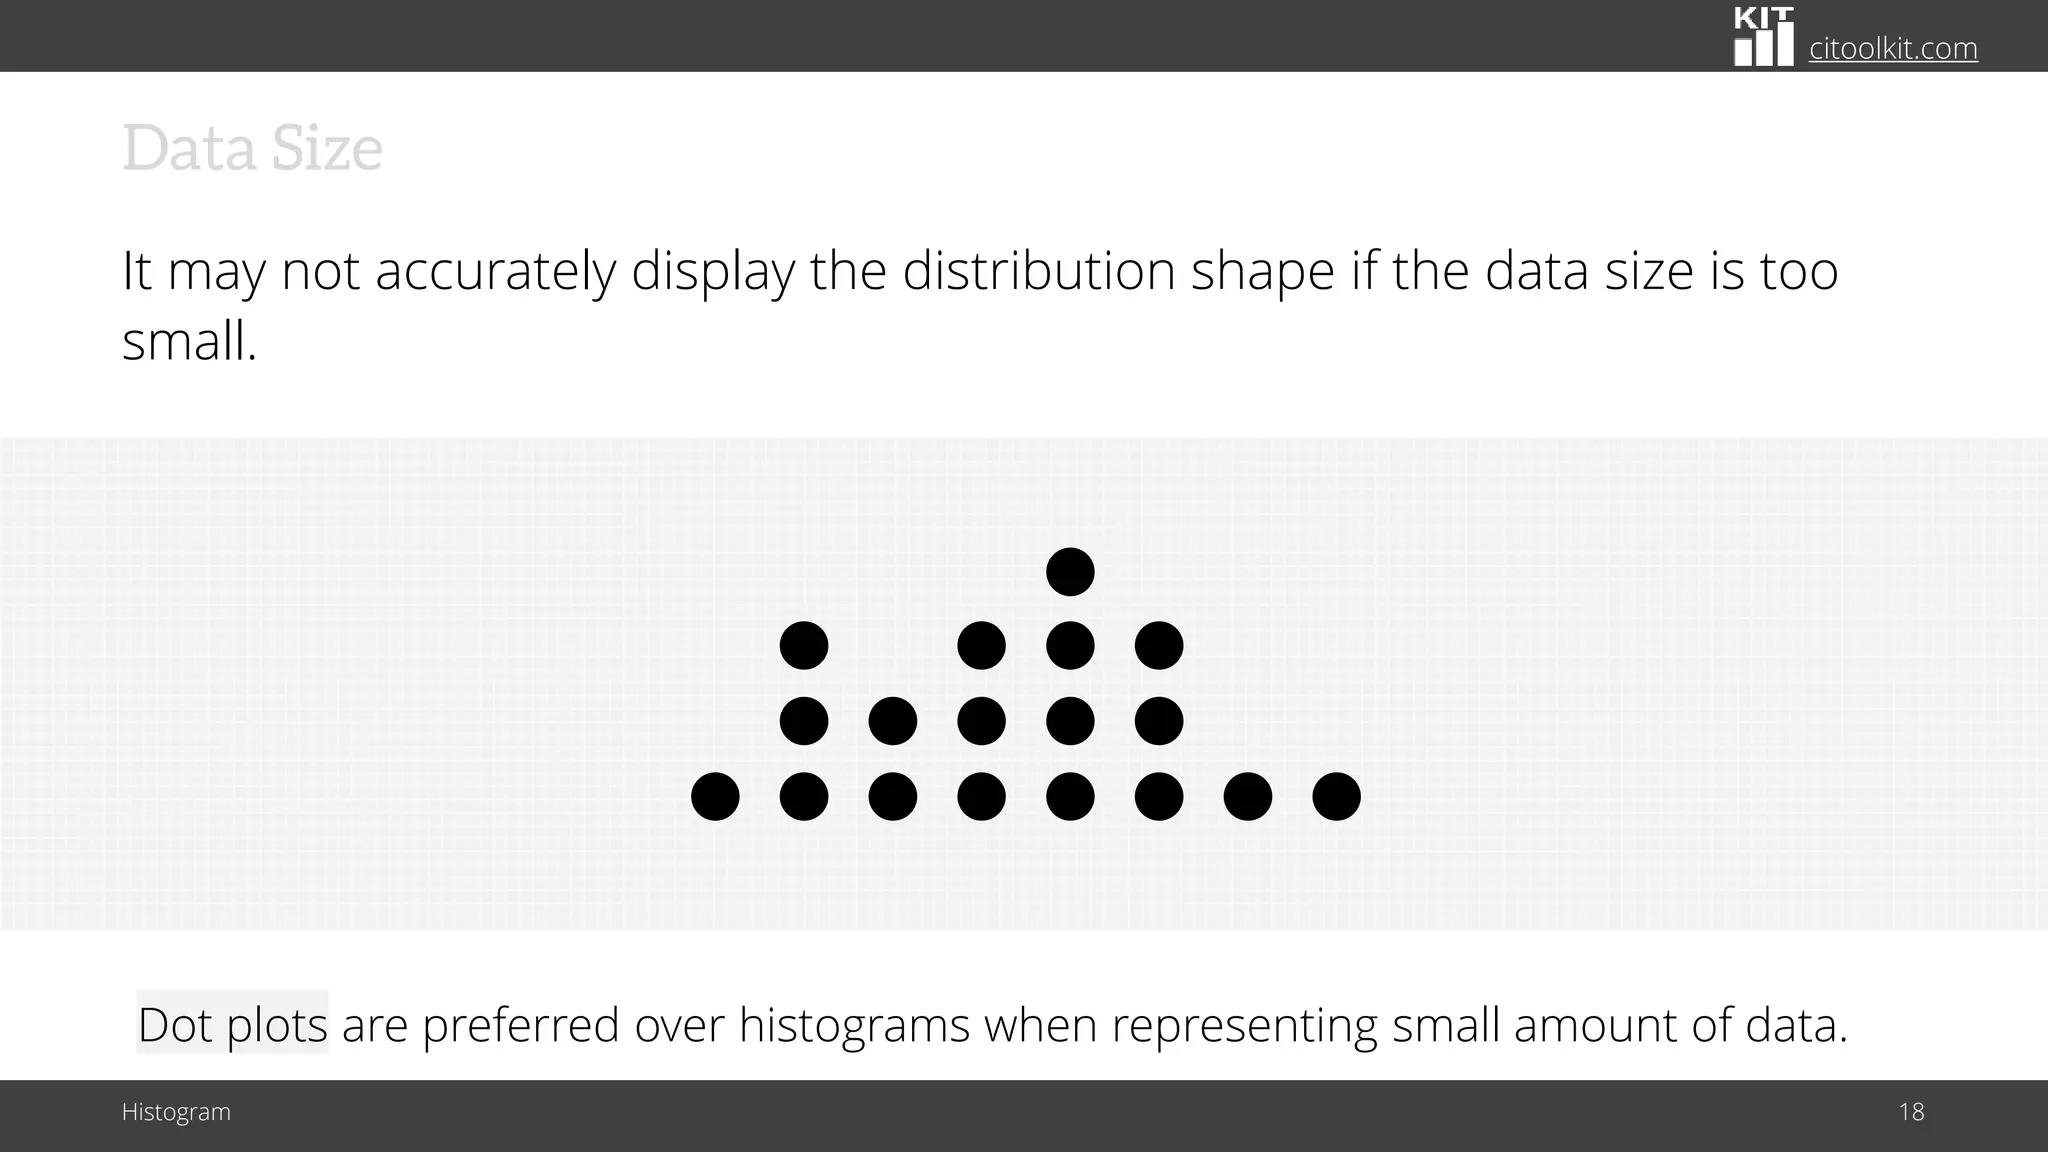
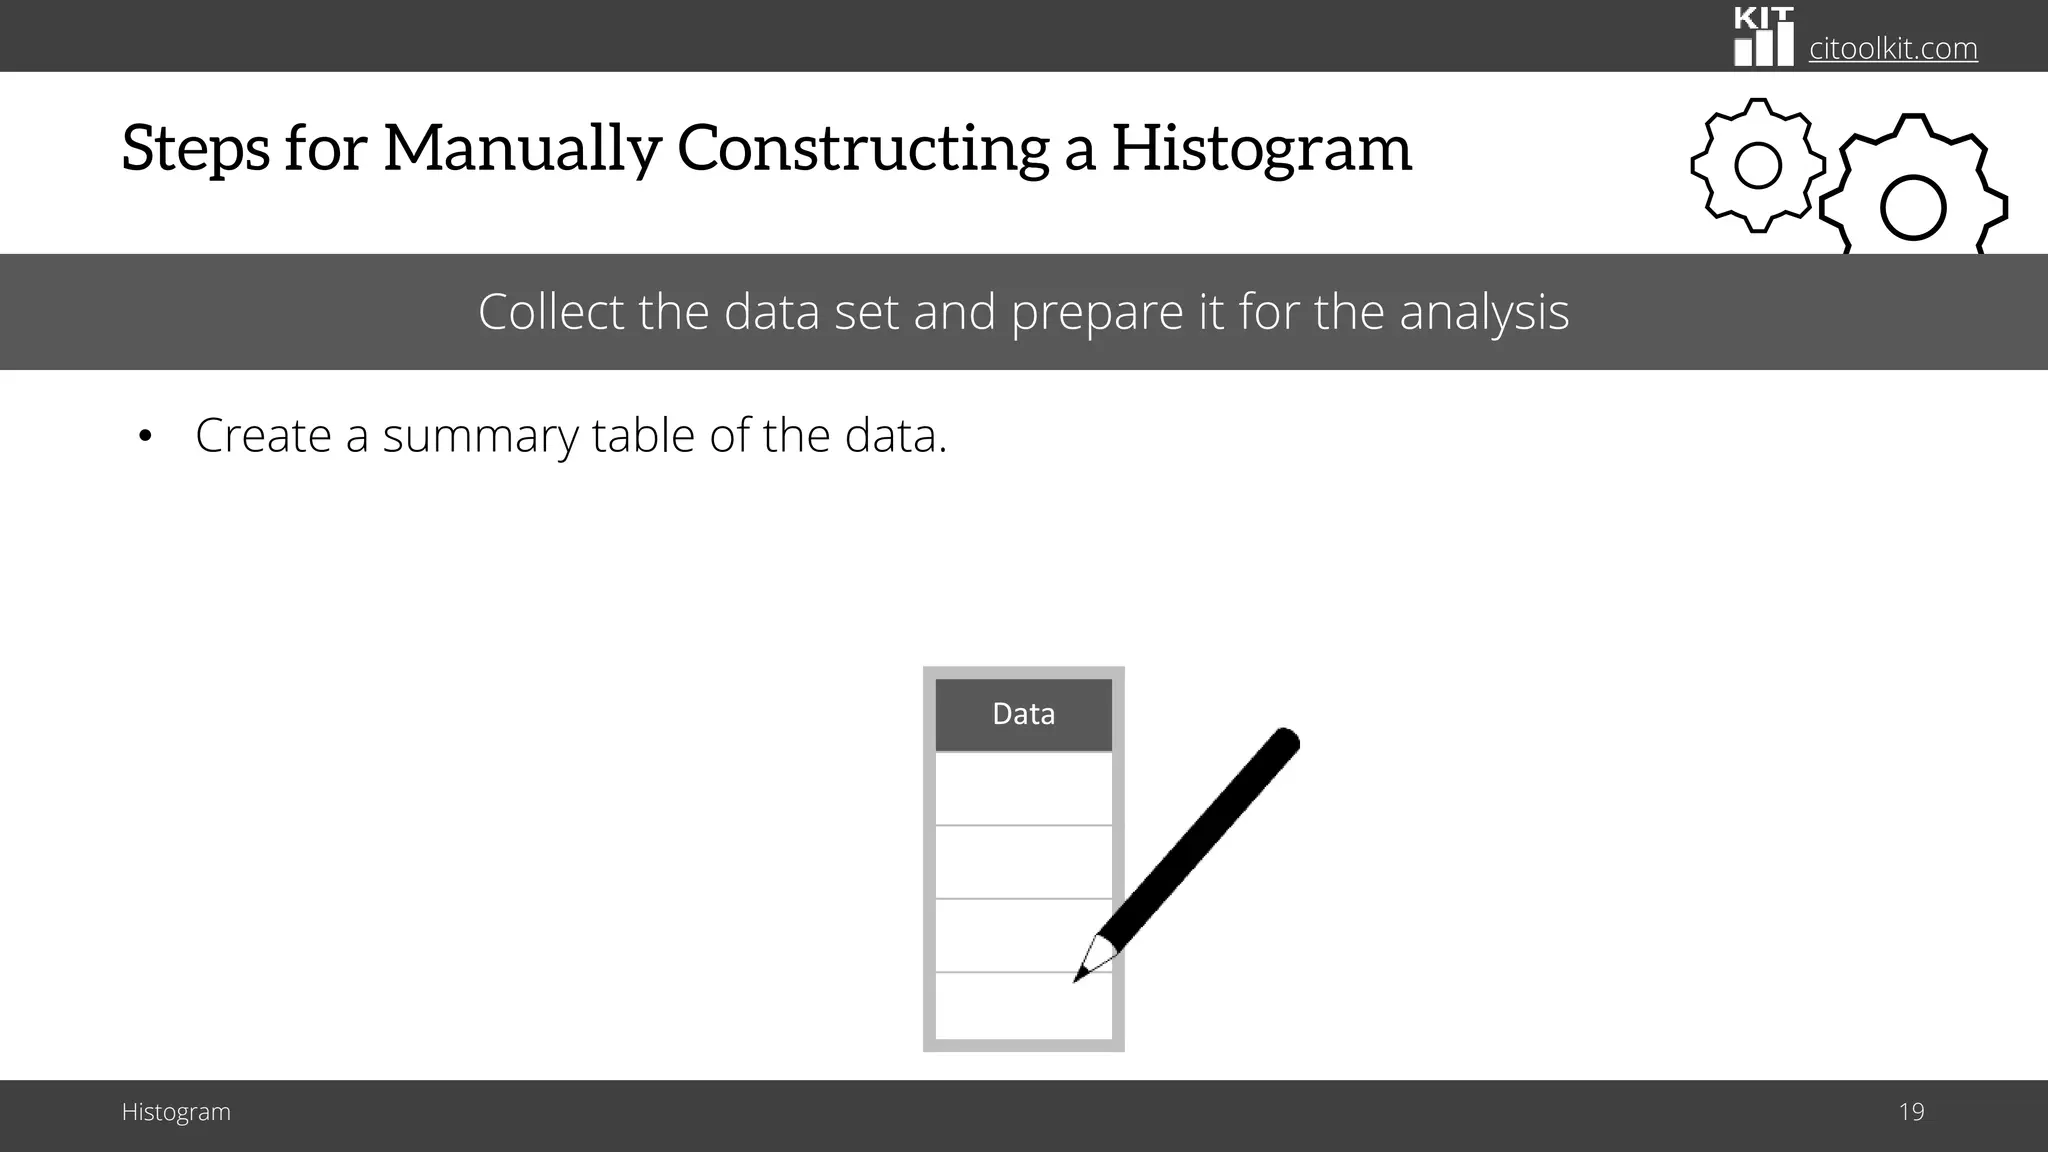
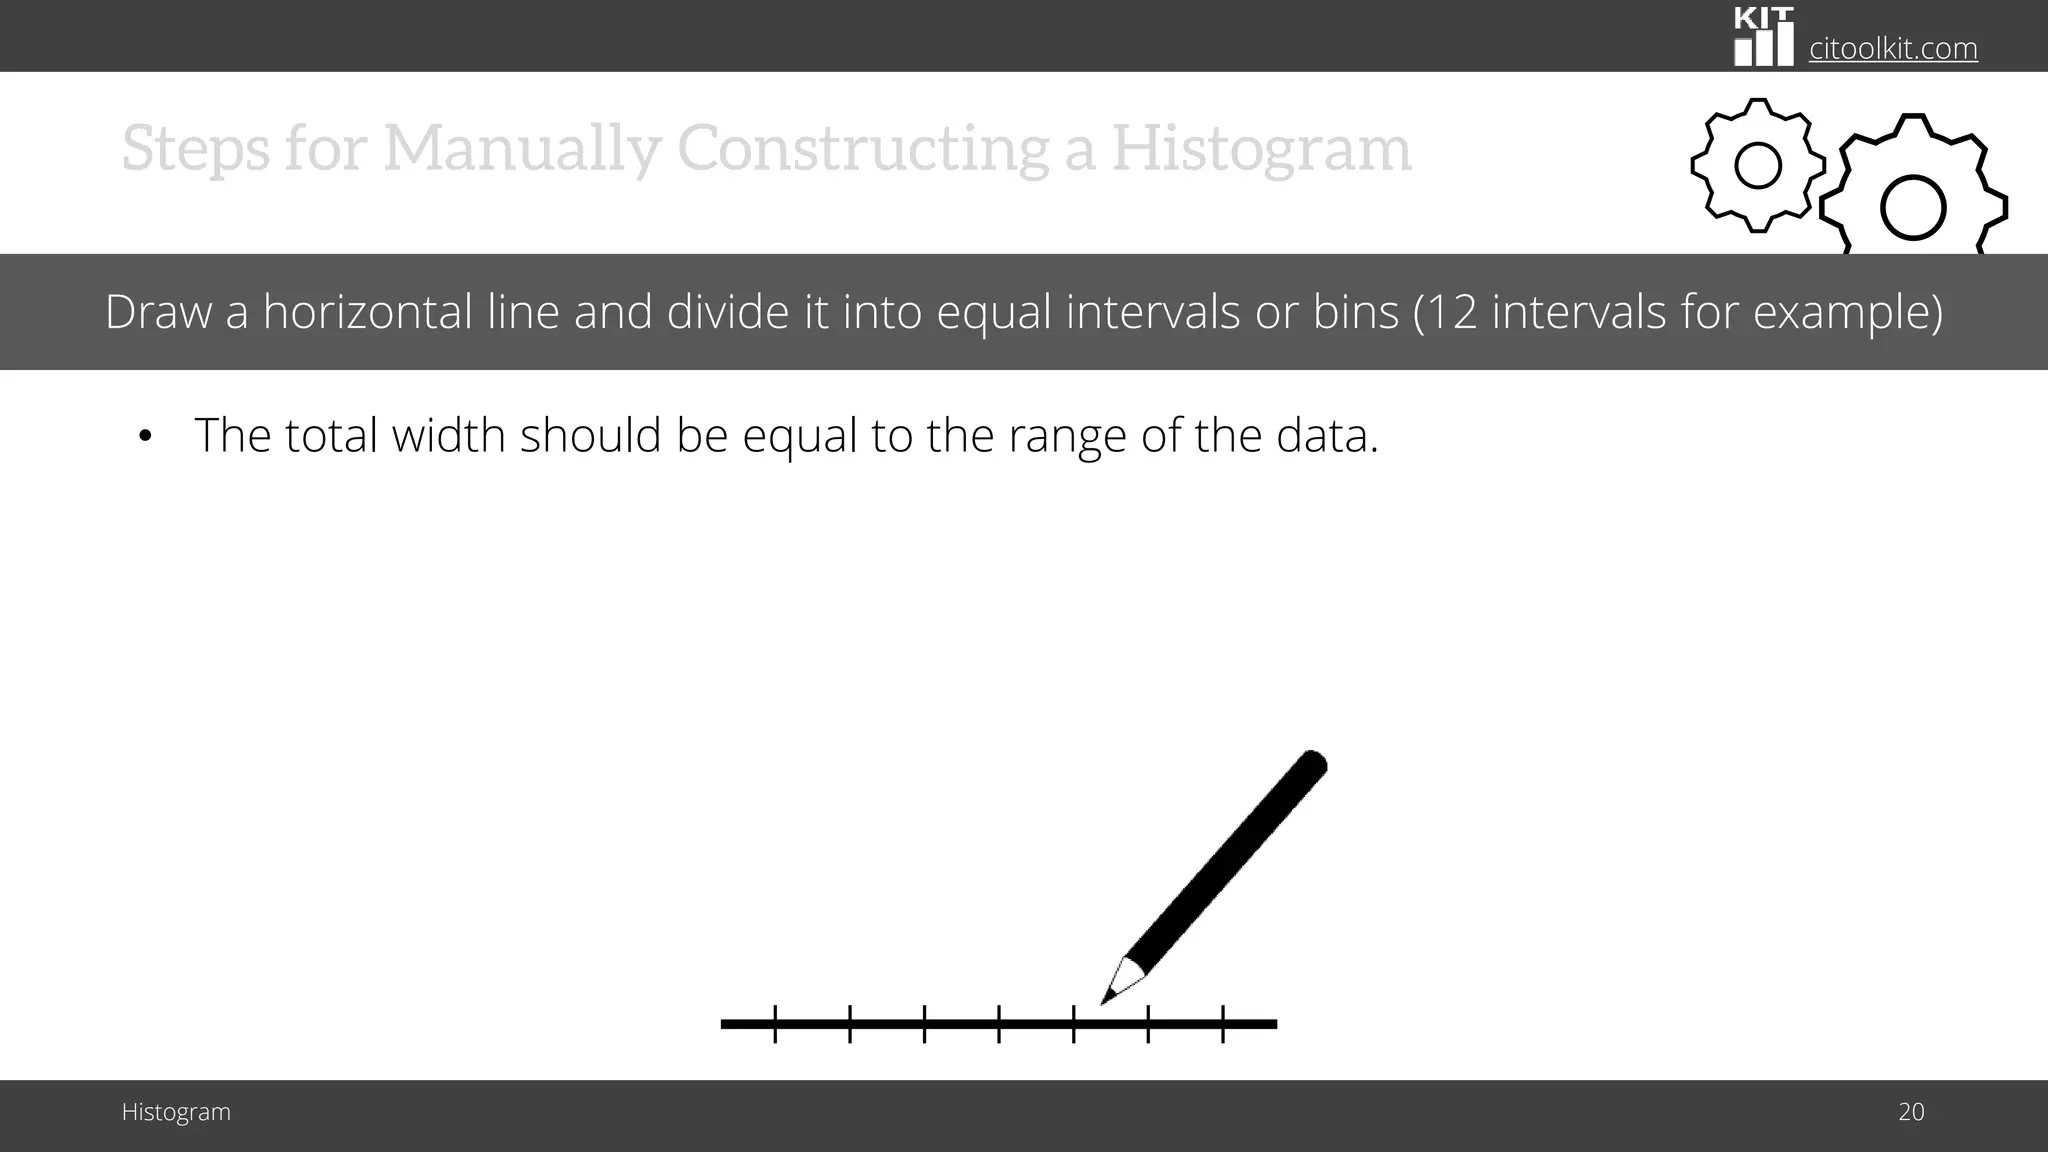
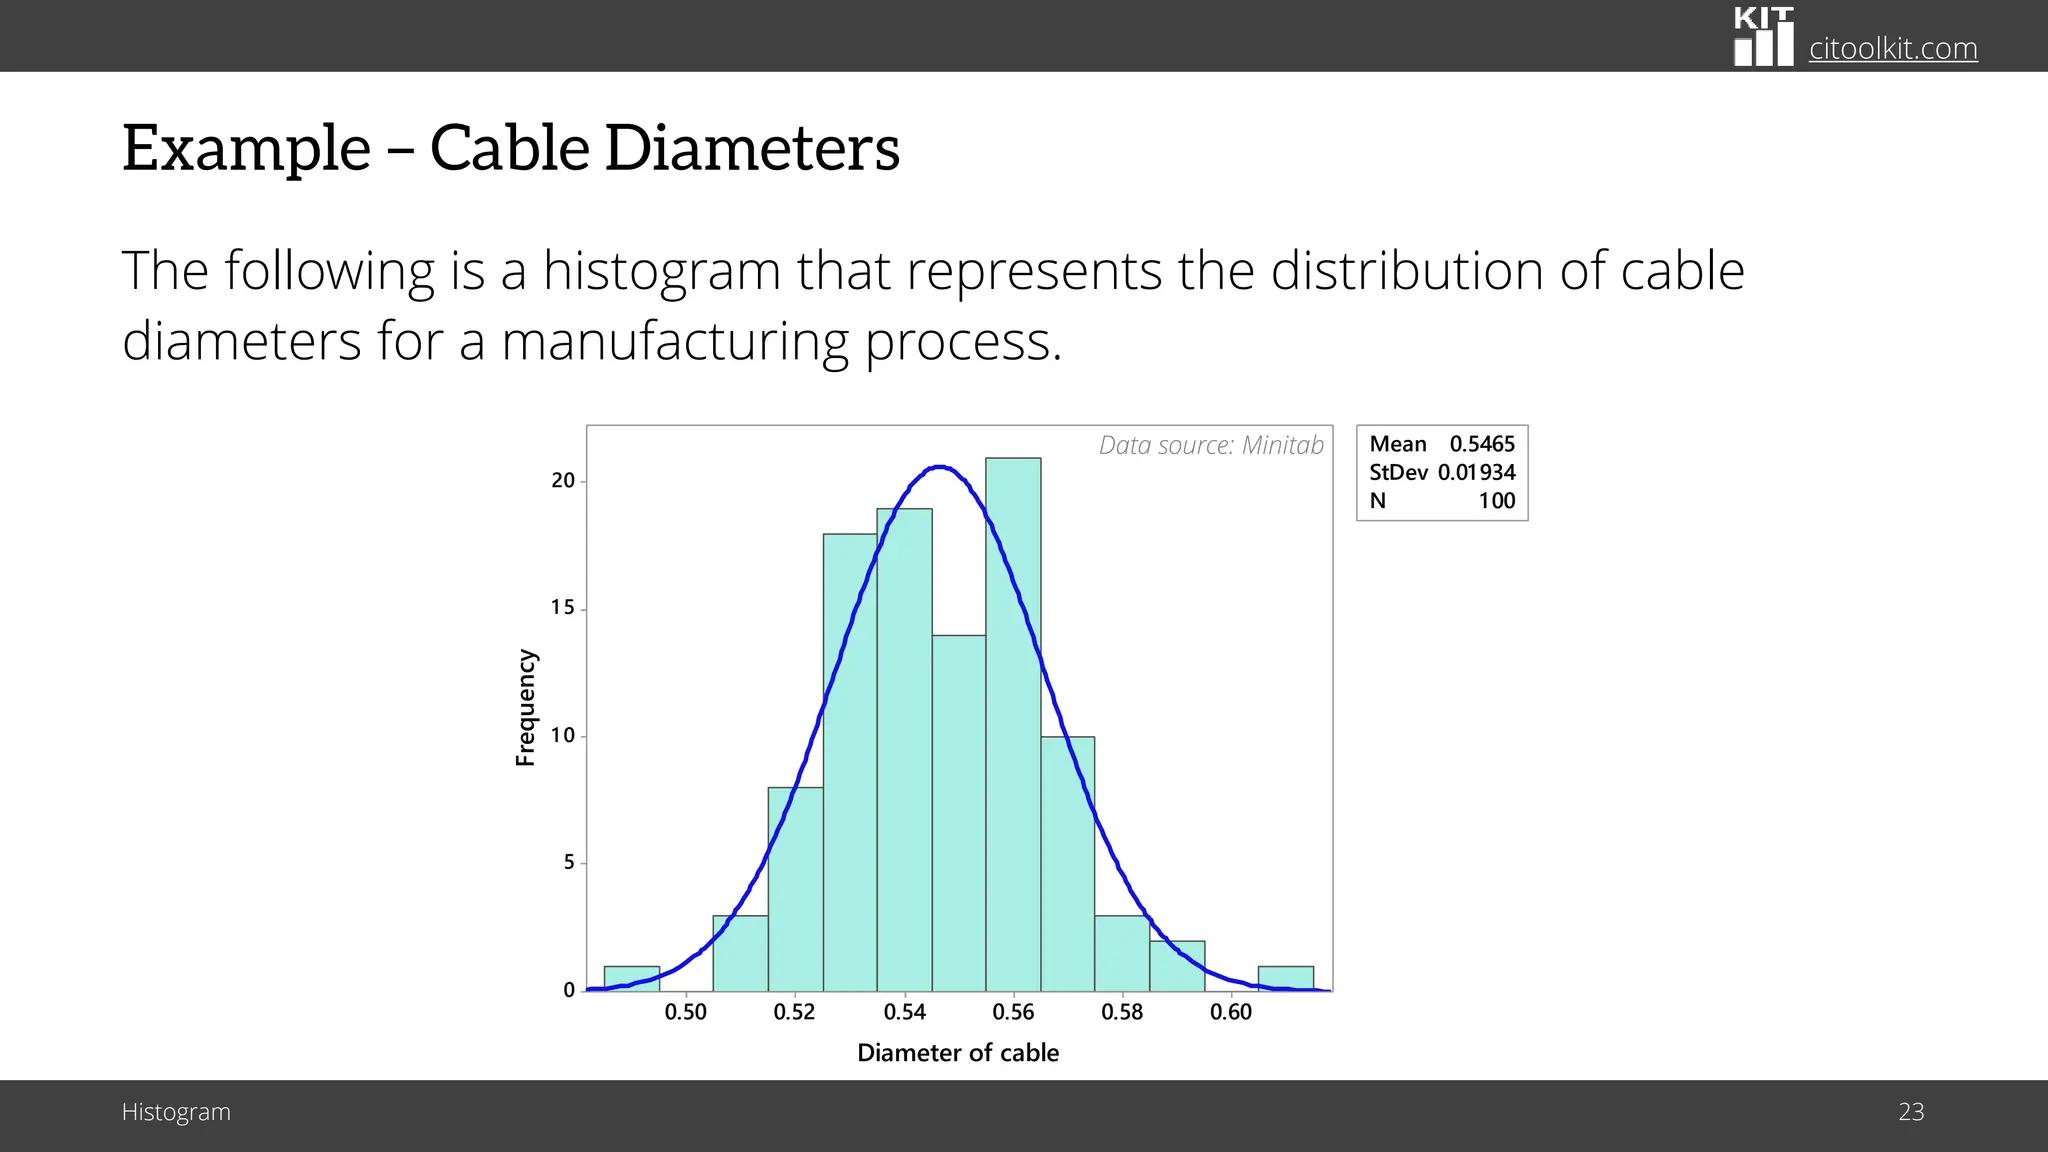
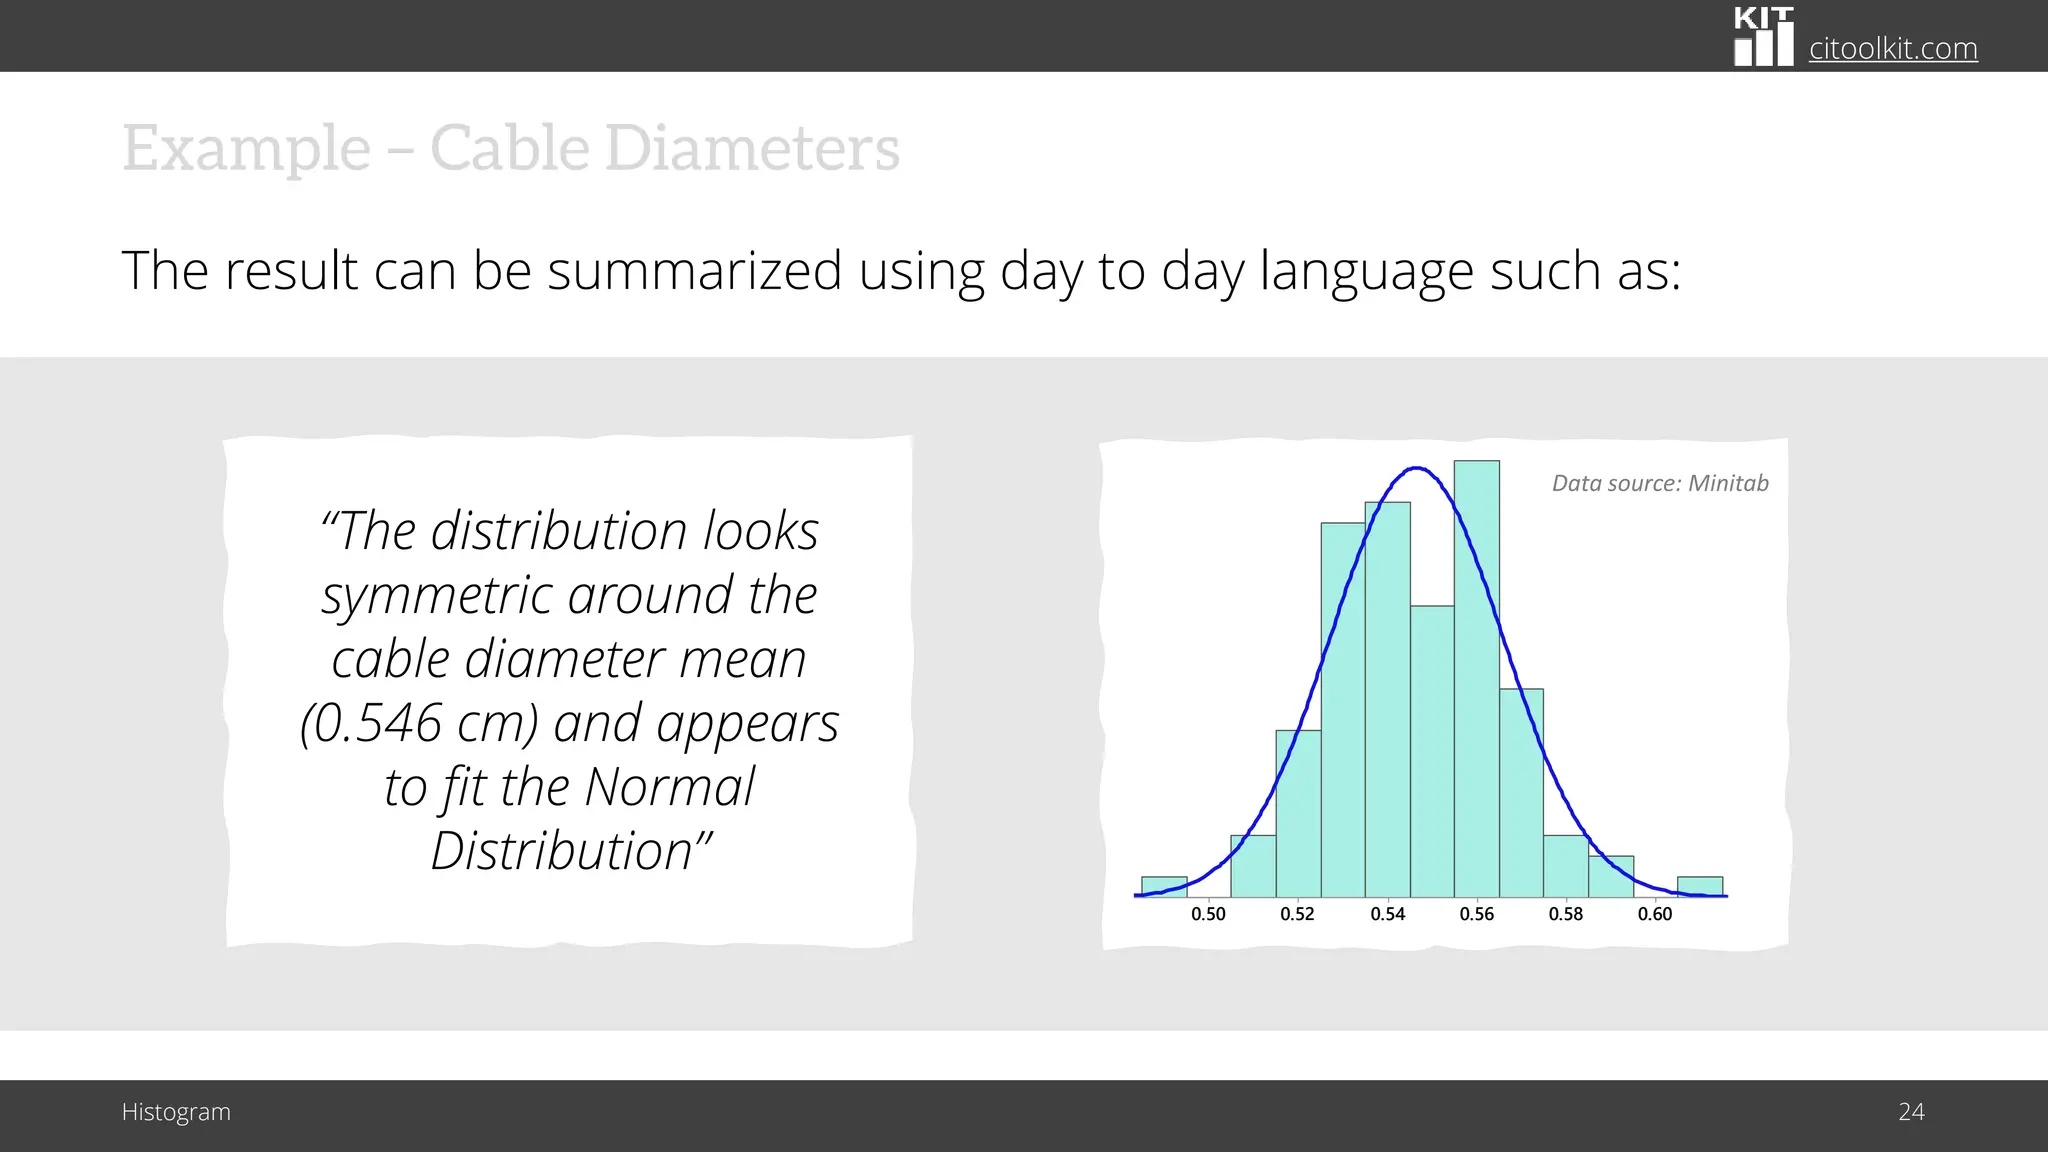
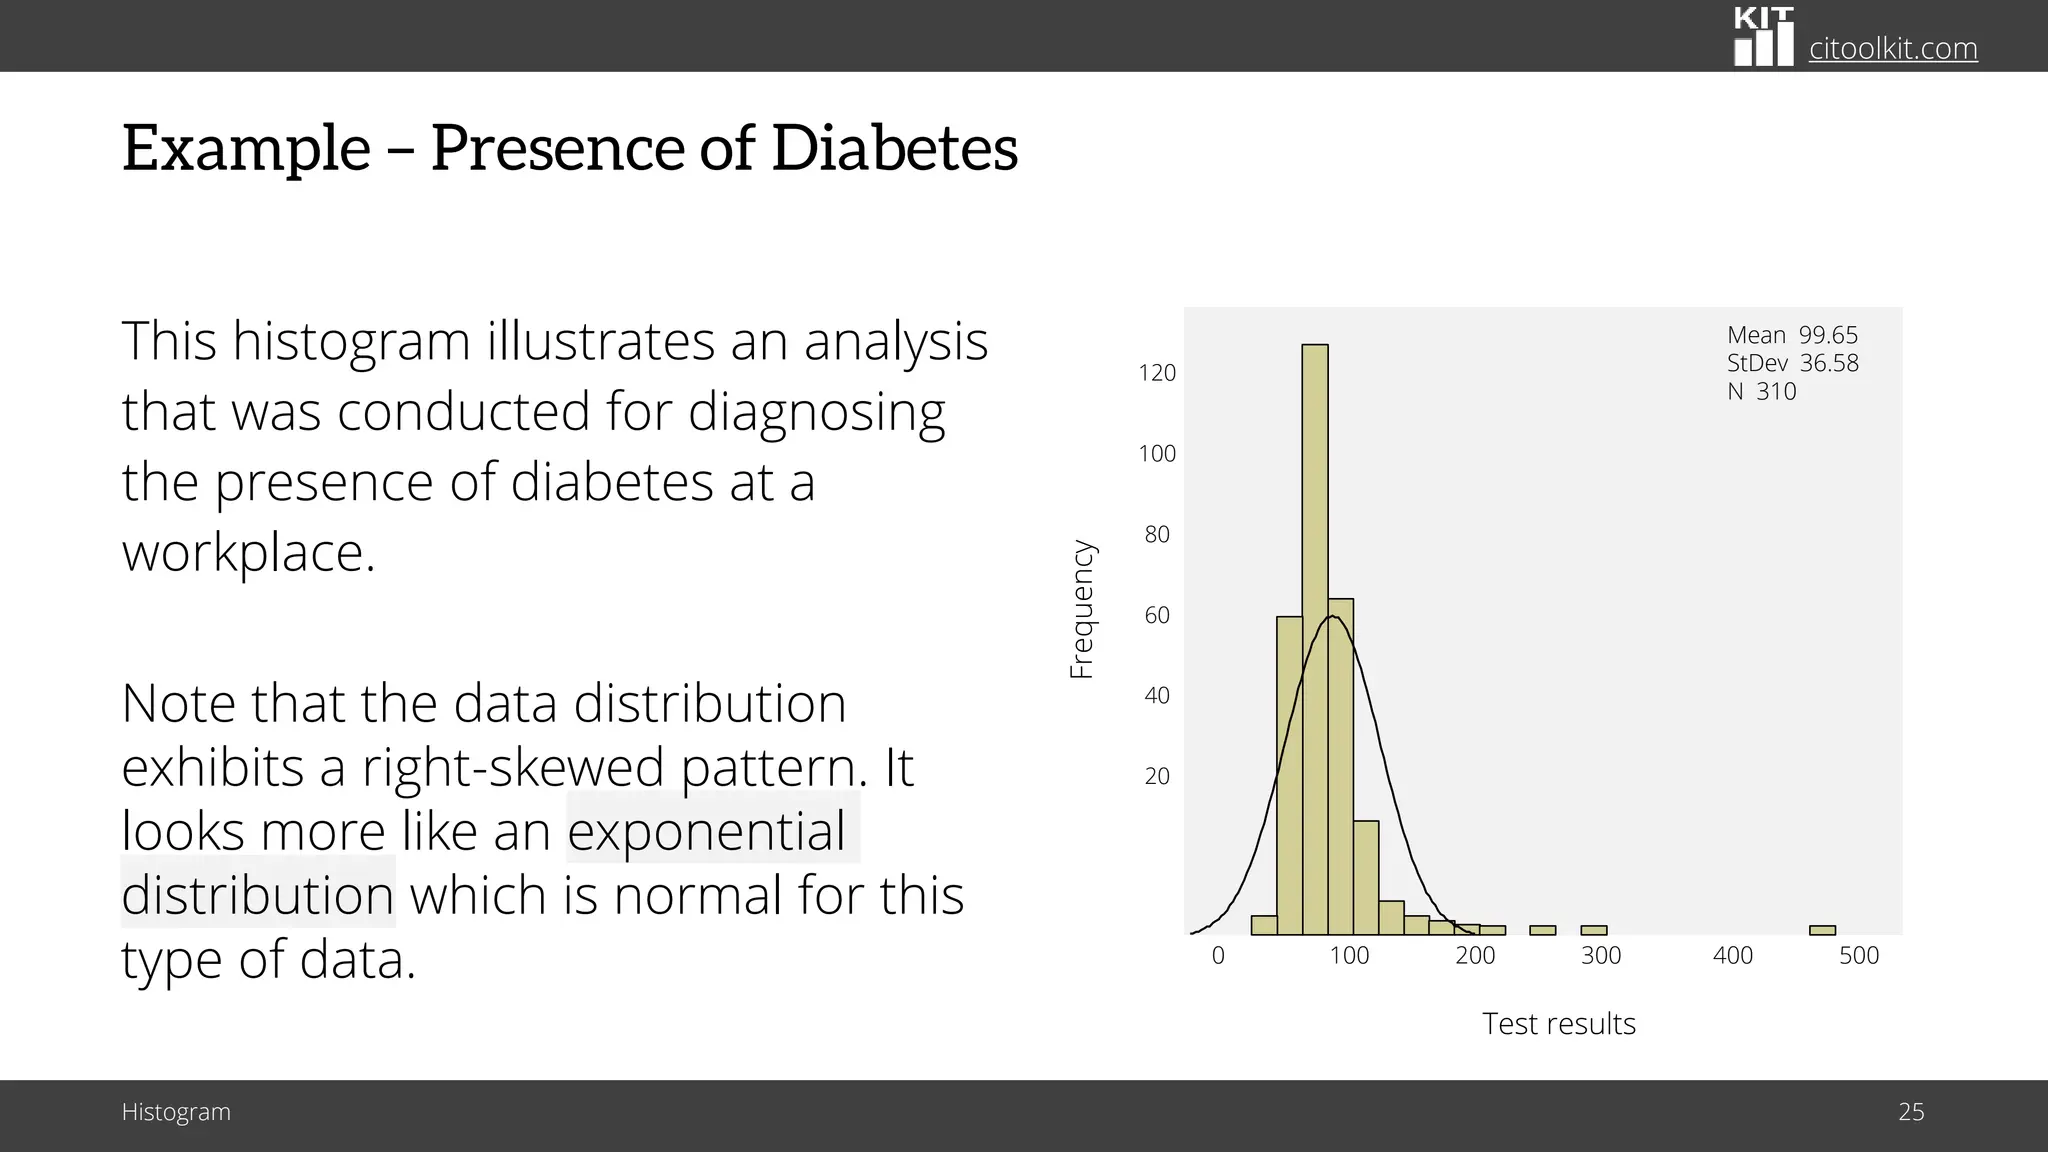
CITOOLKIT
Histogram
The Role of Histograms in Exploring Data Insights
citoolkit.com
Introduction
One of the best ways to analyze any process is to plot the data on a graph
or chart.
Histogram 2
*
X
X
X
X
X
X
X
X
X
X
X
citoolkit.com
Definition
A histogram is a graphical way that summarizes the important aspects of
the distribution of continuous data.
Histogram 3
A type of
bar chart
citoolkit.com
Definition
Histograms are sometimes called Frequency Plots as they show the
frequency of continuous data values on a graph.
Histogram 4
Number
of
occurrence
(frequency)
|––––––––– Value bins –––––––––|
While Pareto charts plot the frequency of count data!
citoolkit.com
Vertical vs. Horizontal
Can be drawn either vertically or horizontally.
Histogram 5
|–––––– FREQUENCY ––––––|
|–––––
FREQUENCY
–––––|
The height of the column indicates how often that data value occurred.
citoolkit.com
Applications
Histograms are widely used in statistics, scientific research, higher
education, process improvement, and in social and human sciences.
Histogram 6
Mainly used to explore data as well
as to present the data in an easy
and understandable manner
citoolkit.com
Characteristics
Plotting the data using a histogram allows to explore many characteristics
of the data . . .
Histogram 7
Central tendency
and the amount of
spread
Minimum and
maximum values
The shape of data
(symmetric or
skewed)
Whether it’s
unimodal, bimodal
or multimodal
citoolkit.com
Characteristics
It allows to visually and quickly assess . . .
Histogram 8
Spread Outliers
Gap
Center
*
The central tendency and
the amount of spread in the
data
The shape of the
distribution
The presence of gaps,
outliers or unusual data
points
citoolkit.com
Characteristics
It allows to visually and quickly assess . . .
Histogram 9
Spread Outliers
Gap
Center
*
Shows where most of
the data exists
citoolkit.com
Spread Outliers
Gap
Center
*
Characteristics
It allows to visually and quickly assess . . .
Creates a picture of the
variation in a process.
Histogram 10
Enables to quickly identify the
spread of the data
citoolkit.com
Characteristics
It allows to visually and quickly assess . . .
Histogram 11
Spread Outliers
Gap
Center
*
Overall shape shows
how the data is
distributed
citoolkit.com
Characteristics
It allows to visually and quickly assess . . .
Histogram 12
Spread Outliers
Gap
Center
*
Helps to find unusual
data points and
outliers that may need
further investigation
citoolkit.com
Characteristics
It allows to visually and quickly assess . . .
Histogram 13
Spread Outliers
Gap
Center
*
Helps to find unusual
data points and
outliers that may need
further investigation
Overall shape shows
how the data is
distributed
Enables to quickly identify the
spread of the data
Shows where most of
the data exists
citoolkit.com
Uses
Used as the first step to determine the underlying probability distribution
of a data set.
Histogram 14
Allows to shape the sample data to make predictions and draw conclusions about
an entire population.
citoolkit.com
Uses
Histograms are used to identify . . .
Histogram 15
Whether the process is capable or not
Whether variability is within specification limits
Whether there is a shift in the process
Whether you can apply certain statistical tests
Patterns that provide clues to certain types of problems
citoolkit.com
Uses
Used to verify that the changes made were a real improvement.
Histogram 16
Before
LSL USL
After
LSL USL
citoolkit.com
Data Size
Ideal to represent moderate to large amount of data.
Histogram 17
N = 40 N = 14
In practice, a sample size of at least 30 data values would be sufficient.
citoolkit.com
Data Size
It may not accurately display the distribution shape if the data size is too
small.
Histogram 18
Dot plots are preferred over histograms when representing small amount of data.
citoolkit.com
Steps for Manually Constructing a Histogram
Histogram 19
Collect the data set and prepare it for the analysis
• Create a summary table of the data.
Data
citoolkit.com
Steps for Manually Constructing a Histogram
Histogram 20
Draw a horizontal line and divide it into equal intervals or bins (12 intervals for example)
• The total width should be equal to the range of the data.
citoolkit.com
Steps for Manually Constructing a Histogram
Histogram 21
Draw bars above each bin to represent the frequency of the data values within each interval
• The bars should be adjacent with no gaps between them (to indicate the
continuity of the data).
citoolkit.com
Steps for Manually Constructing a Histogram
Histogram 22
Calculate the mean of the data
• Indicate the standard deviation and the specification limits.
Mean
LSL
citoolkit.com
Example – Cable Diameters
The following is a histogram that represents the distribution of cable
diameters for a manufacturing process.
Histogram 23
0.60
0.58
0.56
0.54
0.52
0.50
20
1 5
1 0
5
0
Mean 0.5465
StDev 0.01934
N 100
Diameter of cable
Frequency
Data source: Minitab
citoolkit.com
Example – Cable Diameters
The result can be summarized using day to day language such as:
Histogram 24
0.60
0.58
0.56
0.54
0.52
0.50
20
1 5
1 0
5
0
Mean 0.5465
StDev 0.01934
N 100
Diameter of cable
Frequency
Data source: Minitab
“The distribution looks
symmetric around the
cable diameter mean
(0.546 cm) and appears
to fit the Normal
Distribution”
citoolkit.com
Example – Presence of Diabetes
This histogram illustrates an analysis
that was conducted for diagnosing
the presence of diabetes at a
workplace.
Histogram 25
0 100 200 300 400 500
120
100
80
60
40
20
Mean 99.65
StDev 36.58
N 310
Test results
Frequency
Note that the data distribution
exhibits a right-skewed pattern. It
looks more like an exponential
distribution which is normal for this
type of data.
citoolkit.com
Further Information
Histogram 26
Histograms, however, can’t see changes and trends
over time
Histograms like control charts can be used to assess improvement
overtime
citoolkit.com
Further Information
You can illustrate a stratification factor in histograms.
Histogram 27
MORNING SHIFT EVENING SHIFT NIGHT SHIFT
citoolkit.com
Further Information
There are many applications and online services that allow the creation of
histograms quickly and automatically (such as Minitab, JMP, and SPSS).
Histogram 28
© Copyright Citoolkit.com. All Rights Reserved.
CITOOLKIT
Made with by
The Continuous Improvement Toolkit
www.citoolkit.com

The Role of Histograms in Exploring Data Insights

  • 1.
    CITOOLKIT Histogram The Role ofHistograms in Exploring Data Insights
  • 2.
    citoolkit.com Introduction One of thebest ways to analyze any process is to plot the data on a graph or chart. Histogram 2 * X X X X X X X X X X X
  • 3.
    citoolkit.com Definition A histogram isa graphical way that summarizes the important aspects of the distribution of continuous data. Histogram 3 A type of bar chart
  • 4.
    citoolkit.com Definition Histograms are sometimescalled Frequency Plots as they show the frequency of continuous data values on a graph. Histogram 4 Number of occurrence (frequency) |––––––––– Value bins –––––––––| While Pareto charts plot the frequency of count data!
  • 5.
    citoolkit.com Vertical vs. Horizontal Canbe drawn either vertically or horizontally. Histogram 5 |–––––– FREQUENCY ––––––| |––––– FREQUENCY –––––| The height of the column indicates how often that data value occurred.
  • 6.
    citoolkit.com Applications Histograms are widelyused in statistics, scientific research, higher education, process improvement, and in social and human sciences. Histogram 6 Mainly used to explore data as well as to present the data in an easy and understandable manner
  • 7.
    citoolkit.com Characteristics Plotting the datausing a histogram allows to explore many characteristics of the data . . . Histogram 7 Central tendency and the amount of spread Minimum and maximum values The shape of data (symmetric or skewed) Whether it’s unimodal, bimodal or multimodal
  • 8.
    citoolkit.com Characteristics It allows tovisually and quickly assess . . . Histogram 8 Spread Outliers Gap Center * The central tendency and the amount of spread in the data The shape of the distribution The presence of gaps, outliers or unusual data points
  • 9.
    citoolkit.com Characteristics It allows tovisually and quickly assess . . . Histogram 9 Spread Outliers Gap Center * Shows where most of the data exists
  • 10.
    citoolkit.com Spread Outliers Gap Center * Characteristics It allowsto visually and quickly assess . . . Creates a picture of the variation in a process. Histogram 10 Enables to quickly identify the spread of the data
  • 11.
    citoolkit.com Characteristics It allows tovisually and quickly assess . . . Histogram 11 Spread Outliers Gap Center * Overall shape shows how the data is distributed
  • 12.
    citoolkit.com Characteristics It allows tovisually and quickly assess . . . Histogram 12 Spread Outliers Gap Center * Helps to find unusual data points and outliers that may need further investigation
  • 13.
    citoolkit.com Characteristics It allows tovisually and quickly assess . . . Histogram 13 Spread Outliers Gap Center * Helps to find unusual data points and outliers that may need further investigation Overall shape shows how the data is distributed Enables to quickly identify the spread of the data Shows where most of the data exists
  • 14.
    citoolkit.com Uses Used as thefirst step to determine the underlying probability distribution of a data set. Histogram 14 Allows to shape the sample data to make predictions and draw conclusions about an entire population.
  • 15.
    citoolkit.com Uses Histograms are usedto identify . . . Histogram 15 Whether the process is capable or not Whether variability is within specification limits Whether there is a shift in the process Whether you can apply certain statistical tests Patterns that provide clues to certain types of problems
  • 16.
    citoolkit.com Uses Used to verifythat the changes made were a real improvement. Histogram 16 Before LSL USL After LSL USL
  • 17.
    citoolkit.com Data Size Ideal torepresent moderate to large amount of data. Histogram 17 N = 40 N = 14 In practice, a sample size of at least 30 data values would be sufficient.
  • 18.
    citoolkit.com Data Size It maynot accurately display the distribution shape if the data size is too small. Histogram 18 Dot plots are preferred over histograms when representing small amount of data.
  • 19.
    citoolkit.com Steps for ManuallyConstructing a Histogram Histogram 19 Collect the data set and prepare it for the analysis • Create a summary table of the data. Data
  • 20.
    citoolkit.com Steps for ManuallyConstructing a Histogram Histogram 20 Draw a horizontal line and divide it into equal intervals or bins (12 intervals for example) • The total width should be equal to the range of the data.
  • 21.
    citoolkit.com Steps for ManuallyConstructing a Histogram Histogram 21 Draw bars above each bin to represent the frequency of the data values within each interval • The bars should be adjacent with no gaps between them (to indicate the continuity of the data).
  • 22.
    citoolkit.com Steps for ManuallyConstructing a Histogram Histogram 22 Calculate the mean of the data • Indicate the standard deviation and the specification limits. Mean LSL
  • 23.
    citoolkit.com Example – CableDiameters The following is a histogram that represents the distribution of cable diameters for a manufacturing process. Histogram 23 0.60 0.58 0.56 0.54 0.52 0.50 20 1 5 1 0 5 0 Mean 0.5465 StDev 0.01934 N 100 Diameter of cable Frequency Data source: Minitab
  • 24.
    citoolkit.com Example – CableDiameters The result can be summarized using day to day language such as: Histogram 24 0.60 0.58 0.56 0.54 0.52 0.50 20 1 5 1 0 5 0 Mean 0.5465 StDev 0.01934 N 100 Diameter of cable Frequency Data source: Minitab “The distribution looks symmetric around the cable diameter mean (0.546 cm) and appears to fit the Normal Distribution”
  • 25.
    citoolkit.com Example – Presenceof Diabetes This histogram illustrates an analysis that was conducted for diagnosing the presence of diabetes at a workplace. Histogram 25 0 100 200 300 400 500 120 100 80 60 40 20 Mean 99.65 StDev 36.58 N 310 Test results Frequency Note that the data distribution exhibits a right-skewed pattern. It looks more like an exponential distribution which is normal for this type of data.
  • 26.
    citoolkit.com Further Information Histogram 26 Histograms,however, can’t see changes and trends over time Histograms like control charts can be used to assess improvement overtime
  • 27.
    citoolkit.com Further Information You canillustrate a stratification factor in histograms. Histogram 27 MORNING SHIFT EVENING SHIFT NIGHT SHIFT
  • 28.
    citoolkit.com Further Information There aremany applications and online services that allow the creation of histograms quickly and automatically (such as Minitab, JMP, and SPSS). Histogram 28
  • 29.
    © Copyright Citoolkit.com.All Rights Reserved. CITOOLKIT Made with by The Continuous Improvement Toolkit www.citoolkit.com