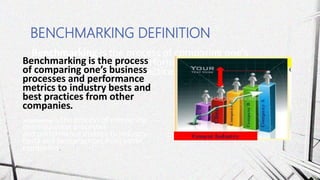
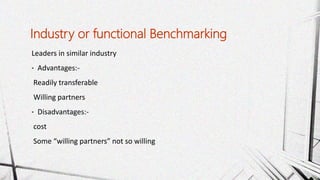
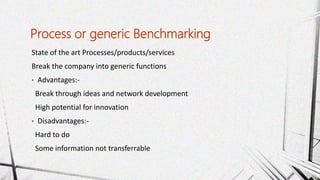
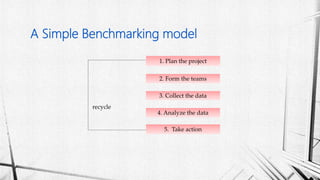
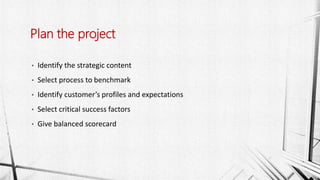
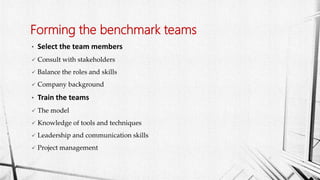
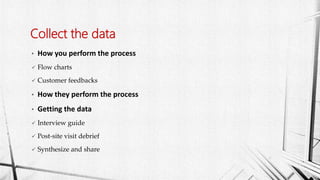
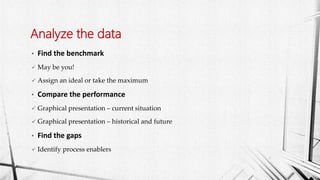
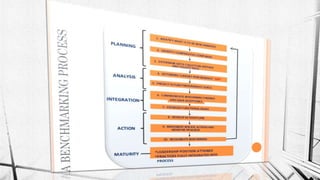
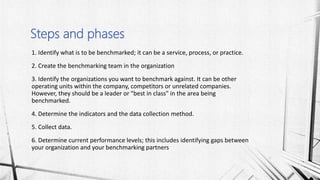
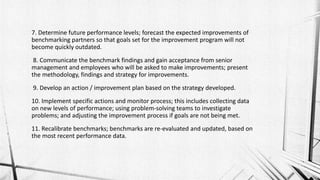
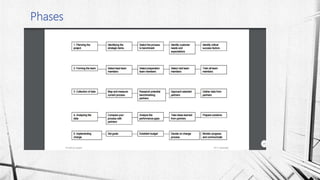
BENCHMARKING
NAVYA SREE .S
VIT UNIVERSITY
 Why Benchmarking ?
Kinds of Benchmarking
Benchmarking process
Benchmarking metrics
OUTLINE
 Benchmarking Definition
Benchmarking is the process of comparing one's
business processes and performance metrics to
industry bests and best practices from other
companies.
BENCHMARKING DEFINITION
Benchmarking is the process
of comparing one’s business
processes and performance
metrics to industry bests and
best practices from other
companies.
.nchmarking is the process of comparing
one's business processes
and performance metrics to industry
bests and best practices from other
companies.
Why are others better?
How are others better?
How can we learn?
How can we become the best in our industry?
Benchmarking is the practice of being humble
enough to admit that someone else is better at
something and wise enough to try and learn how
to match and even surpass them at it.
Benchmarking Definition
Kinds of Benchmarking
Benchmarking process
Benchmarking metrics
OUTLINE
 Why Benchmarking?
• Traditional performance improvement trends seem not to be
sufficient for the highly competitive markets. In other words
external environment and market conditions change rapidly.
• Customer’s expectations are highly liquid and are driven by
standards set by best performer. Any product or service just below
these standards may not catch the eyes of customer
• Prevents the “Re-inventing the wheel”.
Why Benchmarking?
Better awareness of Ourselves (us)
• What are we doing
• How are we doing
• How well are we doing
Better awareness of the best (them)
• What they are doing
• How they are doing it
• How well they are doing it
 Benchmarking gives us the chance of
gaining
Benchmarking Definition
 Why Benchmarking ?
Benchmarking process
Benchmarking metrics
OUTLINE
Types of Benchmarking
• Internal benchmarking
• Competitive benchmarking
• Industry or Functional benchmarking
• Process or Generic benchmarking
Types of Benchmarking
Similar activities in different departments, locations etc.
• Advantages:-
Sharing communication, data easy to get, good results.
Immediate benefit and good practices.
• Disadvantages:-
Limited focus, Internal focus.
“Miss the boat”
Internal Benchmarking
Direct competitors, same customer base.
• Advantages:-
Directly relevant , Comparable practices and technologies.
History of information.
• Disadvantages:-
Data collection difficulties and ethical issues.
Antagonism.
Competitive Benchmarking
Leaders in similar industry
• Advantages:-
Readily transferable
Willing partners
• Disadvantages:-
cost
Some “willing partners” not so willing
Industry or functional Benchmarking
State of the art Processes/products/services
Break the company into generic functions
• Advantages:-
Break through ideas and network development
High potential for innovation
• Disadvantages:-
Hard to do
Some information not transferrable
Process or generic Benchmarking
Benchmarking Definition
 Why Benchmarking ?
Types of benchmarking
Benchmarking metrics
OUTLINE
Benchmarking process
A Simple Benchmarking model
1. Plan the project
2. Form the teams
3. Collect the data
4. Analyze the data
5. Take action
recycle
• Identify the strategic content
• Select process to benchmark
• Identify customer’s profiles and expectations
• Select critical success factors
• Give balanced scorecard
Plan the project
• Select the team members
 Consult with stakeholders
 Balance the roles and skills
 Company background
• Train the teams
 The model
 Knowledge of tools and techniques
 Leadership and communication skills
 Project management
Forming the benchmark teams
• How you perform the process
 Flow charts
 Customer feedbacks
• How they perform the process
• Getting the data
 Interview guide
 Post-site visit debrief
 Synthesize and share
Collect the data
• Find the benchmark
 May be you!
 Assign an ideal or take the maximum
• Compare the performance
 Graphical presentation – current situation
 Graphical presentation – historical and future
• Find the gaps
 Identify process enablers
Analyze the data
• Set goals
 Close the performance gaps
• Decide change processes
 Adapt to match company culture
• Prepare budget
 Commit resources
• Implement
 Train, gain acceptance and support
Take action
1. Identify what is to be benchmarked; it can be a service, process, or practice.
2. Create the benchmarking team in the organization
3. Identify the organizations you want to benchmark against. It can be other
operating units within the company, competitors or unrelated companies.
However, they should be a leader or "best in class" in the area being
benchmarked.
4. Determine the indicators and the data collection method.
5. Collect data.
6. Determine current performance levels; this includes identifying gaps between
your organization and your benchmarking partners
Steps and phases
7. Determine future performance levels; forecast the expected improvements of
benchmarking partners so that goals set for the improvement program will not
become quickly outdated.
8. Communicate the benchmark findings and gain acceptance from senior
management and employees who will be asked to make improvements; present
the methodology, findings and strategy for improvements.
9. Develop an action / improvement plan based on the strategy developed.
10. Implement specific actions and monitor process; this includes collecting data
on new levels of performance; using problem-solving teams to investigate
problems; and adjusting the improvement process if goals are not being met.
11. Recalibrate benchmarks; benchmarks are re-evaluated and updated, based on
the most recent performance data.
Phases
Benchmarking Definition
 Why Benchmarking ?
Types of benchmarking
Benchmarking process
OUTLINE
Benchmarking metrics
A Useful Software Metric Should:
1. Be standardized
2. Be unambiguous
3. Have a formal user group
4. Have adequate published data
5. Have tools available for new projects
6. Have tools available for legacy projects
Software metrics criteria
7. Have conversion rules for related metrics
8. Deal with all deliverables
9. Support all kinds of software
10. Support all programming languages plus mixed
11. Support all sizes of applications
12. Support new + reused artifacts
13. Be cost-effective and fast to apply
• A function point is a "unit of measurement" to express the
amount of business functionality an information system (as a
product) provides to a user.
• Function points are used to compute a functional size
measurement (FSM) of software. The cost (in dollars or hours) of a
single unit is calculated from past projects.
• Function points are the major metric for software benchmarks
involving productivity, schedules, costs, or quality.
Function points
• Function points match standard economic definitions for productivity
analysis
• Function points do not distort quality and productivity as do “Lines of
Code” or LOC metrics.
• Function points support activity-based cost analysis, baselines,
benchmarks, quality, cost, and value studies.
• Lines of code metrics penalize high-level programming languages.
• If used for economic studies with more than one language LOC metrics
should be considered professional malpractice.
Function point success
• Cost per defect metrics penalize quality and make buggy software
look best. For quality economic studies cost per defect metrics are
invalid. Function points are best.
• Function point metrics have the widest range of use of any
software metric in history: they work for both economic and
quality analyses.
Function point success
Migration to functional metrics
• Requirements change at 1% to 3% per month during development.
• Requirements change at 5% to 8% per year after deployment.
• Some large systems are used for more than 25 years.
• Size at end of requirements = 10,000 Function points
• Size at first delivery = 13,000 function points
• Size after 5 years of usage = 18,000 function points
• Size after 25 years of usage = 25,000 function points
• Sizing should be continuous from requirements to retirement.
• Continuous sizing needs low cost, high speed function points.
Functional points and requirements
Software quality ranges
• 1. Function points stay constant regardless of programming languages used
• 2. Function points are a good choice for full life-cycle analysis
• 3. Function points are a good choice for benchmarks and economic studies
• 4. Function points are supported by many software estimating tools
• 5. Function points can be converted into logical code statements
Strengths
• 1. Accurate counting requires certified function point specialists
• 2. Function point counting can be time-consuming and expensive
• 3. There is a need for automated function point counts from requirements
• 4. There is a need for automated function point counts from
• 5. IFPUG has no rules dealing with backfiring
• 6. IFPUG needs “micro function points” for small updates
Weakness
To become a true engineering discipline, many metrics and measurement
approaches are needed:
• Accurate Effort, Cost, and Schedule Data
• Accurate Defect, Quality, and User-Satisfaction Data
• Accurate Usage data
• Source code volumes for all languages
• Types and volumes of paper documents
• Volume of data and information used by software
• Consistent and reliable complexity information
Function points alone are not enough
• POTENTIAL BUSINESS METRICS
• • Function points - Measures software size
• • Data points - Measures data base size
• • Service points - Measures support size
• • Engineering points - Measures hardware size
• • Value points - Measures tangible value
Function points and other metrics

Benchmarking

  • 1.
  • 2.
     Why Benchmarking? Kinds of Benchmarking Benchmarking process Benchmarking metrics OUTLINE  Benchmarking Definition
  • 3.
    Benchmarking is theprocess of comparing one's business processes and performance metrics to industry bests and best practices from other companies. BENCHMARKING DEFINITION Benchmarking is the process of comparing one’s business processes and performance metrics to industry bests and best practices from other companies. .nchmarking is the process of comparing one's business processes and performance metrics to industry bests and best practices from other companies.
  • 4.
    Why are othersbetter? How are others better? How can we learn? How can we become the best in our industry? Benchmarking is the practice of being humble enough to admit that someone else is better at something and wise enough to try and learn how to match and even surpass them at it.
  • 5.
    Benchmarking Definition Kinds ofBenchmarking Benchmarking process Benchmarking metrics OUTLINE  Why Benchmarking?
  • 6.
    • Traditional performanceimprovement trends seem not to be sufficient for the highly competitive markets. In other words external environment and market conditions change rapidly. • Customer’s expectations are highly liquid and are driven by standards set by best performer. Any product or service just below these standards may not catch the eyes of customer • Prevents the “Re-inventing the wheel”. Why Benchmarking?
  • 7.
    Better awareness ofOurselves (us) • What are we doing • How are we doing • How well are we doing Better awareness of the best (them) • What they are doing • How they are doing it • How well they are doing it  Benchmarking gives us the chance of gaining
  • 8.
    Benchmarking Definition  WhyBenchmarking ? Benchmarking process Benchmarking metrics OUTLINE Types of Benchmarking
  • 9.
    • Internal benchmarking •Competitive benchmarking • Industry or Functional benchmarking • Process or Generic benchmarking Types of Benchmarking
  • 10.
    Similar activities indifferent departments, locations etc. • Advantages:- Sharing communication, data easy to get, good results. Immediate benefit and good practices. • Disadvantages:- Limited focus, Internal focus. “Miss the boat” Internal Benchmarking
  • 11.
    Direct competitors, samecustomer base. • Advantages:- Directly relevant , Comparable practices and technologies. History of information. • Disadvantages:- Data collection difficulties and ethical issues. Antagonism. Competitive Benchmarking
  • 12.
    Leaders in similarindustry • Advantages:- Readily transferable Willing partners • Disadvantages:- cost Some “willing partners” not so willing Industry or functional Benchmarking
  • 13.
    State of theart Processes/products/services Break the company into generic functions • Advantages:- Break through ideas and network development High potential for innovation • Disadvantages:- Hard to do Some information not transferrable Process or generic Benchmarking
  • 14.
    Benchmarking Definition  WhyBenchmarking ? Types of benchmarking Benchmarking metrics OUTLINE Benchmarking process
  • 15.
    A Simple Benchmarkingmodel 1. Plan the project 2. Form the teams 3. Collect the data 4. Analyze the data 5. Take action recycle
  • 16.
    • Identify thestrategic content • Select process to benchmark • Identify customer’s profiles and expectations • Select critical success factors • Give balanced scorecard Plan the project
  • 17.
    • Select theteam members  Consult with stakeholders  Balance the roles and skills  Company background • Train the teams  The model  Knowledge of tools and techniques  Leadership and communication skills  Project management Forming the benchmark teams
  • 18.
    • How youperform the process  Flow charts  Customer feedbacks • How they perform the process • Getting the data  Interview guide  Post-site visit debrief  Synthesize and share Collect the data
  • 19.
    • Find thebenchmark  May be you!  Assign an ideal or take the maximum • Compare the performance  Graphical presentation – current situation  Graphical presentation – historical and future • Find the gaps  Identify process enablers Analyze the data
  • 20.
    • Set goals Close the performance gaps • Decide change processes  Adapt to match company culture • Prepare budget  Commit resources • Implement  Train, gain acceptance and support Take action
  • 22.
    1. Identify whatis to be benchmarked; it can be a service, process, or practice. 2. Create the benchmarking team in the organization 3. Identify the organizations you want to benchmark against. It can be other operating units within the company, competitors or unrelated companies. However, they should be a leader or "best in class" in the area being benchmarked. 4. Determine the indicators and the data collection method. 5. Collect data. 6. Determine current performance levels; this includes identifying gaps between your organization and your benchmarking partners Steps and phases
  • 23.
    7. Determine futureperformance levels; forecast the expected improvements of benchmarking partners so that goals set for the improvement program will not become quickly outdated. 8. Communicate the benchmark findings and gain acceptance from senior management and employees who will be asked to make improvements; present the methodology, findings and strategy for improvements. 9. Develop an action / improvement plan based on the strategy developed. 10. Implement specific actions and monitor process; this includes collecting data on new levels of performance; using problem-solving teams to investigate problems; and adjusting the improvement process if goals are not being met. 11. Recalibrate benchmarks; benchmarks are re-evaluated and updated, based on the most recent performance data.
  • 24.
  • 25.
    Benchmarking Definition  WhyBenchmarking ? Types of benchmarking Benchmarking process OUTLINE Benchmarking metrics
  • 26.
    A Useful SoftwareMetric Should: 1. Be standardized 2. Be unambiguous 3. Have a formal user group 4. Have adequate published data 5. Have tools available for new projects 6. Have tools available for legacy projects Software metrics criteria
  • 27.
    7. Have conversionrules for related metrics 8. Deal with all deliverables 9. Support all kinds of software 10. Support all programming languages plus mixed 11. Support all sizes of applications 12. Support new + reused artifacts 13. Be cost-effective and fast to apply
  • 28.
    • A functionpoint is a "unit of measurement" to express the amount of business functionality an information system (as a product) provides to a user. • Function points are used to compute a functional size measurement (FSM) of software. The cost (in dollars or hours) of a single unit is calculated from past projects. • Function points are the major metric for software benchmarks involving productivity, schedules, costs, or quality. Function points
  • 29.
    • Function pointsmatch standard economic definitions for productivity analysis • Function points do not distort quality and productivity as do “Lines of Code” or LOC metrics. • Function points support activity-based cost analysis, baselines, benchmarks, quality, cost, and value studies. • Lines of code metrics penalize high-level programming languages. • If used for economic studies with more than one language LOC metrics should be considered professional malpractice. Function point success
  • 30.
    • Cost perdefect metrics penalize quality and make buggy software look best. For quality economic studies cost per defect metrics are invalid. Function points are best. • Function point metrics have the widest range of use of any software metric in history: they work for both economic and quality analyses. Function point success
  • 31.
  • 32.
    • Requirements changeat 1% to 3% per month during development. • Requirements change at 5% to 8% per year after deployment. • Some large systems are used for more than 25 years. • Size at end of requirements = 10,000 Function points • Size at first delivery = 13,000 function points • Size after 5 years of usage = 18,000 function points • Size after 25 years of usage = 25,000 function points • Sizing should be continuous from requirements to retirement. • Continuous sizing needs low cost, high speed function points. Functional points and requirements
  • 33.
  • 34.
    • 1. Functionpoints stay constant regardless of programming languages used • 2. Function points are a good choice for full life-cycle analysis • 3. Function points are a good choice for benchmarks and economic studies • 4. Function points are supported by many software estimating tools • 5. Function points can be converted into logical code statements Strengths
  • 35.
    • 1. Accuratecounting requires certified function point specialists • 2. Function point counting can be time-consuming and expensive • 3. There is a need for automated function point counts from requirements • 4. There is a need for automated function point counts from • 5. IFPUG has no rules dealing with backfiring • 6. IFPUG needs “micro function points” for small updates Weakness
  • 36.
    To become atrue engineering discipline, many metrics and measurement approaches are needed: • Accurate Effort, Cost, and Schedule Data • Accurate Defect, Quality, and User-Satisfaction Data • Accurate Usage data • Source code volumes for all languages • Types and volumes of paper documents • Volume of data and information used by software • Consistent and reliable complexity information Function points alone are not enough
  • 37.
    • POTENTIAL BUSINESSMETRICS • • Function points - Measures software size • • Data points - Measures data base size • • Service points - Measures support size • • Engineering points - Measures hardware size • • Value points - Measures tangible value Function points and other metrics