SlideShare a Scribd company logo
International Research Journal of Engineering and Technology (IRJET) e-ISSN: 2395-0056
Volume: 05 Issue: 06 | June-2018 www.irjet.net p-ISSN: 2395-0072
© 2018, IRJET | Impact Factor value: 6.171 | ISO 9001:2008 Certified Journal | Page 112
COMPARATIVE ANALYSIS BETWEEN CRITICAL PATH METHOD AND
MONTE CARLO SIMULATION
Tungesh Tanuj Karthik Naidu1, Prof. Ravi U. Angadi2
1M.TECH student, Civil Engineering Dept., Jain College of Engineering, Karnataka, India
2Asst. Professor, Civil Engineering Dept., Jain College of Engineering, Karnataka, India
---------------------------------------------------------------------***---------------------------------------------------------------------
Abstract - Time is a major factor in almost all areas of
engineering. Every project is estimated for the completion
time required based on the tasks and objectives involved for
its execution. Project management enterprises mainly work
on completing a project by the set schedule. A constant
evolution has been made in determining the completion
time of every project to best suit the real time execution. The
techniques involved to determine the time of completion are
critical path method, program evaluation and review
technique, precedence network analysis and Monte Carlo
simulations. These methods are employed based on the risk
and uncertainty involved in the projects. The objective of
this project was to analyse the difference between the
critical path method and the Monte Carlo simulation. For
this purpose a live project was taken up and the activities
involved in the project were listed. The project completion
time using the critical path method was found out using
Microsoft Project 2013, while the project completion time
using the Monte Carlo simulations was found out using
Oracle Crystal Ball Software. The results obtained from the
both the softwares were compared to determine the
percentage difference. Based on the variance between the
actual and scheduled durations, the durations for the three
time estimates were modified and the simulations were
performed again to determine the probable completion time
of the project. The results were obtained and conclusions
were made on the applicability of Monte Carlo simulation in
the Construction Industry.
Key Words: Construction project, Scheduling, Critical
Path Method, PERT, Monte Carlo simulation, Project
Tracking.
1. INTRODUCTION
Construction has made numerous marvels on the planet
and has imbibed numerous technologies for the advantage
of the humankind. Construction is a noteworthy segment
of the new ventures. The construction industry is
fundamental for the development of the economy of any
nation. The construction of capital intensive projects is
always undertaken by ‘projectising’ them, i.e. to create a
work break down structure of the project into activities or
events for smooth execution of the project.
The most important factors that govern the success of any
construction project are planning, scheduling, monitoring
and controlling. The planning involves understanding the
client’s view of the project and developing and designing a
plan accordingly, which is followed by estimating the
quantity of work and formation of a contract. The
scheduling involves the estimation of the complete project
duration and creating a database for updating of actual
progress. In the monitoring phase the work is performed
according to the schedule prepared, lag and lead in activity
times is adjusted to keep the project on track. Controlling
phase involves applying additional resources on activities
that would otherwise prolong the project. This particular
paper however deals with the scheduling phase of a
project. The various methods used to schedule a project
are critical path method, program evaluation and review
technique and Monte Carlo simulation.
1.1 Critical Path Method
The critical path method is a well ordered venture
administration procedure to recognize activities on the
basic way. It is a way to deal with venture planning that
breaks the undertaking into a few work assignments,
shows us a stream outline, and afterward ascertains the
task term in light of evaluated lengths for each errand. It
basically tells us the longest path/duration of the project. It
is used for deterministic events and has just one time
estimate for each activity. It is abbreviated as CPM.
A set of sample activities were considered for
understanding the working of this process. The durations
were assumed and loaded for each activity. Further the
computation was done by calculating the earliest start
time, earliest finish time, latest start time and latest finish
time. Basically the earliest start time (EST) is the time by
which a project can start and earliest finish time (EFT)
signifies that an activity can finish by that particular time
and is calculated as EST + activity duration. The latest start
time (LST) and latest finish times (LFT) signify that the
activity has to compulsorily start or finish by that
particular time; otherwise the project could be delayed.
Latest start time is calculated as the difference between
LFT and activity duration and the Latest finish time is
calculated using the backward pass method. In the
backward pass method the EST and EFT are considered
same and the preceding activity duration is subtracted to
find the LFT of the preceding activity. Basically the
activities whose EST, LST and EFT, LFT are the same are
critical activities and take the most time to complete the
project. A network diagram connects all the activities and
represents their interdependencies.
International Research Journal of Engineering and Technology (IRJET) e-ISSN: 2395-0056
Volume: 05 Issue: 06 | June-2018 www.irjet.net p-ISSN: 2395-0072
© 2018, IRJET | Impact Factor value: 6.171 | ISO 9001:2008 Certified Journal | Page 113
1.2 Program Evaluation and Review Technique
This technique is also abbreviated as PERT. The
activities of the project and their network relationships
are well defined but it allows uncertainties in activity
durations. It is extremely difficult in today’s scenario to
determine the exact time one activity may take as there
are a lot of uncertainties involved. Therefore there are
three time estimates for every activity that take into
account these uncertainties which are described as
follows:-
a) Optimistic time: It is the minimum possible time which
an activity requires for its completion under ideal
conditions. In other words, it is the shortest time required
for activity completion assuming that everything during its
execution will go right. It does not include any sort of
setback or delay. It is denoted as to.
b) Pessimistic time: It is the maximum possible time that
an activity requires for its completion or the longest
estimated time period of an activity completion. It
estimates time assuming that lack of resources would be
there and so the activity may take excess time for
completion than actually required. It is denoted as tp.
c) Most likely time: It is the most probable time or simply
a more realistic time that an activity requires for its
completion. It normally considers a few delays which is
common for project execution. It is denoted as tm.
d) Expected time or Average time: It is the weighted
average time of the optimistic, pessimistic and most likely
time, or is basically converting the three time estimates to
one time estimate. It is denoted as Te. The formula for its
calculation is given below.
Once the expected time is calculated, it can be loaded back
into the network diagram from which the project
completion time is determined.
1.3 Monte Carlo Simulations
This technique works on the basis of probability
distributions and is a large amalgamation of statistics,
theoretical probability and random number generator.
Although it involves complex algorithms for calculation of
results, the working of it is quite straight forward. Suppose
we want to know the probability that a combination of
activities will occur we input into the system all the three
time estimates of all the activities along with their
respective variance. The Monte Carlo simulation will
generate a set of random numbers between 0 and 1 and
match those numbers with the probability of the
occurrence of the activity time. Suppose the probability of
the activity is 0.9 and the random number generated is 0.9,
the system will simulate that the activity will occur.
Thousands of such simulation can be run within the
system to find the combination of the frequently occurring
results. For instance if a 1000 trials were run and 900
trials returned the same result then that would be the final
output of the simulation. In a nut shell we humans
understand three time estimates but a system
understands the three time estimate data in the form of
probability distribution. The probability allows the system
to randomly select values from the probability distribution
chart and compute the output. The concept of randomness
is emphasized in the simulation to imitate the real life
scenario which is basically random meaning anything
could happen at any time.
2. LITERATURE REVIEW
The concept of this project was derived from reference
through various research papers that dealt with the
application of Monte Carlo Simulation in Construction
Industry. The work done by various researchers in this
area is briefly discussed by extracting relevant
information. Although the concept is similar the work
done by the respective researchers is unique in its own
way. The researchers have applied the concept of Monte
Carlo simulation to projects with different constraints to
obtain their desired outcomes and therefore present their
conclusions on the applicability of this simulation in the
field of construction.
K K Chitkara has in his book discussed the application of
probability distributions and Monte Carlo simulations in
determining project completion time. From his discussion
one cannot be sure of the actual value of the project
completion time in the initial stages of the project and
therefore probability distributions help to quantify the
uncertainties in a project. The application of Monte Carlo
simulation which is meant to imitate real life situations
was also detailed. The simulations are based on the
probability distributions. The results from the simulation
represent the uncertainty in the entire project.
K. Kirytopoulos et al. have in their research made a
comparison between the application of PERT and Monte
Carlo simulation in low risk projects. They concluded that
the simulation techniques allow for more efficient
modeling of the project than the conventional methods
such as critical path method and PERT.
Goran Avlijaš has in his paper dealt specifically with the
application of Monte Carlo simulation on Project time
management. He found that the Monte Carlo simulations
help in addressing the uncertainties in the project time
and networks to obtain a reasonable duration. The
durations estimates according to him can be more
accurate when risk adjusted schedules are used. Crystal
Ball software was used for applying the Monte Carlo
simulation, he assumed that the random variables follow a
International Research Journal of Engineering and Technology (IRJET) e-ISSN: 2395-0056
Volume: 05 Issue: 06 | June-2018 www.irjet.net p-ISSN: 2395-0072
© 2018, IRJET | Impact Factor value: 6.171 | ISO 9001:2008 Certified Journal | Page 114
Beta PERT distribution. A 1,000 trials were run and the
project completion time was found to be 45.89 days, and
the critical path duration was found to be 43 days. The
variation according to him was because of the path
mergers. He also determined the probability of completing
the project in 50 days and found it to be 77.69%. He finally
concluded that Monte Carlo simulation was a useful tool in
estimating project activities.
Pratik Ganame and Pravin Chaudhari have in their work
focused on risk identification by performing quantitative
and qualitative analysis. Their objective was to identify
key risk factors that affect project schedule and also to
determine the probability of completing the project within
the scheduled date. The qualitative analysis was done by
probability impact matrix and the quantitative analysis
was done by PERT and Monte Carlo simulation using
software called @RISK by Palisade corp.
Rafiq M. Choudhry, et. al, have in their research identified
and analysed risks associated with bridge construction in
Pakistan. They started off by identifying various risks
associated with a construction project and categorised
them under seven main sections which were distributed in
the form of questionnaires to engineers to determine the
impact of risks on the construction. The feedback was
used to create risk adjusted schedules. The simulation was
performed and the system generated schedule and cost
outputs were compared to the actual progress of the
project. This comparison showed that the simulation
results very nearly accurate with the actual project
progress of the project than the planned Critical Path
Method. Therefore the researchers concluded that a risk
analysis must be performed and loaded with the project
schedule to determine a more realistic schedule and cost.
Nurazin Jupri and Muhammad Rozi Malim had conducted
a case study on a medical campus, in which they analysed
the various risk management processes associated with
the construction of the campus. They identified two major
risk factors following which they performed schedule
analysis using PERT and Monte Carlo simulation. They
concluded that the project had a very low probability for
on time completion.
3. METHODOLOGY
The implementation was done on a live project, which is a
prayer hall having an area of 5000 sq ft. The first approach
was to create a sequence of activities that are to be
followed for the execution of the project, the second was
to take in account the number of days each activity would
require for completion. The next process involved loading
all of the activities with their respective durations into
Microsoft project, which is project management software.
This is done to determine the critical path and understand
the total project completion time, as doing this manually
would be an arduous task. Specific settings are made to
obtain the required output. Thereafter three time
durations are assigned for each activity, the optimistic
time, the most likely time and the pessimistic time. These
are then loaded with the activities into crystal ball, which
is basically a simulation software. A simulation is run to
determine the project completion time by that method,
also the probabilities of completing the project at any
given time is determined. The percentage difference
between the two time estimates is computed. Lastly the
actual progress of the project is compared with the two
time estimates to understand the accuracy of those time
estimates.
3.1 Project duration using Critical Path Method
The process followed to load the durations for each
activity was to first create a calendar within Microsoft
Project that matches the start time of our first activity. The
working days were set from Monday to Saturday with a
daily working time of eight hours. The work was expected
to start from 9:00 AM in the morning till 6:00 PM in the
evening. The lunch break of one hour was given from 1:00
PM to 2:00 PM. Sunday was designated as a non-working
day. The next task was to set holidays within the calendar
anticipating the absence of workers on those days. Once
the calendar was prepared it was assigned to the project.
The start date was taken as the 14th of December 2017.
The next most important step was to assign the activity
precedence relationship which basically signifies which
activity is to be executed after the completion of a
particular activity. Activities can start successively or
simultaneously. For instance bar bending of
reinforcements required for footings can start while the
excavation of the soil is happening, also the bar bending of
plinth beam reinforcements can happen simultaneously
with the backfill of excavated earth. However the backfill
of soil can only happen after the curing of footing concrete
which is a successive order. Therefore it was important to
establish this in order to obtain a critical path. Then the
precedence relationship was established, as shown in
figure 1.
Fig -1: Activities with their durations and precedence
relationship
International Research Journal of Engineering and Technology (IRJET) e-ISSN: 2395-0056
Volume: 05 Issue: 06 | June-2018 www.irjet.net p-ISSN: 2395-0072
© 2018, IRJET | Impact Factor value: 6.171 | ISO 9001:2008 Certified Journal | Page 115
Then few activities were made to start after a certain
completion of their preceding activities, for instance
placing of the reinforcing bars and their formwork for
footing can happen only after the pouring of P.C.C bed, but
the bar bending can start while the excavation has started
and can continue till the pouring of P.C.C bed. This process
of making an activity start after a certain completion of its
preceding activity is known as lead and lag of activities.
Lead is when an activity can start before its scheduled
time and lag is when an activity can start after its
scheduled time. In this project the use of lead time was
mainly done as a couple of activities could be started in
this manner. The bar bending work mainly, could start in
conjunction with the preceding activities, in this case a
lead time of 4 days was given to footing activity which is a
successor activity to both excavation and P.C.C bed, so the
relationship given was that it could start with excavation
and could also start 4 days before P.C.C bed, however P.C.C
bed can start only after excavation. Similarly another
activity, which is again the lintel and chejja activity, is
made to start with a lead of 1 day while the brickwork is
nearing completion.
3.2 Project duration using Monte Carlo
simulation.
The optimistic time, most likely time and the pessimistic
time was determined. The most likely time for the
activities was considered same as the one time duration
given by the contractor. The pessimistic time was given by
taking into account by considering various factors such as
labour shortage, delay in supply of material, shortage of
funds, and absence of labour and reconstruction of some
structures because of faulty construction that could
happen in every activity. For instance the execution time
for excavation could take more days than required if only
three labourers are employed instead of five labourers;
also as procuring natural sand can delay the start of most
activities that are dependent on it. The next scenario could
be that the clients fall short of funds which causes a break
in the project, also the staff of labourers employed may be
under experienced or may have in a hurry caused flaws in
the construction process. Hence there are many situations
that could prolong the duration of any activity. On the
other hand, the optimistic time is a complete contrast to
the assumptions made for deciding pessimistic time. For
instance, given the area of the site, the excavation of
earthwork can happen in a day if an excavator is
employed. Also instead of procuring natural sand
manufactured sand can be procured. Activities may be
completed sooner by employing more labourers or the
efficiency of labourers may be on the higher side. All the
three time estimates have been decided by consulting
professionals and have been loaded into the Crystal Ball
software.
The new action here was to establish the activity
dependence as many activities were given start to start
relationships with lead time, it was done by giving the
same start time of the preceding activity and the lead time
was subtracted to get the exact start time of the successive
activity. This computation was performed for all the
activities that had those activity dependencies. Activities
that had a finish to start relationship were simply assigned
the end time of their preceding activity.
Fig -2: Data input into Crystal Ball Software
The next step was to define the distribution assumption
that the activity should follow. Subject matter experts
suggest that a Beta PERT assumption must be
implemented as it predicts results more accurately. A
representation of this has been shown in figure 3, when
this distribution is selected a dialogue box appears in
which the three time estimates are entered.
Fig -3: Applying Beta PERT assumption
Finally when the assumption is applied to all the activities,
The Monte Carlo simulation is run to obtain the project
completion time. For accurate estimate of the time 10,000
trials were run. The results thus obtained from the Monte
Carlo simulations method are compared with the results
obtained from the critical path method.
4. RESULTS AND DISCUSSION
The basic intention was to make a comparison between
the critical path method and the Monte Carlo simulation.
For this a live project was taken up and the two methods
were implemented to find the total project duration.
Various efforts were made during the execution of this
project, the outputs were obtained and have been
analysed as to how they may be helpful in bettering our
way of time estimation.
International Research Journal of Engineering and Technology (IRJET) e-ISSN: 2395-0056
Volume: 05 Issue: 06 | June-2018 www.irjet.net p-ISSN: 2395-0072
© 2018, IRJET | Impact Factor value: 6.171 | ISO 9001:2008 Certified Journal | Page 116
4.1 Results obtained from Critical Path Method.
The results were obtained by entering the activities into
Microsoft project software, version 2013. Basically the
critical path, which is the longest duration of the entire
project was estimated from this software. This is
represented in figure 4.
Fig -4: Critical Path duration of project
The total duration of the entire project was found to be
122 days which is approximately 4 months, the project
was planned to start on 14th December 2017 and is
expected to complete on 8th April 2018. This output was
generated by taking into consideration all the constraints
in the form of lag and lead times.
The non-critical activities are electrification, ground floor
internal plastering, first floor internal plastering all three
of which have a slack time of 1 day and ground floor
windows has a slack time 18 days. This means that the
activities can be delayed to their respective slack days
without causing a delay to the entire project. However a
delay in the other activities which are critical will cause a
delay to the entire project.
4.2 Tracking of Project Progress
The project was monitored during its execution and the
progress was updated in Microsoft project. This was done
because usually the project varies from its scheduled time.
The tracking is represented in figure 5.
Fig -5: Actual project progress
The total project completion time turns out to be 186 days
which is approximately 6.1 months. Therefore there is a
variance of 2.1 months from the scheduled duration.
The footing activity takes 25 days for completion instead
of 10 days, also the difference between the scheduled start
and actual start of backfill activity is 25 days, 43 days for
plinth beam, 54 days for backfill and brickwork up to floor
level, 79 days for boulder soling and cement concrete bed,
107 days for column work and 69 days for brickwork till
lintel level.
Also the completion of the brick work up to lintel level
happened before the start of column concreting, the
sequence of which differs from the scheduled sequence in
which the brickwork follows the completion of the column
concreting.
The total project duration variance of 2.1 months was
mainly caused due to the delay in the activities during
30% completion of the project.
4.3 Results obtained from Monte Carlo simulation
This method basically depends on three time estimates for
every activity. A graph was generated which follows the
Beta PERT distribution by running the simulation which is
represented in figure 6. A cumulative frequency graph was
generated to easily understand the frequency of trials and
probabilities, as shown in figure 7. The probability of
completion can be found at any given day.
The project completion time is forecasted to be completed
in 126.05 days which is approximately 4.14 months with a
50% probability. That is because the average result of all
the 10,000 trials is 126.05, which is represented as the
mean.
The forecast is presented as a mean which is the central
tendency of the distribution, also it can be noted from the
graph that the standard deviation is 5. That is the
dispersion of values from the mean occur by 5 units.
The cumulative frequency graph represents the total trials
performed along the right y-axis and the respective
probabilities along the left y-axis.
International Research Journal of Engineering and Technology (IRJET) e-ISSN: 2395-0056
Volume: 05 Issue: 06 | June-2018 www.irjet.net p-ISSN: 2395-0072
© 2018, IRJET | Impact Factor value: 6.171 | ISO 9001:2008 Certified Journal | Page 117
Fig -6: Bell Curve representing project completion time
Fig -7: Cumulative frequency graph completion time
Since the completion time by critical path method was
found to be 122 days, the probability of completing the
project by this duration was determined and was found to
be 24.19% which is shown in figure 8.
Fig -8: Probability completion at 122 days
As the project was monitored during its execution the
delays were re-entered as the most likely value and the
pessimistic time was taken by considering both the delay
and the completion time. After running the simulations
assuming a Beta PERT distribution the completion time
was forecasted at 376.85 days which is approximately
12.4 months. This is represented in figure 9.
Fig -9: Probability completion after tracking
5. CONCLUSIONS
The implications of time estimation of a project was
analysed in this project by using critical path method and
Monte Carlo simulation. This project laid emphasis on the
impact of time estimates on project and not the
implications cost of resources would have on the project.
Tracking of a live project was done to analyse the
difference between the time estimates made and the
actual time taken. Each method have their own unique
results. Variation in certain parameters was made to
analyse the change in the results obtained.
The project completion time by the critical path method
was found to be 122 days that is 4 months and the
completion time by the Monte Carlo simulation was found
to be 126.05 days that is 4.2 months. Therefore the
percentage difference between the two estimates turns
out be 3.26%. Thus the two estimates were almost the
same. This is because the most likely time for the Monte
Carlo simulation was taken same as the one time estimate
from the critical path method, also the variation between
the optimistic and pessimistic times was not high.
Therefore the variation isn’t much.
The project progress was tracked till 30% completion and
the duration was compared with the estimated durations
by both the methods. The total project duration turned out
to be 186 days which varies by 41.55% from the critical
path estimate and 38.42% from the Monte Carlo
simulation. This basically depicts that the project was not
executed according to the planned dates. As the project
was monitored the delay was found to be caused mainly
by the irregularity of labourers and also the supply of
materials to the site was delayed by nearly 2 months as
the suppliers didn’t have the required stock.
Based on the actual progress of the project, changes in the
most likely time and pessimistic time were made by
considering the sum of delays and the time for completion
International Research Journal of Engineering and Technology (IRJET) e-ISSN: 2395-0056
Volume: 05 Issue: 06 | June-2018 www.irjet.net p-ISSN: 2395-0072
© 2018, IRJET | Impact Factor value: 6.171 | ISO 9001:2008 Certified Journal | Page 118
as most likely time and an approximate duration was
estimated for pessimistic time by considering longer
delays and same durations for completion. These times
were entered into the software and simulations were run
again. The project duration now was found to be 376.85
days and has a zero probability of completion within 187
days. This variation was because the difference between
the optimistic and pessimistic value is large. However this
estimate should be considered carefully as the project is
small and will be completed within a year, nevertheless
shortage of funds could prolong the completion time of the
project.
The Monte Carlo simulations are only as good as the time
estimates. Therefore the optimistic, pessimistic and most
likely values must be estimated with a good judgment,
which requires a good amount of experience in project
management. The technique complexity in applying the
critical path method was simple as it had just one time
estimate, whereas the Monte Carlo simulation is relatively
difficult as three time estimates had to be made.
REFERENCES
[1] Goran Avlijaš, “Examining the Value of Monte Carlo
Simulation for Project Time Management”,
Management: Journal of Sustainable Business and
Management Solutions in Emerging Economies, 2018.
[2] G Liquet, J Lozano, M Cascales, “Decision-Making for
Risk Management in Sustainable Renewable Energy
Facilities: A Case Study in the Dominican Republic”,
Sustainability 2016, pp. 1-21.
[3] J Wang, Y. Wu and D Haung, “Major Earthquakes
around Taipei and a Seismic Hazard Assessment with
Monte Carlo Simulation”, Natural Hazards Review,
Volume 16, Issue 4, November 2015, pp. 1-7.
[4] K. Kirytopoulos, V. Leopolus and V. Diamantas, “Pert
versus Monte Carlo simulation in low risk projects”,
CME 2007 Conference - Construction Management
and Economics: 'Past, Present and Future'. 1419-1427.
[5] K K Chitkara, “Construction Project Management”,
third edition, Mc Graw Hill Education (India) Private
Limited, 2014.
[6] Nurazin Jupri and Muhammad Rozi Malim. “Risk
Analysis of Construction Project Scheduling using
PERT and Monte Carlo Simulation: A Case Study on
NIOSH Campus”, International Journal of Accounting
and Business Management, ISSN: 2289-4519, Volume
1, April 2013, pp. 83-91.
[7] Pratik Ganame and Pravin Chaudhari, “Construction
Building Schedule Risk Analysis Using Schedule Risk
Analysis”, International Research Journal of
Engineering and Technology, Volume 2, Issue 4, July
2015, pp. 1402-1406.
[8] R Choudhry, M Aslam, J Hinze and F Arain, “Cost and
Schedule Risk Analysis of Bridge Construction in
Pakistan: Establishing Risk Guidelines”, Journal of
Construction Engineering and Management, Volume
140, Issue 7, July 2014, pp. 1-9.
[9] T Ersahin, B Macabe and M Doyle, “Monte Carlo
Simulation Analysis at Lester B Pearson International
Airport Development Project”, Construction Research
Congress, 2003, pp. 1-8.
[10] Z Kong, J Zhang, C Li, X Zheng and Q Guan, “Risk
Assessment of Plan Schedule by Monte Carlo
Simulation”, International Conference on Information
Technology and Management Innovation, 2015, pp.
509-513.

More Related Content

What's hot

Operation research-Network analysis (Critical Path Method)
Operation research-Network analysis (Critical Path Method)Operation research-Network analysis (Critical Path Method)
Operation research-Network analysis (Critical Path Method)
Kamel Attar
 
Pert & cpm
Pert & cpmPert & cpm
Pert & cpm
Moudud Hasan
 
Project management cpm-pert
Project management   cpm-pertProject management   cpm-pert
Project management cpm-pert
Dr. Varaprasada Rao Manda
 
Probabilistic Activity Time
Probabilistic Activity TimeProbabilistic Activity Time
Probabilistic Activity Time
Carrine Aulia
 
Network Analysis, PERT, CPM
Network Analysis, PERT, CPMNetwork Analysis, PERT, CPM
Network Analysis, PERT, CPM
keerthi pinipe
 
Pert Cpm Nis
Pert   Cpm NisPert   Cpm Nis
Pert Cpm Nis
Naveed Salman
 
Project management cpm-pert
Project management   cpm-pertProject management   cpm-pert
Project management cpm-pert
Abu Bashar
 
Resource Leveling Considering Float Consumption Impact
Resource Leveling Considering Float Consumption ImpactResource Leveling Considering Float Consumption Impact
Resource Leveling Considering Float Consumption Impact
coreconferences
 
Critical Path Method(CPM)
Critical Path Method(CPM)Critical Path Method(CPM)
Applications of pert
Applications of pertApplications of pert
Applications of pert
nitigga92
 
The Techniques Used In Project Managament
The Techniques Used In Project ManagamentThe Techniques Used In Project Managament
The Techniques Used In Project Managamentitsvineeth209
 
Time Cost Trade off Optimization Using Harmony Search and Monte-Carlo Method
Time Cost Trade off Optimization Using Harmony Search and Monte-Carlo Method Time Cost Trade off Optimization Using Harmony Search and Monte-Carlo Method
Time Cost Trade off Optimization Using Harmony Search and Monte-Carlo Method
Mohammad Lemar ZALMAİ
 
Chapter22 networktechniquesforprojectmanagement
Chapter22 networktechniquesforprojectmanagementChapter22 networktechniquesforprojectmanagement
Chapter22 networktechniquesforprojectmanagement
AKSHAYA0000
 
Industrial engineering unit 2 new
Industrial engineering unit 2 newIndustrial engineering unit 2 new
Industrial engineering unit 2 new
mohsinmmm
 
Pert and its applications
Pert and its applicationsPert and its applications
Pert and its applications
Amrit Mty
 
Pert cpm
Pert cpmPert cpm
Pert cpm
haithamallibhai
 
Cpm and pert - project management
Cpm and pert - project managementCpm and pert - project management
Cpm and pert - project management
Exam Coach
 

What's hot (20)

Operation research-Network analysis (Critical Path Method)
Operation research-Network analysis (Critical Path Method)Operation research-Network analysis (Critical Path Method)
Operation research-Network analysis (Critical Path Method)
 
Pert & cpm
Pert & cpmPert & cpm
Pert & cpm
 
Project management cpm-pert
Project management   cpm-pertProject management   cpm-pert
Project management cpm-pert
 
Probabilistic Activity Time
Probabilistic Activity TimeProbabilistic Activity Time
Probabilistic Activity Time
 
cpmpertmy (1)
cpmpertmy (1)cpmpertmy (1)
cpmpertmy (1)
 
Network Analysis, PERT, CPM
Network Analysis, PERT, CPMNetwork Analysis, PERT, CPM
Network Analysis, PERT, CPM
 
Pert Cpm Nis
Pert   Cpm NisPert   Cpm Nis
Pert Cpm Nis
 
Project management cpm-pert
Project management   cpm-pertProject management   cpm-pert
Project management cpm-pert
 
Resource Leveling Considering Float Consumption Impact
Resource Leveling Considering Float Consumption ImpactResource Leveling Considering Float Consumption Impact
Resource Leveling Considering Float Consumption Impact
 
Critical Path Method(CPM)
Critical Path Method(CPM)Critical Path Method(CPM)
Critical Path Method(CPM)
 
Applications of pert
Applications of pertApplications of pert
Applications of pert
 
The Techniques Used In Project Managament
The Techniques Used In Project ManagamentThe Techniques Used In Project Managament
The Techniques Used In Project Managament
 
Time Cost Trade off Optimization Using Harmony Search and Monte-Carlo Method
Time Cost Trade off Optimization Using Harmony Search and Monte-Carlo Method Time Cost Trade off Optimization Using Harmony Search and Monte-Carlo Method
Time Cost Trade off Optimization Using Harmony Search and Monte-Carlo Method
 
Pert cpm
Pert cpmPert cpm
Pert cpm
 
Chapter22 networktechniquesforprojectmanagement
Chapter22 networktechniquesforprojectmanagementChapter22 networktechniquesforprojectmanagement
Chapter22 networktechniquesforprojectmanagement
 
Industrial engineering unit 2 new
Industrial engineering unit 2 newIndustrial engineering unit 2 new
Industrial engineering unit 2 new
 
Pert and its applications
Pert and its applicationsPert and its applications
Pert and its applications
 
Pert 182
Pert 182Pert 182
Pert 182
 
Pert cpm
Pert cpmPert cpm
Pert cpm
 
Cpm and pert - project management
Cpm and pert - project managementCpm and pert - project management
Cpm and pert - project management
 

Similar to IRJET- Comparative Analysis between Critical Path Method and Monte Carlo Simulation

Complex Project Crashing Algorithm
Complex Project Crashing AlgorithmComplex Project Crashing Algorithm
Complex Project Crashing Algorithm
IOSR Journals
 
project management-cpm and pert methods for managers
project management-cpm and pert methods for managersproject management-cpm and pert methods for managers
project management-cpm and pert methods for managers
Naganna Chetty
 
Overview1) Overview – The continued discussion of .docx
Overview1)             Overview – The continued discussion of .docxOverview1)             Overview – The continued discussion of .docx
Overview1) Overview – The continued discussion of .docx
alfred4lewis58146
 
Overview1) Overview – The continued discussion of project implem.docx
Overview1) Overview – The continued discussion of project implem.docxOverview1) Overview – The continued discussion of project implem.docx
Overview1) Overview – The continued discussion of project implem.docx
alfred4lewis58146
 
Programme Evaluation and Review Technique
Programme Evaluation and Review TechniqueProgramme Evaluation and Review Technique
Programme Evaluation and Review Technique
DrAsifMohammad
 
IRJET- New Simulation Methodology for Dynamic Simulation Modeling of Construc...
IRJET- New Simulation Methodology for Dynamic Simulation Modeling of Construc...IRJET- New Simulation Methodology for Dynamic Simulation Modeling of Construc...
IRJET- New Simulation Methodology for Dynamic Simulation Modeling of Construc...
IRJET Journal
 
Pert cpm
Pert cpm Pert cpm
Pert cpm
Drprem Jerusha
 
CPM AND PERT
CPM AND PERTCPM AND PERT
CPM AND PERT
SimranGrewal33
 
Chapter 3.pptx
Chapter 3.pptxChapter 3.pptx
Chapter 3.pptx
BetshaTizazu2
 
Yagmur Bostanci47 Hackensack Street, East Rutherford, NJ929-22.docx
Yagmur Bostanci47 Hackensack Street, East Rutherford, NJ929-22.docxYagmur Bostanci47 Hackensack Street, East Rutherford, NJ929-22.docx
Yagmur Bostanci47 Hackensack Street, East Rutherford, NJ929-22.docx
jeffevans62972
 
Project Management.pptx
Project Management.pptxProject Management.pptx
Project Management.pptx
NaimishKishor
 
Management science
Management scienceManagement science
Management science
kamrul islam
 
Time Series Weather Forecasting Techniques: Literature Survey
Time Series Weather Forecasting Techniques: Literature SurveyTime Series Weather Forecasting Techniques: Literature Survey
Time Series Weather Forecasting Techniques: Literature Survey
IRJET Journal
 
A760535773_16727_28_2018_u6.ppt
A760535773_16727_28_2018_u6.pptA760535773_16727_28_2018_u6.ppt
A760535773_16727_28_2018_u6.ppt
RajnikantPatel45
 
Network analysis cpm module3
Network analysis cpm module3Network analysis cpm module3
Network analysis cpm module3
ahsanrabbani
 
A Study on Project Planning Using the Deterministic and Probabilistic Models ...
A Study on Project Planning Using the Deterministic and Probabilistic Models ...A Study on Project Planning Using the Deterministic and Probabilistic Models ...
A Study on Project Planning Using the Deterministic and Probabilistic Models ...
IJERA Editor
 
NET WORK ANALYSIS.pptx
NET WORK ANALYSIS.pptxNET WORK ANALYSIS.pptx
NET WORK ANALYSIS.pptx
paulkinyua6
 
Advanced project management mod 4
Advanced project management mod 4Advanced project management mod 4
Advanced project management mod 4
POOJA UDAYAN
 
Ijciet 10 01_075
Ijciet 10 01_075Ijciet 10 01_075
Ijciet 10 01_075
IAEME Publication
 

Similar to IRJET- Comparative Analysis between Critical Path Method and Monte Carlo Simulation (20)

Complex Project Crashing Algorithm
Complex Project Crashing AlgorithmComplex Project Crashing Algorithm
Complex Project Crashing Algorithm
 
project management-cpm and pert methods for managers
project management-cpm and pert methods for managersproject management-cpm and pert methods for managers
project management-cpm and pert methods for managers
 
Overview1) Overview – The continued discussion of .docx
Overview1)             Overview – The continued discussion of .docxOverview1)             Overview – The continued discussion of .docx
Overview1) Overview – The continued discussion of .docx
 
Overview1) Overview – The continued discussion of project implem.docx
Overview1) Overview – The continued discussion of project implem.docxOverview1) Overview – The continued discussion of project implem.docx
Overview1) Overview – The continued discussion of project implem.docx
 
Programme Evaluation and Review Technique
Programme Evaluation and Review TechniqueProgramme Evaluation and Review Technique
Programme Evaluation and Review Technique
 
IRJET- New Simulation Methodology for Dynamic Simulation Modeling of Construc...
IRJET- New Simulation Methodology for Dynamic Simulation Modeling of Construc...IRJET- New Simulation Methodology for Dynamic Simulation Modeling of Construc...
IRJET- New Simulation Methodology for Dynamic Simulation Modeling of Construc...
 
Pert cpm
Pert cpm Pert cpm
Pert cpm
 
Pert & Cpm
Pert & CpmPert & Cpm
Pert & Cpm
 
CPM AND PERT
CPM AND PERTCPM AND PERT
CPM AND PERT
 
Chapter 3.pptx
Chapter 3.pptxChapter 3.pptx
Chapter 3.pptx
 
Yagmur Bostanci47 Hackensack Street, East Rutherford, NJ929-22.docx
Yagmur Bostanci47 Hackensack Street, East Rutherford, NJ929-22.docxYagmur Bostanci47 Hackensack Street, East Rutherford, NJ929-22.docx
Yagmur Bostanci47 Hackensack Street, East Rutherford, NJ929-22.docx
 
Project Management.pptx
Project Management.pptxProject Management.pptx
Project Management.pptx
 
Management science
Management scienceManagement science
Management science
 
Time Series Weather Forecasting Techniques: Literature Survey
Time Series Weather Forecasting Techniques: Literature SurveyTime Series Weather Forecasting Techniques: Literature Survey
Time Series Weather Forecasting Techniques: Literature Survey
 
A760535773_16727_28_2018_u6.ppt
A760535773_16727_28_2018_u6.pptA760535773_16727_28_2018_u6.ppt
A760535773_16727_28_2018_u6.ppt
 
Network analysis cpm module3
Network analysis cpm module3Network analysis cpm module3
Network analysis cpm module3
 
A Study on Project Planning Using the Deterministic and Probabilistic Models ...
A Study on Project Planning Using the Deterministic and Probabilistic Models ...A Study on Project Planning Using the Deterministic and Probabilistic Models ...
A Study on Project Planning Using the Deterministic and Probabilistic Models ...
 
NET WORK ANALYSIS.pptx
NET WORK ANALYSIS.pptxNET WORK ANALYSIS.pptx
NET WORK ANALYSIS.pptx
 
Advanced project management mod 4
Advanced project management mod 4Advanced project management mod 4
Advanced project management mod 4
 
Ijciet 10 01_075
Ijciet 10 01_075Ijciet 10 01_075
Ijciet 10 01_075
 

More from IRJET Journal

TUNNELING IN HIMALAYAS WITH NATM METHOD: A SPECIAL REFERENCES TO SUNGAL TUNNE...
TUNNELING IN HIMALAYAS WITH NATM METHOD: A SPECIAL REFERENCES TO SUNGAL TUNNE...TUNNELING IN HIMALAYAS WITH NATM METHOD: A SPECIAL REFERENCES TO SUNGAL TUNNE...
TUNNELING IN HIMALAYAS WITH NATM METHOD: A SPECIAL REFERENCES TO SUNGAL TUNNE...
IRJET Journal
 
STUDY THE EFFECT OF RESPONSE REDUCTION FACTOR ON RC FRAMED STRUCTURE
STUDY THE EFFECT OF RESPONSE REDUCTION FACTOR ON RC FRAMED STRUCTURESTUDY THE EFFECT OF RESPONSE REDUCTION FACTOR ON RC FRAMED STRUCTURE
STUDY THE EFFECT OF RESPONSE REDUCTION FACTOR ON RC FRAMED STRUCTURE
IRJET Journal
 
A COMPARATIVE ANALYSIS OF RCC ELEMENT OF SLAB WITH STARK STEEL (HYSD STEEL) A...
A COMPARATIVE ANALYSIS OF RCC ELEMENT OF SLAB WITH STARK STEEL (HYSD STEEL) A...A COMPARATIVE ANALYSIS OF RCC ELEMENT OF SLAB WITH STARK STEEL (HYSD STEEL) A...
A COMPARATIVE ANALYSIS OF RCC ELEMENT OF SLAB WITH STARK STEEL (HYSD STEEL) A...
IRJET Journal
 
Effect of Camber and Angles of Attack on Airfoil Characteristics
Effect of Camber and Angles of Attack on Airfoil CharacteristicsEffect of Camber and Angles of Attack on Airfoil Characteristics
Effect of Camber and Angles of Attack on Airfoil Characteristics
IRJET Journal
 
A Review on the Progress and Challenges of Aluminum-Based Metal Matrix Compos...
A Review on the Progress and Challenges of Aluminum-Based Metal Matrix Compos...A Review on the Progress and Challenges of Aluminum-Based Metal Matrix Compos...
A Review on the Progress and Challenges of Aluminum-Based Metal Matrix Compos...
IRJET Journal
 
Dynamic Urban Transit Optimization: A Graph Neural Network Approach for Real-...
Dynamic Urban Transit Optimization: A Graph Neural Network Approach for Real-...Dynamic Urban Transit Optimization: A Graph Neural Network Approach for Real-...
Dynamic Urban Transit Optimization: A Graph Neural Network Approach for Real-...
IRJET Journal
 
Structural Analysis and Design of Multi-Storey Symmetric and Asymmetric Shape...
Structural Analysis and Design of Multi-Storey Symmetric and Asymmetric Shape...Structural Analysis and Design of Multi-Storey Symmetric and Asymmetric Shape...
Structural Analysis and Design of Multi-Storey Symmetric and Asymmetric Shape...
IRJET Journal
 
A Review of “Seismic Response of RC Structures Having Plan and Vertical Irreg...
A Review of “Seismic Response of RC Structures Having Plan and Vertical Irreg...A Review of “Seismic Response of RC Structures Having Plan and Vertical Irreg...
A Review of “Seismic Response of RC Structures Having Plan and Vertical Irreg...
IRJET Journal
 
A REVIEW ON MACHINE LEARNING IN ADAS
A REVIEW ON MACHINE LEARNING IN ADASA REVIEW ON MACHINE LEARNING IN ADAS
A REVIEW ON MACHINE LEARNING IN ADAS
IRJET Journal
 
Long Term Trend Analysis of Precipitation and Temperature for Asosa district,...
Long Term Trend Analysis of Precipitation and Temperature for Asosa district,...Long Term Trend Analysis of Precipitation and Temperature for Asosa district,...
Long Term Trend Analysis of Precipitation and Temperature for Asosa district,...
IRJET Journal
 
P.E.B. Framed Structure Design and Analysis Using STAAD Pro
P.E.B. Framed Structure Design and Analysis Using STAAD ProP.E.B. Framed Structure Design and Analysis Using STAAD Pro
P.E.B. Framed Structure Design and Analysis Using STAAD Pro
IRJET Journal
 
A Review on Innovative Fiber Integration for Enhanced Reinforcement of Concre...
A Review on Innovative Fiber Integration for Enhanced Reinforcement of Concre...A Review on Innovative Fiber Integration for Enhanced Reinforcement of Concre...
A Review on Innovative Fiber Integration for Enhanced Reinforcement of Concre...
IRJET Journal
 
Survey Paper on Cloud-Based Secured Healthcare System
Survey Paper on Cloud-Based Secured Healthcare SystemSurvey Paper on Cloud-Based Secured Healthcare System
Survey Paper on Cloud-Based Secured Healthcare System
IRJET Journal
 
Review on studies and research on widening of existing concrete bridges
Review on studies and research on widening of existing concrete bridgesReview on studies and research on widening of existing concrete bridges
Review on studies and research on widening of existing concrete bridges
IRJET Journal
 
React based fullstack edtech web application
React based fullstack edtech web applicationReact based fullstack edtech web application
React based fullstack edtech web application
IRJET Journal
 
A Comprehensive Review of Integrating IoT and Blockchain Technologies in the ...
A Comprehensive Review of Integrating IoT and Blockchain Technologies in the ...A Comprehensive Review of Integrating IoT and Blockchain Technologies in the ...
A Comprehensive Review of Integrating IoT and Blockchain Technologies in the ...
IRJET Journal
 
A REVIEW ON THE PERFORMANCE OF COCONUT FIBRE REINFORCED CONCRETE.
A REVIEW ON THE PERFORMANCE OF COCONUT FIBRE REINFORCED CONCRETE.A REVIEW ON THE PERFORMANCE OF COCONUT FIBRE REINFORCED CONCRETE.
A REVIEW ON THE PERFORMANCE OF COCONUT FIBRE REINFORCED CONCRETE.
IRJET Journal
 
Optimizing Business Management Process Workflows: The Dynamic Influence of Mi...
Optimizing Business Management Process Workflows: The Dynamic Influence of Mi...Optimizing Business Management Process Workflows: The Dynamic Influence of Mi...
Optimizing Business Management Process Workflows: The Dynamic Influence of Mi...
IRJET Journal
 
Multistoried and Multi Bay Steel Building Frame by using Seismic Design
Multistoried and Multi Bay Steel Building Frame by using Seismic DesignMultistoried and Multi Bay Steel Building Frame by using Seismic Design
Multistoried and Multi Bay Steel Building Frame by using Seismic Design
IRJET Journal
 
Cost Optimization of Construction Using Plastic Waste as a Sustainable Constr...
Cost Optimization of Construction Using Plastic Waste as a Sustainable Constr...Cost Optimization of Construction Using Plastic Waste as a Sustainable Constr...
Cost Optimization of Construction Using Plastic Waste as a Sustainable Constr...
IRJET Journal
 

More from IRJET Journal (20)

TUNNELING IN HIMALAYAS WITH NATM METHOD: A SPECIAL REFERENCES TO SUNGAL TUNNE...
TUNNELING IN HIMALAYAS WITH NATM METHOD: A SPECIAL REFERENCES TO SUNGAL TUNNE...TUNNELING IN HIMALAYAS WITH NATM METHOD: A SPECIAL REFERENCES TO SUNGAL TUNNE...
TUNNELING IN HIMALAYAS WITH NATM METHOD: A SPECIAL REFERENCES TO SUNGAL TUNNE...
 
STUDY THE EFFECT OF RESPONSE REDUCTION FACTOR ON RC FRAMED STRUCTURE
STUDY THE EFFECT OF RESPONSE REDUCTION FACTOR ON RC FRAMED STRUCTURESTUDY THE EFFECT OF RESPONSE REDUCTION FACTOR ON RC FRAMED STRUCTURE
STUDY THE EFFECT OF RESPONSE REDUCTION FACTOR ON RC FRAMED STRUCTURE
 
A COMPARATIVE ANALYSIS OF RCC ELEMENT OF SLAB WITH STARK STEEL (HYSD STEEL) A...
A COMPARATIVE ANALYSIS OF RCC ELEMENT OF SLAB WITH STARK STEEL (HYSD STEEL) A...A COMPARATIVE ANALYSIS OF RCC ELEMENT OF SLAB WITH STARK STEEL (HYSD STEEL) A...
A COMPARATIVE ANALYSIS OF RCC ELEMENT OF SLAB WITH STARK STEEL (HYSD STEEL) A...
 
Effect of Camber and Angles of Attack on Airfoil Characteristics
Effect of Camber and Angles of Attack on Airfoil CharacteristicsEffect of Camber and Angles of Attack on Airfoil Characteristics
Effect of Camber and Angles of Attack on Airfoil Characteristics
 
A Review on the Progress and Challenges of Aluminum-Based Metal Matrix Compos...
A Review on the Progress and Challenges of Aluminum-Based Metal Matrix Compos...A Review on the Progress and Challenges of Aluminum-Based Metal Matrix Compos...
A Review on the Progress and Challenges of Aluminum-Based Metal Matrix Compos...
 
Dynamic Urban Transit Optimization: A Graph Neural Network Approach for Real-...
Dynamic Urban Transit Optimization: A Graph Neural Network Approach for Real-...Dynamic Urban Transit Optimization: A Graph Neural Network Approach for Real-...
Dynamic Urban Transit Optimization: A Graph Neural Network Approach for Real-...
 
Structural Analysis and Design of Multi-Storey Symmetric and Asymmetric Shape...
Structural Analysis and Design of Multi-Storey Symmetric and Asymmetric Shape...Structural Analysis and Design of Multi-Storey Symmetric and Asymmetric Shape...
Structural Analysis and Design of Multi-Storey Symmetric and Asymmetric Shape...
 
A Review of “Seismic Response of RC Structures Having Plan and Vertical Irreg...
A Review of “Seismic Response of RC Structures Having Plan and Vertical Irreg...A Review of “Seismic Response of RC Structures Having Plan and Vertical Irreg...
A Review of “Seismic Response of RC Structures Having Plan and Vertical Irreg...
 
A REVIEW ON MACHINE LEARNING IN ADAS
A REVIEW ON MACHINE LEARNING IN ADASA REVIEW ON MACHINE LEARNING IN ADAS
A REVIEW ON MACHINE LEARNING IN ADAS
 
Long Term Trend Analysis of Precipitation and Temperature for Asosa district,...
Long Term Trend Analysis of Precipitation and Temperature for Asosa district,...Long Term Trend Analysis of Precipitation and Temperature for Asosa district,...
Long Term Trend Analysis of Precipitation and Temperature for Asosa district,...
 
P.E.B. Framed Structure Design and Analysis Using STAAD Pro
P.E.B. Framed Structure Design and Analysis Using STAAD ProP.E.B. Framed Structure Design and Analysis Using STAAD Pro
P.E.B. Framed Structure Design and Analysis Using STAAD Pro
 
A Review on Innovative Fiber Integration for Enhanced Reinforcement of Concre...
A Review on Innovative Fiber Integration for Enhanced Reinforcement of Concre...A Review on Innovative Fiber Integration for Enhanced Reinforcement of Concre...
A Review on Innovative Fiber Integration for Enhanced Reinforcement of Concre...
 
Survey Paper on Cloud-Based Secured Healthcare System
Survey Paper on Cloud-Based Secured Healthcare SystemSurvey Paper on Cloud-Based Secured Healthcare System
Survey Paper on Cloud-Based Secured Healthcare System
 
Review on studies and research on widening of existing concrete bridges
Review on studies and research on widening of existing concrete bridgesReview on studies and research on widening of existing concrete bridges
Review on studies and research on widening of existing concrete bridges
 
React based fullstack edtech web application
React based fullstack edtech web applicationReact based fullstack edtech web application
React based fullstack edtech web application
 
A Comprehensive Review of Integrating IoT and Blockchain Technologies in the ...
A Comprehensive Review of Integrating IoT and Blockchain Technologies in the ...A Comprehensive Review of Integrating IoT and Blockchain Technologies in the ...
A Comprehensive Review of Integrating IoT and Blockchain Technologies in the ...
 
A REVIEW ON THE PERFORMANCE OF COCONUT FIBRE REINFORCED CONCRETE.
A REVIEW ON THE PERFORMANCE OF COCONUT FIBRE REINFORCED CONCRETE.A REVIEW ON THE PERFORMANCE OF COCONUT FIBRE REINFORCED CONCRETE.
A REVIEW ON THE PERFORMANCE OF COCONUT FIBRE REINFORCED CONCRETE.
 
Optimizing Business Management Process Workflows: The Dynamic Influence of Mi...
Optimizing Business Management Process Workflows: The Dynamic Influence of Mi...Optimizing Business Management Process Workflows: The Dynamic Influence of Mi...
Optimizing Business Management Process Workflows: The Dynamic Influence of Mi...
 
Multistoried and Multi Bay Steel Building Frame by using Seismic Design
Multistoried and Multi Bay Steel Building Frame by using Seismic DesignMultistoried and Multi Bay Steel Building Frame by using Seismic Design
Multistoried and Multi Bay Steel Building Frame by using Seismic Design
 
Cost Optimization of Construction Using Plastic Waste as a Sustainable Constr...
Cost Optimization of Construction Using Plastic Waste as a Sustainable Constr...Cost Optimization of Construction Using Plastic Waste as a Sustainable Constr...
Cost Optimization of Construction Using Plastic Waste as a Sustainable Constr...
 

Recently uploaded

MCQ Soil mechanics questions (Soil shear strength).pdf
MCQ Soil mechanics questions (Soil shear strength).pdfMCQ Soil mechanics questions (Soil shear strength).pdf
MCQ Soil mechanics questions (Soil shear strength).pdf
Osamah Alsalih
 
Top 10 Oil and Gas Projects in Saudi Arabia 2024.pdf
Top 10 Oil and Gas Projects in Saudi Arabia 2024.pdfTop 10 Oil and Gas Projects in Saudi Arabia 2024.pdf
Top 10 Oil and Gas Projects in Saudi Arabia 2024.pdf
Teleport Manpower Consultant
 
Pile Foundation by Venkatesh Taduvai (Sub Geotechnical Engineering II)-conver...
Pile Foundation by Venkatesh Taduvai (Sub Geotechnical Engineering II)-conver...Pile Foundation by Venkatesh Taduvai (Sub Geotechnical Engineering II)-conver...
Pile Foundation by Venkatesh Taduvai (Sub Geotechnical Engineering II)-conver...
AJAYKUMARPUND1
 
WATER CRISIS and its solutions-pptx 1234
WATER CRISIS and its solutions-pptx 1234WATER CRISIS and its solutions-pptx 1234
WATER CRISIS and its solutions-pptx 1234
AafreenAbuthahir2
 
Sachpazis:Terzaghi Bearing Capacity Estimation in simple terms with Calculati...
Sachpazis:Terzaghi Bearing Capacity Estimation in simple terms with Calculati...Sachpazis:Terzaghi Bearing Capacity Estimation in simple terms with Calculati...
Sachpazis:Terzaghi Bearing Capacity Estimation in simple terms with Calculati...
Dr.Costas Sachpazis
 
一比一原版(UofT毕业证)多伦多大学毕业证成绩单如何办理
一比一原版(UofT毕业证)多伦多大学毕业证成绩单如何办理一比一原版(UofT毕业证)多伦多大学毕业证成绩单如何办理
一比一原版(UofT毕业证)多伦多大学毕业证成绩单如何办理
ydteq
 
space technology lecture notes on satellite
space technology lecture notes on satellitespace technology lecture notes on satellite
space technology lecture notes on satellite
ongomchris
 
The role of big data in decision making.
The role of big data in decision making.The role of big data in decision making.
The role of big data in decision making.
ankuprajapati0525
 
Fundamentals of Electric Drives and its applications.pptx
Fundamentals of Electric Drives and its applications.pptxFundamentals of Electric Drives and its applications.pptx
Fundamentals of Electric Drives and its applications.pptx
manasideore6
 
Gen AI Study Jams _ For the GDSC Leads in India.pdf
Gen AI Study Jams _ For the GDSC Leads in India.pdfGen AI Study Jams _ For the GDSC Leads in India.pdf
Gen AI Study Jams _ For the GDSC Leads in India.pdf
gdsczhcet
 
Student information management system project report ii.pdf
Student information management system project report ii.pdfStudent information management system project report ii.pdf
Student information management system project report ii.pdf
Kamal Acharya
 
Immunizing Image Classifiers Against Localized Adversary Attacks
Immunizing Image Classifiers Against Localized Adversary AttacksImmunizing Image Classifiers Against Localized Adversary Attacks
Immunizing Image Classifiers Against Localized Adversary Attacks
gerogepatton
 
ASME IX(9) 2007 Full Version .pdf
ASME IX(9)  2007 Full Version       .pdfASME IX(9)  2007 Full Version       .pdf
ASME IX(9) 2007 Full Version .pdf
AhmedHussein950959
 
weather web application report.pdf
weather web application report.pdfweather web application report.pdf
weather web application report.pdf
Pratik Pawar
 
ethical hacking in wireless-hacking1.ppt
ethical hacking in wireless-hacking1.pptethical hacking in wireless-hacking1.ppt
ethical hacking in wireless-hacking1.ppt
Jayaprasanna4
 
Governing Equations for Fundamental Aerodynamics_Anderson2010.pdf
Governing Equations for Fundamental Aerodynamics_Anderson2010.pdfGoverning Equations for Fundamental Aerodynamics_Anderson2010.pdf
Governing Equations for Fundamental Aerodynamics_Anderson2010.pdf
WENKENLI1
 
ML for identifying fraud using open blockchain data.pptx
ML for identifying fraud using open blockchain data.pptxML for identifying fraud using open blockchain data.pptx
ML for identifying fraud using open blockchain data.pptx
Vijay Dialani, PhD
 
Hybrid optimization of pumped hydro system and solar- Engr. Abdul-Azeez.pdf
Hybrid optimization of pumped hydro system and solar- Engr. Abdul-Azeez.pdfHybrid optimization of pumped hydro system and solar- Engr. Abdul-Azeez.pdf
Hybrid optimization of pumped hydro system and solar- Engr. Abdul-Azeez.pdf
fxintegritypublishin
 
Water Industry Process Automation and Control Monthly - May 2024.pdf
Water Industry Process Automation and Control Monthly - May 2024.pdfWater Industry Process Automation and Control Monthly - May 2024.pdf
Water Industry Process Automation and Control Monthly - May 2024.pdf
Water Industry Process Automation & Control
 
ethical hacking-mobile hacking methods.ppt
ethical hacking-mobile hacking methods.pptethical hacking-mobile hacking methods.ppt
ethical hacking-mobile hacking methods.ppt
Jayaprasanna4
 

Recently uploaded (20)

MCQ Soil mechanics questions (Soil shear strength).pdf
MCQ Soil mechanics questions (Soil shear strength).pdfMCQ Soil mechanics questions (Soil shear strength).pdf
MCQ Soil mechanics questions (Soil shear strength).pdf
 
Top 10 Oil and Gas Projects in Saudi Arabia 2024.pdf
Top 10 Oil and Gas Projects in Saudi Arabia 2024.pdfTop 10 Oil and Gas Projects in Saudi Arabia 2024.pdf
Top 10 Oil and Gas Projects in Saudi Arabia 2024.pdf
 
Pile Foundation by Venkatesh Taduvai (Sub Geotechnical Engineering II)-conver...
Pile Foundation by Venkatesh Taduvai (Sub Geotechnical Engineering II)-conver...Pile Foundation by Venkatesh Taduvai (Sub Geotechnical Engineering II)-conver...
Pile Foundation by Venkatesh Taduvai (Sub Geotechnical Engineering II)-conver...
 
WATER CRISIS and its solutions-pptx 1234
WATER CRISIS and its solutions-pptx 1234WATER CRISIS and its solutions-pptx 1234
WATER CRISIS and its solutions-pptx 1234
 
Sachpazis:Terzaghi Bearing Capacity Estimation in simple terms with Calculati...
Sachpazis:Terzaghi Bearing Capacity Estimation in simple terms with Calculati...Sachpazis:Terzaghi Bearing Capacity Estimation in simple terms with Calculati...
Sachpazis:Terzaghi Bearing Capacity Estimation in simple terms with Calculati...
 
一比一原版(UofT毕业证)多伦多大学毕业证成绩单如何办理
一比一原版(UofT毕业证)多伦多大学毕业证成绩单如何办理一比一原版(UofT毕业证)多伦多大学毕业证成绩单如何办理
一比一原版(UofT毕业证)多伦多大学毕业证成绩单如何办理
 
space technology lecture notes on satellite
space technology lecture notes on satellitespace technology lecture notes on satellite
space technology lecture notes on satellite
 
The role of big data in decision making.
The role of big data in decision making.The role of big data in decision making.
The role of big data in decision making.
 
Fundamentals of Electric Drives and its applications.pptx
Fundamentals of Electric Drives and its applications.pptxFundamentals of Electric Drives and its applications.pptx
Fundamentals of Electric Drives and its applications.pptx
 
Gen AI Study Jams _ For the GDSC Leads in India.pdf
Gen AI Study Jams _ For the GDSC Leads in India.pdfGen AI Study Jams _ For the GDSC Leads in India.pdf
Gen AI Study Jams _ For the GDSC Leads in India.pdf
 
Student information management system project report ii.pdf
Student information management system project report ii.pdfStudent information management system project report ii.pdf
Student information management system project report ii.pdf
 
Immunizing Image Classifiers Against Localized Adversary Attacks
Immunizing Image Classifiers Against Localized Adversary AttacksImmunizing Image Classifiers Against Localized Adversary Attacks
Immunizing Image Classifiers Against Localized Adversary Attacks
 
ASME IX(9) 2007 Full Version .pdf
ASME IX(9)  2007 Full Version       .pdfASME IX(9)  2007 Full Version       .pdf
ASME IX(9) 2007 Full Version .pdf
 
weather web application report.pdf
weather web application report.pdfweather web application report.pdf
weather web application report.pdf
 
ethical hacking in wireless-hacking1.ppt
ethical hacking in wireless-hacking1.pptethical hacking in wireless-hacking1.ppt
ethical hacking in wireless-hacking1.ppt
 
Governing Equations for Fundamental Aerodynamics_Anderson2010.pdf
Governing Equations for Fundamental Aerodynamics_Anderson2010.pdfGoverning Equations for Fundamental Aerodynamics_Anderson2010.pdf
Governing Equations for Fundamental Aerodynamics_Anderson2010.pdf
 
ML for identifying fraud using open blockchain data.pptx
ML for identifying fraud using open blockchain data.pptxML for identifying fraud using open blockchain data.pptx
ML for identifying fraud using open blockchain data.pptx
 
Hybrid optimization of pumped hydro system and solar- Engr. Abdul-Azeez.pdf
Hybrid optimization of pumped hydro system and solar- Engr. Abdul-Azeez.pdfHybrid optimization of pumped hydro system and solar- Engr. Abdul-Azeez.pdf
Hybrid optimization of pumped hydro system and solar- Engr. Abdul-Azeez.pdf
 
Water Industry Process Automation and Control Monthly - May 2024.pdf
Water Industry Process Automation and Control Monthly - May 2024.pdfWater Industry Process Automation and Control Monthly - May 2024.pdf
Water Industry Process Automation and Control Monthly - May 2024.pdf
 
ethical hacking-mobile hacking methods.ppt
ethical hacking-mobile hacking methods.pptethical hacking-mobile hacking methods.ppt
ethical hacking-mobile hacking methods.ppt
 

IRJET- Comparative Analysis between Critical Path Method and Monte Carlo Simulation

  • 1. International Research Journal of Engineering and Technology (IRJET) e-ISSN: 2395-0056 Volume: 05 Issue: 06 | June-2018 www.irjet.net p-ISSN: 2395-0072 © 2018, IRJET | Impact Factor value: 6.171 | ISO 9001:2008 Certified Journal | Page 112 COMPARATIVE ANALYSIS BETWEEN CRITICAL PATH METHOD AND MONTE CARLO SIMULATION Tungesh Tanuj Karthik Naidu1, Prof. Ravi U. Angadi2 1M.TECH student, Civil Engineering Dept., Jain College of Engineering, Karnataka, India 2Asst. Professor, Civil Engineering Dept., Jain College of Engineering, Karnataka, India ---------------------------------------------------------------------***--------------------------------------------------------------------- Abstract - Time is a major factor in almost all areas of engineering. Every project is estimated for the completion time required based on the tasks and objectives involved for its execution. Project management enterprises mainly work on completing a project by the set schedule. A constant evolution has been made in determining the completion time of every project to best suit the real time execution. The techniques involved to determine the time of completion are critical path method, program evaluation and review technique, precedence network analysis and Monte Carlo simulations. These methods are employed based on the risk and uncertainty involved in the projects. The objective of this project was to analyse the difference between the critical path method and the Monte Carlo simulation. For this purpose a live project was taken up and the activities involved in the project were listed. The project completion time using the critical path method was found out using Microsoft Project 2013, while the project completion time using the Monte Carlo simulations was found out using Oracle Crystal Ball Software. The results obtained from the both the softwares were compared to determine the percentage difference. Based on the variance between the actual and scheduled durations, the durations for the three time estimates were modified and the simulations were performed again to determine the probable completion time of the project. The results were obtained and conclusions were made on the applicability of Monte Carlo simulation in the Construction Industry. Key Words: Construction project, Scheduling, Critical Path Method, PERT, Monte Carlo simulation, Project Tracking. 1. INTRODUCTION Construction has made numerous marvels on the planet and has imbibed numerous technologies for the advantage of the humankind. Construction is a noteworthy segment of the new ventures. The construction industry is fundamental for the development of the economy of any nation. The construction of capital intensive projects is always undertaken by ‘projectising’ them, i.e. to create a work break down structure of the project into activities or events for smooth execution of the project. The most important factors that govern the success of any construction project are planning, scheduling, monitoring and controlling. The planning involves understanding the client’s view of the project and developing and designing a plan accordingly, which is followed by estimating the quantity of work and formation of a contract. The scheduling involves the estimation of the complete project duration and creating a database for updating of actual progress. In the monitoring phase the work is performed according to the schedule prepared, lag and lead in activity times is adjusted to keep the project on track. Controlling phase involves applying additional resources on activities that would otherwise prolong the project. This particular paper however deals with the scheduling phase of a project. The various methods used to schedule a project are critical path method, program evaluation and review technique and Monte Carlo simulation. 1.1 Critical Path Method The critical path method is a well ordered venture administration procedure to recognize activities on the basic way. It is a way to deal with venture planning that breaks the undertaking into a few work assignments, shows us a stream outline, and afterward ascertains the task term in light of evaluated lengths for each errand. It basically tells us the longest path/duration of the project. It is used for deterministic events and has just one time estimate for each activity. It is abbreviated as CPM. A set of sample activities were considered for understanding the working of this process. The durations were assumed and loaded for each activity. Further the computation was done by calculating the earliest start time, earliest finish time, latest start time and latest finish time. Basically the earliest start time (EST) is the time by which a project can start and earliest finish time (EFT) signifies that an activity can finish by that particular time and is calculated as EST + activity duration. The latest start time (LST) and latest finish times (LFT) signify that the activity has to compulsorily start or finish by that particular time; otherwise the project could be delayed. Latest start time is calculated as the difference between LFT and activity duration and the Latest finish time is calculated using the backward pass method. In the backward pass method the EST and EFT are considered same and the preceding activity duration is subtracted to find the LFT of the preceding activity. Basically the activities whose EST, LST and EFT, LFT are the same are critical activities and take the most time to complete the project. A network diagram connects all the activities and represents their interdependencies.
  • 2. International Research Journal of Engineering and Technology (IRJET) e-ISSN: 2395-0056 Volume: 05 Issue: 06 | June-2018 www.irjet.net p-ISSN: 2395-0072 © 2018, IRJET | Impact Factor value: 6.171 | ISO 9001:2008 Certified Journal | Page 113 1.2 Program Evaluation and Review Technique This technique is also abbreviated as PERT. The activities of the project and their network relationships are well defined but it allows uncertainties in activity durations. It is extremely difficult in today’s scenario to determine the exact time one activity may take as there are a lot of uncertainties involved. Therefore there are three time estimates for every activity that take into account these uncertainties which are described as follows:- a) Optimistic time: It is the minimum possible time which an activity requires for its completion under ideal conditions. In other words, it is the shortest time required for activity completion assuming that everything during its execution will go right. It does not include any sort of setback or delay. It is denoted as to. b) Pessimistic time: It is the maximum possible time that an activity requires for its completion or the longest estimated time period of an activity completion. It estimates time assuming that lack of resources would be there and so the activity may take excess time for completion than actually required. It is denoted as tp. c) Most likely time: It is the most probable time or simply a more realistic time that an activity requires for its completion. It normally considers a few delays which is common for project execution. It is denoted as tm. d) Expected time or Average time: It is the weighted average time of the optimistic, pessimistic and most likely time, or is basically converting the three time estimates to one time estimate. It is denoted as Te. The formula for its calculation is given below. Once the expected time is calculated, it can be loaded back into the network diagram from which the project completion time is determined. 1.3 Monte Carlo Simulations This technique works on the basis of probability distributions and is a large amalgamation of statistics, theoretical probability and random number generator. Although it involves complex algorithms for calculation of results, the working of it is quite straight forward. Suppose we want to know the probability that a combination of activities will occur we input into the system all the three time estimates of all the activities along with their respective variance. The Monte Carlo simulation will generate a set of random numbers between 0 and 1 and match those numbers with the probability of the occurrence of the activity time. Suppose the probability of the activity is 0.9 and the random number generated is 0.9, the system will simulate that the activity will occur. Thousands of such simulation can be run within the system to find the combination of the frequently occurring results. For instance if a 1000 trials were run and 900 trials returned the same result then that would be the final output of the simulation. In a nut shell we humans understand three time estimates but a system understands the three time estimate data in the form of probability distribution. The probability allows the system to randomly select values from the probability distribution chart and compute the output. The concept of randomness is emphasized in the simulation to imitate the real life scenario which is basically random meaning anything could happen at any time. 2. LITERATURE REVIEW The concept of this project was derived from reference through various research papers that dealt with the application of Monte Carlo Simulation in Construction Industry. The work done by various researchers in this area is briefly discussed by extracting relevant information. Although the concept is similar the work done by the respective researchers is unique in its own way. The researchers have applied the concept of Monte Carlo simulation to projects with different constraints to obtain their desired outcomes and therefore present their conclusions on the applicability of this simulation in the field of construction. K K Chitkara has in his book discussed the application of probability distributions and Monte Carlo simulations in determining project completion time. From his discussion one cannot be sure of the actual value of the project completion time in the initial stages of the project and therefore probability distributions help to quantify the uncertainties in a project. The application of Monte Carlo simulation which is meant to imitate real life situations was also detailed. The simulations are based on the probability distributions. The results from the simulation represent the uncertainty in the entire project. K. Kirytopoulos et al. have in their research made a comparison between the application of PERT and Monte Carlo simulation in low risk projects. They concluded that the simulation techniques allow for more efficient modeling of the project than the conventional methods such as critical path method and PERT. Goran Avlijaš has in his paper dealt specifically with the application of Monte Carlo simulation on Project time management. He found that the Monte Carlo simulations help in addressing the uncertainties in the project time and networks to obtain a reasonable duration. The durations estimates according to him can be more accurate when risk adjusted schedules are used. Crystal Ball software was used for applying the Monte Carlo simulation, he assumed that the random variables follow a
  • 3. International Research Journal of Engineering and Technology (IRJET) e-ISSN: 2395-0056 Volume: 05 Issue: 06 | June-2018 www.irjet.net p-ISSN: 2395-0072 © 2018, IRJET | Impact Factor value: 6.171 | ISO 9001:2008 Certified Journal | Page 114 Beta PERT distribution. A 1,000 trials were run and the project completion time was found to be 45.89 days, and the critical path duration was found to be 43 days. The variation according to him was because of the path mergers. He also determined the probability of completing the project in 50 days and found it to be 77.69%. He finally concluded that Monte Carlo simulation was a useful tool in estimating project activities. Pratik Ganame and Pravin Chaudhari have in their work focused on risk identification by performing quantitative and qualitative analysis. Their objective was to identify key risk factors that affect project schedule and also to determine the probability of completing the project within the scheduled date. The qualitative analysis was done by probability impact matrix and the quantitative analysis was done by PERT and Monte Carlo simulation using software called @RISK by Palisade corp. Rafiq M. Choudhry, et. al, have in their research identified and analysed risks associated with bridge construction in Pakistan. They started off by identifying various risks associated with a construction project and categorised them under seven main sections which were distributed in the form of questionnaires to engineers to determine the impact of risks on the construction. The feedback was used to create risk adjusted schedules. The simulation was performed and the system generated schedule and cost outputs were compared to the actual progress of the project. This comparison showed that the simulation results very nearly accurate with the actual project progress of the project than the planned Critical Path Method. Therefore the researchers concluded that a risk analysis must be performed and loaded with the project schedule to determine a more realistic schedule and cost. Nurazin Jupri and Muhammad Rozi Malim had conducted a case study on a medical campus, in which they analysed the various risk management processes associated with the construction of the campus. They identified two major risk factors following which they performed schedule analysis using PERT and Monte Carlo simulation. They concluded that the project had a very low probability for on time completion. 3. METHODOLOGY The implementation was done on a live project, which is a prayer hall having an area of 5000 sq ft. The first approach was to create a sequence of activities that are to be followed for the execution of the project, the second was to take in account the number of days each activity would require for completion. The next process involved loading all of the activities with their respective durations into Microsoft project, which is project management software. This is done to determine the critical path and understand the total project completion time, as doing this manually would be an arduous task. Specific settings are made to obtain the required output. Thereafter three time durations are assigned for each activity, the optimistic time, the most likely time and the pessimistic time. These are then loaded with the activities into crystal ball, which is basically a simulation software. A simulation is run to determine the project completion time by that method, also the probabilities of completing the project at any given time is determined. The percentage difference between the two time estimates is computed. Lastly the actual progress of the project is compared with the two time estimates to understand the accuracy of those time estimates. 3.1 Project duration using Critical Path Method The process followed to load the durations for each activity was to first create a calendar within Microsoft Project that matches the start time of our first activity. The working days were set from Monday to Saturday with a daily working time of eight hours. The work was expected to start from 9:00 AM in the morning till 6:00 PM in the evening. The lunch break of one hour was given from 1:00 PM to 2:00 PM. Sunday was designated as a non-working day. The next task was to set holidays within the calendar anticipating the absence of workers on those days. Once the calendar was prepared it was assigned to the project. The start date was taken as the 14th of December 2017. The next most important step was to assign the activity precedence relationship which basically signifies which activity is to be executed after the completion of a particular activity. Activities can start successively or simultaneously. For instance bar bending of reinforcements required for footings can start while the excavation of the soil is happening, also the bar bending of plinth beam reinforcements can happen simultaneously with the backfill of excavated earth. However the backfill of soil can only happen after the curing of footing concrete which is a successive order. Therefore it was important to establish this in order to obtain a critical path. Then the precedence relationship was established, as shown in figure 1. Fig -1: Activities with their durations and precedence relationship
  • 4. International Research Journal of Engineering and Technology (IRJET) e-ISSN: 2395-0056 Volume: 05 Issue: 06 | June-2018 www.irjet.net p-ISSN: 2395-0072 © 2018, IRJET | Impact Factor value: 6.171 | ISO 9001:2008 Certified Journal | Page 115 Then few activities were made to start after a certain completion of their preceding activities, for instance placing of the reinforcing bars and their formwork for footing can happen only after the pouring of P.C.C bed, but the bar bending can start while the excavation has started and can continue till the pouring of P.C.C bed. This process of making an activity start after a certain completion of its preceding activity is known as lead and lag of activities. Lead is when an activity can start before its scheduled time and lag is when an activity can start after its scheduled time. In this project the use of lead time was mainly done as a couple of activities could be started in this manner. The bar bending work mainly, could start in conjunction with the preceding activities, in this case a lead time of 4 days was given to footing activity which is a successor activity to both excavation and P.C.C bed, so the relationship given was that it could start with excavation and could also start 4 days before P.C.C bed, however P.C.C bed can start only after excavation. Similarly another activity, which is again the lintel and chejja activity, is made to start with a lead of 1 day while the brickwork is nearing completion. 3.2 Project duration using Monte Carlo simulation. The optimistic time, most likely time and the pessimistic time was determined. The most likely time for the activities was considered same as the one time duration given by the contractor. The pessimistic time was given by taking into account by considering various factors such as labour shortage, delay in supply of material, shortage of funds, and absence of labour and reconstruction of some structures because of faulty construction that could happen in every activity. For instance the execution time for excavation could take more days than required if only three labourers are employed instead of five labourers; also as procuring natural sand can delay the start of most activities that are dependent on it. The next scenario could be that the clients fall short of funds which causes a break in the project, also the staff of labourers employed may be under experienced or may have in a hurry caused flaws in the construction process. Hence there are many situations that could prolong the duration of any activity. On the other hand, the optimistic time is a complete contrast to the assumptions made for deciding pessimistic time. For instance, given the area of the site, the excavation of earthwork can happen in a day if an excavator is employed. Also instead of procuring natural sand manufactured sand can be procured. Activities may be completed sooner by employing more labourers or the efficiency of labourers may be on the higher side. All the three time estimates have been decided by consulting professionals and have been loaded into the Crystal Ball software. The new action here was to establish the activity dependence as many activities were given start to start relationships with lead time, it was done by giving the same start time of the preceding activity and the lead time was subtracted to get the exact start time of the successive activity. This computation was performed for all the activities that had those activity dependencies. Activities that had a finish to start relationship were simply assigned the end time of their preceding activity. Fig -2: Data input into Crystal Ball Software The next step was to define the distribution assumption that the activity should follow. Subject matter experts suggest that a Beta PERT assumption must be implemented as it predicts results more accurately. A representation of this has been shown in figure 3, when this distribution is selected a dialogue box appears in which the three time estimates are entered. Fig -3: Applying Beta PERT assumption Finally when the assumption is applied to all the activities, The Monte Carlo simulation is run to obtain the project completion time. For accurate estimate of the time 10,000 trials were run. The results thus obtained from the Monte Carlo simulations method are compared with the results obtained from the critical path method. 4. RESULTS AND DISCUSSION The basic intention was to make a comparison between the critical path method and the Monte Carlo simulation. For this a live project was taken up and the two methods were implemented to find the total project duration. Various efforts were made during the execution of this project, the outputs were obtained and have been analysed as to how they may be helpful in bettering our way of time estimation.
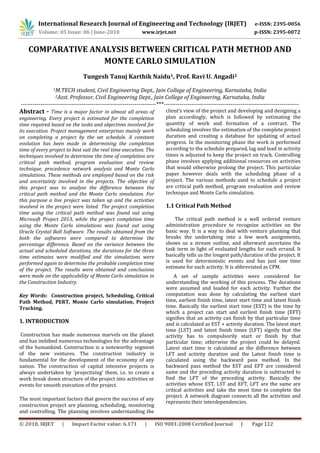
  • 5. International Research Journal of Engineering and Technology (IRJET) e-ISSN: 2395-0056 Volume: 05 Issue: 06 | June-2018 www.irjet.net p-ISSN: 2395-0072 © 2018, IRJET | Impact Factor value: 6.171 | ISO 9001:2008 Certified Journal | Page 116 4.1 Results obtained from Critical Path Method. The results were obtained by entering the activities into Microsoft project software, version 2013. Basically the critical path, which is the longest duration of the entire project was estimated from this software. This is represented in figure 4. Fig -4: Critical Path duration of project The total duration of the entire project was found to be 122 days which is approximately 4 months, the project was planned to start on 14th December 2017 and is expected to complete on 8th April 2018. This output was generated by taking into consideration all the constraints in the form of lag and lead times. The non-critical activities are electrification, ground floor internal plastering, first floor internal plastering all three of which have a slack time of 1 day and ground floor windows has a slack time 18 days. This means that the activities can be delayed to their respective slack days without causing a delay to the entire project. However a delay in the other activities which are critical will cause a delay to the entire project. 4.2 Tracking of Project Progress The project was monitored during its execution and the progress was updated in Microsoft project. This was done because usually the project varies from its scheduled time. The tracking is represented in figure 5. Fig -5: Actual project progress The total project completion time turns out to be 186 days which is approximately 6.1 months. Therefore there is a variance of 2.1 months from the scheduled duration. The footing activity takes 25 days for completion instead of 10 days, also the difference between the scheduled start and actual start of backfill activity is 25 days, 43 days for plinth beam, 54 days for backfill and brickwork up to floor level, 79 days for boulder soling and cement concrete bed, 107 days for column work and 69 days for brickwork till lintel level. Also the completion of the brick work up to lintel level happened before the start of column concreting, the sequence of which differs from the scheduled sequence in which the brickwork follows the completion of the column concreting. The total project duration variance of 2.1 months was mainly caused due to the delay in the activities during 30% completion of the project. 4.3 Results obtained from Monte Carlo simulation This method basically depends on three time estimates for every activity. A graph was generated which follows the Beta PERT distribution by running the simulation which is represented in figure 6. A cumulative frequency graph was generated to easily understand the frequency of trials and probabilities, as shown in figure 7. The probability of completion can be found at any given day. The project completion time is forecasted to be completed in 126.05 days which is approximately 4.14 months with a 50% probability. That is because the average result of all the 10,000 trials is 126.05, which is represented as the mean. The forecast is presented as a mean which is the central tendency of the distribution, also it can be noted from the graph that the standard deviation is 5. That is the dispersion of values from the mean occur by 5 units. The cumulative frequency graph represents the total trials performed along the right y-axis and the respective probabilities along the left y-axis.
  • 6. International Research Journal of Engineering and Technology (IRJET) e-ISSN: 2395-0056 Volume: 05 Issue: 06 | June-2018 www.irjet.net p-ISSN: 2395-0072 © 2018, IRJET | Impact Factor value: 6.171 | ISO 9001:2008 Certified Journal | Page 117 Fig -6: Bell Curve representing project completion time Fig -7: Cumulative frequency graph completion time Since the completion time by critical path method was found to be 122 days, the probability of completing the project by this duration was determined and was found to be 24.19% which is shown in figure 8. Fig -8: Probability completion at 122 days As the project was monitored during its execution the delays were re-entered as the most likely value and the pessimistic time was taken by considering both the delay and the completion time. After running the simulations assuming a Beta PERT distribution the completion time was forecasted at 376.85 days which is approximately 12.4 months. This is represented in figure 9. Fig -9: Probability completion after tracking 5. CONCLUSIONS The implications of time estimation of a project was analysed in this project by using critical path method and Monte Carlo simulation. This project laid emphasis on the impact of time estimates on project and not the implications cost of resources would have on the project. Tracking of a live project was done to analyse the difference between the time estimates made and the actual time taken. Each method have their own unique results. Variation in certain parameters was made to analyse the change in the results obtained. The project completion time by the critical path method was found to be 122 days that is 4 months and the completion time by the Monte Carlo simulation was found to be 126.05 days that is 4.2 months. Therefore the percentage difference between the two estimates turns out be 3.26%. Thus the two estimates were almost the same. This is because the most likely time for the Monte Carlo simulation was taken same as the one time estimate from the critical path method, also the variation between the optimistic and pessimistic times was not high. Therefore the variation isn’t much. The project progress was tracked till 30% completion and the duration was compared with the estimated durations by both the methods. The total project duration turned out to be 186 days which varies by 41.55% from the critical path estimate and 38.42% from the Monte Carlo simulation. This basically depicts that the project was not executed according to the planned dates. As the project was monitored the delay was found to be caused mainly by the irregularity of labourers and also the supply of materials to the site was delayed by nearly 2 months as the suppliers didn’t have the required stock. Based on the actual progress of the project, changes in the most likely time and pessimistic time were made by considering the sum of delays and the time for completion
  • 7. International Research Journal of Engineering and Technology (IRJET) e-ISSN: 2395-0056 Volume: 05 Issue: 06 | June-2018 www.irjet.net p-ISSN: 2395-0072 © 2018, IRJET | Impact Factor value: 6.171 | ISO 9001:2008 Certified Journal | Page 118 as most likely time and an approximate duration was estimated for pessimistic time by considering longer delays and same durations for completion. These times were entered into the software and simulations were run again. The project duration now was found to be 376.85 days and has a zero probability of completion within 187 days. This variation was because the difference between the optimistic and pessimistic value is large. However this estimate should be considered carefully as the project is small and will be completed within a year, nevertheless shortage of funds could prolong the completion time of the project. The Monte Carlo simulations are only as good as the time estimates. Therefore the optimistic, pessimistic and most likely values must be estimated with a good judgment, which requires a good amount of experience in project management. The technique complexity in applying the critical path method was simple as it had just one time estimate, whereas the Monte Carlo simulation is relatively difficult as three time estimates had to be made. REFERENCES [1] Goran Avlijaš, “Examining the Value of Monte Carlo Simulation for Project Time Management”, Management: Journal of Sustainable Business and Management Solutions in Emerging Economies, 2018. [2] G Liquet, J Lozano, M Cascales, “Decision-Making for Risk Management in Sustainable Renewable Energy Facilities: A Case Study in the Dominican Republic”, Sustainability 2016, pp. 1-21. [3] J Wang, Y. Wu and D Haung, “Major Earthquakes around Taipei and a Seismic Hazard Assessment with Monte Carlo Simulation”, Natural Hazards Review, Volume 16, Issue 4, November 2015, pp. 1-7. [4] K. Kirytopoulos, V. Leopolus and V. Diamantas, “Pert versus Monte Carlo simulation in low risk projects”, CME 2007 Conference - Construction Management and Economics: 'Past, Present and Future'. 1419-1427. [5] K K Chitkara, “Construction Project Management”, third edition, Mc Graw Hill Education (India) Private Limited, 2014. [6] Nurazin Jupri and Muhammad Rozi Malim. “Risk Analysis of Construction Project Scheduling using PERT and Monte Carlo Simulation: A Case Study on NIOSH Campus”, International Journal of Accounting and Business Management, ISSN: 2289-4519, Volume 1, April 2013, pp. 83-91. [7] Pratik Ganame and Pravin Chaudhari, “Construction Building Schedule Risk Analysis Using Schedule Risk Analysis”, International Research Journal of Engineering and Technology, Volume 2, Issue 4, July 2015, pp. 1402-1406. [8] R Choudhry, M Aslam, J Hinze and F Arain, “Cost and Schedule Risk Analysis of Bridge Construction in Pakistan: Establishing Risk Guidelines”, Journal of Construction Engineering and Management, Volume 140, Issue 7, July 2014, pp. 1-9. [9] T Ersahin, B Macabe and M Doyle, “Monte Carlo Simulation Analysis at Lester B Pearson International Airport Development Project”, Construction Research Congress, 2003, pp. 1-8. [10] Z Kong, J Zhang, C Li, X Zheng and Q Guan, “Risk Assessment of Plan Schedule by Monte Carlo Simulation”, International Conference on Information Technology and Management Innovation, 2015, pp. 509-513.