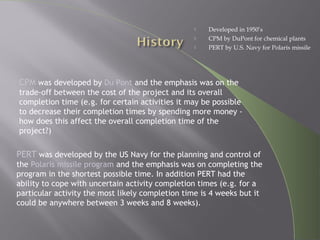
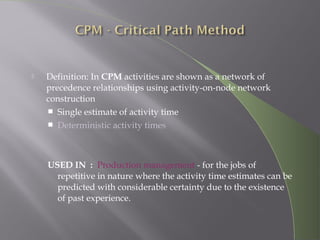
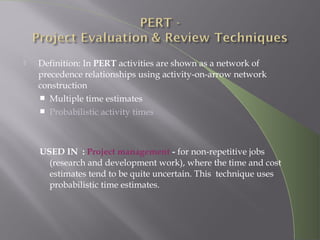
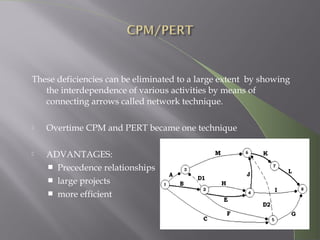
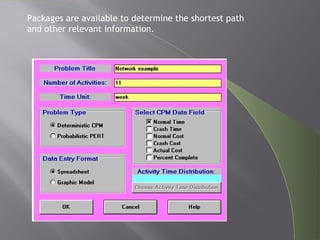
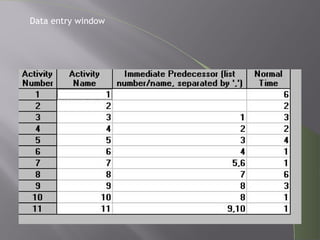
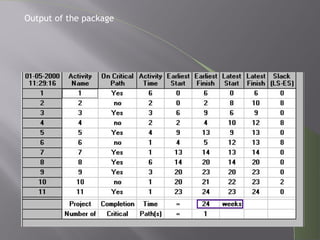
CPM/PERT
By Sujith bhaskar R
 Developed in 1950’s
 CPM by DuPont for chemical plants
 PERT by U.S. Navy for Polaris missile
PERT was developed by the US Navy for the planning and control of
the Polaris missile program and the emphasis was on completing the
program in the shortest possible time. In addition PERT had the
ability to cope with uncertain activity completion times (e.g. for a
particular activity the most likely completion time is 4 weeks but it
could be anywhere between 3 weeks and 8 weeks).
CPM was developed by Du Pont and the emphasis was on the
trade-off between the cost of the project and its overall
completion time (e.g. for certain activities it may be possible
to decrease their completion times by spending more money -
how does this affect the overall completion time of the
project?)
 Definition: In CPM activities are shown as a network of
precedence relationships using activity-on-node network
construction
 Single estimate of activity time
 Deterministic activity times
USED IN : Production management - for the jobs of
repetitive in nature where the activity time estimates can be
predicted with considerable certainty due to the existence
of past experience.
 Definition: In PERT activities are shown as a network of
precedence relationships using activity-on-arrow network
construction
 Multiple time estimates
 Probabilistic activity times
USED IN : Project management - for non-repetitive jobs
(research and development work), where the time and cost
estimates tend to be quite uncertain. This technique uses
probabilistic time estimates.
Originated by H.L.Gantt in 1918
Gantt chart
Advantages
- Gantt charts are quite commonly used.
They provide an easy graphical
representation of when activities (might)
take place.
Limitations
- Do not clearly indicate details regarding
the progress of activities
- Do not give a clear indication of
interrelation ship between the separate
activities
These deficiencies can be eliminated to a large extent by showing
the interdependence of various activities by means of
connecting arrows called network technique.
 Overtime CPM and PERT became one technique
 ADVANTAGES:
 Precedence relationships
 large projects
 more efficient
 Use of nodes and arrows
Arrows An arrow leads from tail to head directionally
 Indicate ACTIVITY, a time consuming effort that is required to
perform a part of the work.
Nodes  A node is represented by a circle
- Indicate EVENT, a point in time where one or more activities start
and/or finish.
Activity on Node
- A completion of an activity
is represented by a node
Activity on Arrow
- An arrow represents a task,
while a node is the
completion of a task
- Arrows represent order of
events
Each event has two important times associated with it :
- Earliest time , Te , which is a calendar time when a event can occur
when all the predecessor events completed at the earliest possible
times
- Latest time , TL , which is the latest time the event can occur with
out delaying the subsequent events and completion of project.
 Difference between the latest time and the earliest time of an event is
the slack time for that event
Positive slack : Slack is the amount of time an event can be delayed
without delaying the project completion
 Is that the sequence of activities and events where there is no
“slack” i.e.. Zero slack
 Longest path through a network
 minimum project completion time
 Useful at many stages of project management
 Mathematically simple
 Give critical path and slack time
 Provide project documentation
 Useful in monitoring costs
•"What activities must be finished before this activity can start"
•could we complete this project in 30 weeks?
•could we complete this project in 2 weeks?
One answer could be, if we first do activity 1, then activity 2, then activity
3, ...., then activity 10, then activity 11 and the project would then take the sum
of the activity completion times, 30 weeks.
“What is the minimum possible time in which we can complete this project ? “
Before starting any of the above activity, the questions
asked would be
We shall see below how the network analysis diagram/picture we construct
helps us to answer this question.
CRITICAL PATH TAKES 24 WEEKS FOR THE COMPLETION OF THE PROJECT
Packages are available to determine the shortest path
and other relevant information.
Data entry window
Output of the package
 Clearly defined, independent and stable activities
 Specified precedence relationships
 Over emphasis on critical paths

S pert cpm

  • 1.
  • 2.
     Developed in1950’s  CPM by DuPont for chemical plants  PERT by U.S. Navy for Polaris missile PERT was developed by the US Navy for the planning and control of the Polaris missile program and the emphasis was on completing the program in the shortest possible time. In addition PERT had the ability to cope with uncertain activity completion times (e.g. for a particular activity the most likely completion time is 4 weeks but it could be anywhere between 3 weeks and 8 weeks). CPM was developed by Du Pont and the emphasis was on the trade-off between the cost of the project and its overall completion time (e.g. for certain activities it may be possible to decrease their completion times by spending more money - how does this affect the overall completion time of the project?)
  • 3.
     Definition: InCPM activities are shown as a network of precedence relationships using activity-on-node network construction  Single estimate of activity time  Deterministic activity times USED IN : Production management - for the jobs of repetitive in nature where the activity time estimates can be predicted with considerable certainty due to the existence of past experience.
  • 4.
     Definition: InPERT activities are shown as a network of precedence relationships using activity-on-arrow network construction  Multiple time estimates  Probabilistic activity times USED IN : Project management - for non-repetitive jobs (research and development work), where the time and cost estimates tend to be quite uncertain. This technique uses probabilistic time estimates.
  • 5.
    Originated by H.L.Ganttin 1918 Gantt chart Advantages - Gantt charts are quite commonly used. They provide an easy graphical representation of when activities (might) take place. Limitations - Do not clearly indicate details regarding the progress of activities - Do not give a clear indication of interrelation ship between the separate activities
  • 6.
    These deficiencies canbe eliminated to a large extent by showing the interdependence of various activities by means of connecting arrows called network technique.  Overtime CPM and PERT became one technique  ADVANTAGES:  Precedence relationships  large projects  more efficient
  • 7.
     Use ofnodes and arrows Arrows An arrow leads from tail to head directionally  Indicate ACTIVITY, a time consuming effort that is required to perform a part of the work. Nodes  A node is represented by a circle - Indicate EVENT, a point in time where one or more activities start and/or finish.
  • 8.
    Activity on Node -A completion of an activity is represented by a node Activity on Arrow - An arrow represents a task, while a node is the completion of a task - Arrows represent order of events
  • 9.
    Each event hastwo important times associated with it : - Earliest time , Te , which is a calendar time when a event can occur when all the predecessor events completed at the earliest possible times - Latest time , TL , which is the latest time the event can occur with out delaying the subsequent events and completion of project.  Difference between the latest time and the earliest time of an event is the slack time for that event Positive slack : Slack is the amount of time an event can be delayed without delaying the project completion
  • 10.
     Is thatthe sequence of activities and events where there is no “slack” i.e.. Zero slack  Longest path through a network  minimum project completion time
  • 11.
     Useful atmany stages of project management  Mathematically simple  Give critical path and slack time  Provide project documentation  Useful in monitoring costs
  • 12.
    •"What activities mustbe finished before this activity can start" •could we complete this project in 30 weeks? •could we complete this project in 2 weeks? One answer could be, if we first do activity 1, then activity 2, then activity 3, ...., then activity 10, then activity 11 and the project would then take the sum of the activity completion times, 30 weeks. “What is the minimum possible time in which we can complete this project ? “ Before starting any of the above activity, the questions asked would be
  • 13.
    We shall seebelow how the network analysis diagram/picture we construct helps us to answer this question.
  • 14.
    CRITICAL PATH TAKES24 WEEKS FOR THE COMPLETION OF THE PROJECT
  • 15.
    Packages are availableto determine the shortest path and other relevant information.
  • 16.
  • 17.
  • 18.
     Clearly defined,independent and stable activities  Specified precedence relationships  Over emphasis on critical paths