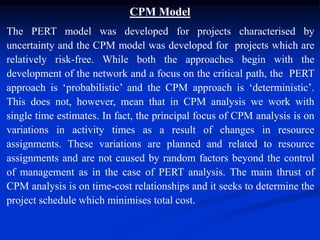
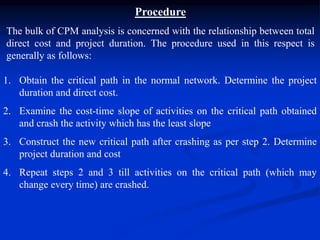
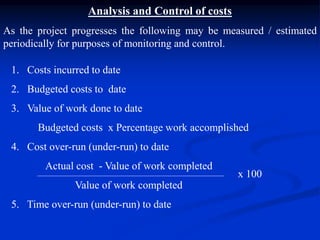
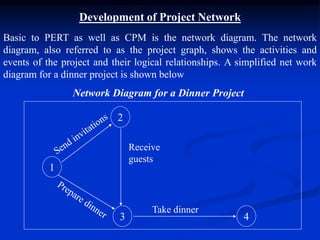
This document provides an overview of network techniques for project management, including PERT and CPM models. Key points covered include: developing a project network diagram; determining critical paths and calculating floats; time and cost estimation; scheduling activities based on available resources; and using the network to project costs and monitor project progress. PERT uses probabilistic analysis while CPM is deterministic, focusing on time-cost tradeoffs when crashing activities. The network allows visualization of activity relationships and quantitative analysis of schedule options and resource constraints.


![Earliest Occurrence Time (EOT)
The general formula for EOT is :
EOT (i) = Max [ EOT (k) + d (k,i)]
Where EOT(i) = earliest occurrence time for event i
EOT(k) = earliest occurrence time for event k (k
precedes i and there may be several ks)
d (k,i) = duration of activity (k,i)
The maximisation shown is considering all activities (k,i) leading to
event node i.](https://image.slidesharecdn.com/chapter22networktechniquesforprojectmanagement-191118042207/85/Chapter22-networktechniquesforprojectmanagement-11-320.jpg)
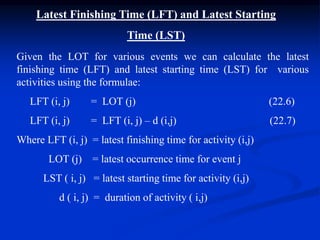
![Latest Occurrence Time (LOT)
The general formula for LOT is :
LOT (i) = Min [LOT (j) - d(i,j)]
Where LOT (i) = latest occurrence time for i
LOT (j) = latest occurrence time for j( j follows i
and there may be several j’s)
d(i, j) = duration of activity (i,j)
The minimisation shown here is done with respect to all activities
(i,j) starting from i.](https://image.slidesharecdn.com/chapter22networktechniquesforprojectmanagement-191118042207/85/Chapter22-networktechniquesforprojectmanagement-13-320.jpg)