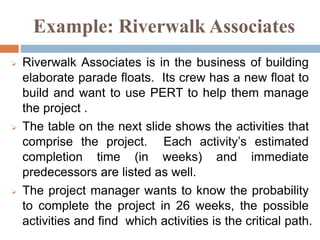
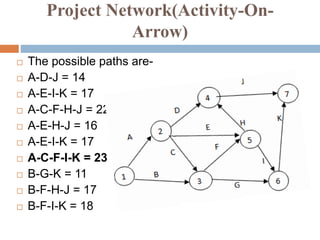
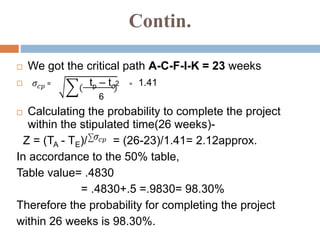
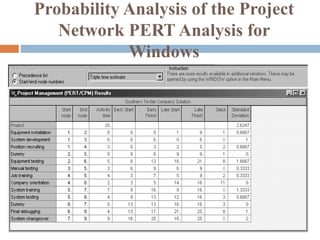
APPLICATION OF
PERT IN PROJECT
MANAGEMENT
Presented by-
Zulfequar Ali (26)
Harshita Ankit (27)
Amit Soren (28)
Shruti Sagar (29)
Nidhi Prawina Tigga
(30)
1
2
3
4
5 6
142 weeks
Introduction to PERT
“Project Evaluation and review Technique"
 Schedules method originally to plan of
manufacturing project.
 Employs a network interrelated activities.
 Coordinates optimum cost and time criteri
a.
 Emphasizes the relationship between time
each activity takes and cost associated
for the completion of the entire project.
Applications in Project Management
 PERT is used to plan, schedule and
control a wide variety of project:
• R & D of new products and processes
• Construction of buildings and highways
• Maintenance of large and complex
equipment
• Design and installation of new systems
Example: Riverwalk Associates
 Riverwalk Associates is in the business of building
elaborate parade floats. Its crew has a new float to
build and want to use PERT to help them manage
the project .
 The table on the next slide shows the activities that
comprise the project. Each activity’s estimated
completion time (in weeks) and immediate
predecessors are listed as well.
 The project manager wants to know the probability
to complete the project in 26 weeks, the possible
activities and find which activities is the critical path.
Project activity initial
information:
ACTIVITY
(i)
IMMEDIATE
PRECEDEN
CE
OPTIMISTIC
TIME (tO)
MOST
LIKELY
TIME (tm)
PESSIMISTI
C TIME (tp)
A - 4 6 8
B - 1 4.5 5
C A 3 3 3
D A 4 5 6
E A 0.5 1 1.5
F B,C 3 4 5
G B,C 1 1.5 5
H E, F 5 6 7
I E, F 2 5 8
J D, H 2.5 2.75 4.5
Activity Expected Time and
Variances
ACTIVITY (i)
te = (tO + 4tm + tp)/6
EXPECTED TIME (te)
s2
i = ((tp-tO)/6)2
VARIANCE
(week2)
A 6 4/9
B 4 4/9
C 3 0
D 5 1/9
E 1 1/36
F 4 1/9
G 2 4/9
H 6 1/9
I 5 1
J 3 1/9
Project Network(Activity-On-
Arrow)
 The possible paths are-
 A-D-J = 14
 A-E-I-K = 17
 A-C-F-H-J = 22
 A-E-H-J = 16
 A-E-I-K = 17
 A-C-F-I-K = 23
 B-G-K = 11
 B-F-H-J = 17
 B-F-I-K = 18
Contin.
 We got the critical path A-C-F-I-K = 23 weeks
 = tp – to2 = 1.41
6
 Calculating the probability to complete the project
within the stipulated time(26 weeks)-
Z = (TA - TE)/ = (26-23)/1.41= 2.12approx.
In accordance to the 50% table,
Table value= .4830
= .4830+.5 =.9830= 98.30%
Therefore the probability for completing the project
within 26 weeks is 98.30%.
Probability Analysis of the Project
Network PERT Analysis for
Windows
Conclusion
Applications of pert

Applications of pert

  • 1.
    APPLICATION OF PERT INPROJECT MANAGEMENT Presented by- Zulfequar Ali (26) Harshita Ankit (27) Amit Soren (28) Shruti Sagar (29) Nidhi Prawina Tigga (30) 1 2 3 4 5 6 142 weeks
  • 2.
    Introduction to PERT “ProjectEvaluation and review Technique"  Schedules method originally to plan of manufacturing project.  Employs a network interrelated activities.  Coordinates optimum cost and time criteri a.  Emphasizes the relationship between time each activity takes and cost associated for the completion of the entire project.
  • 3.
    Applications in ProjectManagement  PERT is used to plan, schedule and control a wide variety of project: • R & D of new products and processes • Construction of buildings and highways • Maintenance of large and complex equipment • Design and installation of new systems
  • 4.
    Example: Riverwalk Associates Riverwalk Associates is in the business of building elaborate parade floats. Its crew has a new float to build and want to use PERT to help them manage the project .  The table on the next slide shows the activities that comprise the project. Each activity’s estimated completion time (in weeks) and immediate predecessors are listed as well.  The project manager wants to know the probability to complete the project in 26 weeks, the possible activities and find which activities is the critical path.
  • 5.
    Project activity initial information: ACTIVITY (i) IMMEDIATE PRECEDEN CE OPTIMISTIC TIME(tO) MOST LIKELY TIME (tm) PESSIMISTI C TIME (tp) A - 4 6 8 B - 1 4.5 5 C A 3 3 3 D A 4 5 6 E A 0.5 1 1.5 F B,C 3 4 5 G B,C 1 1.5 5 H E, F 5 6 7 I E, F 2 5 8 J D, H 2.5 2.75 4.5
  • 6.
    Activity Expected Timeand Variances ACTIVITY (i) te = (tO + 4tm + tp)/6 EXPECTED TIME (te) s2 i = ((tp-tO)/6)2 VARIANCE (week2) A 6 4/9 B 4 4/9 C 3 0 D 5 1/9 E 1 1/36 F 4 1/9 G 2 4/9 H 6 1/9 I 5 1 J 3 1/9
  • 7.
    Project Network(Activity-On- Arrow)  Thepossible paths are-  A-D-J = 14  A-E-I-K = 17  A-C-F-H-J = 22  A-E-H-J = 16  A-E-I-K = 17  A-C-F-I-K = 23  B-G-K = 11  B-F-H-J = 17  B-F-I-K = 18
  • 8.
    Contin.  We gotthe critical path A-C-F-I-K = 23 weeks  = tp – to2 = 1.41 6  Calculating the probability to complete the project within the stipulated time(26 weeks)- Z = (TA - TE)/ = (26-23)/1.41= 2.12approx. In accordance to the 50% table, Table value= .4830 = .4830+.5 =.9830= 98.30% Therefore the probability for completing the project within 26 weeks is 98.30%.
  • 9.
    Probability Analysis ofthe Project Network PERT Analysis for Windows
  • 10.