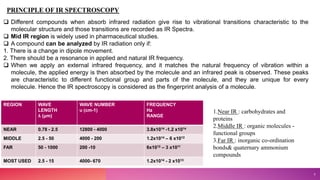
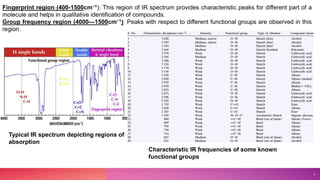
This document provides an overview of infrared (IR) spectroscopy. It discusses the basic principles of IR spectroscopy, including molecular vibrations and instrumentation. The major components of IR spectrometers are described, such as IR radiation sources, wavelength selectors, sample handling techniques, detectors, and recorders. Factors that can affect vibrational frequencies are outlined. Finally, applications of IR spectroscopy in fields like pharmaceutical analysis are mentioned.


![Fundamental vibrations
1. Bond Stretching vibration: In stretching vibration, the length of a bond is changed i.e. either increased or decreased.
It is of two types:
A] Symmetrical stretching: Here the two bonds increase or decreases in length in a symmetric pattern.
B] Asymmetrical stretching: Here when one bond length increases the other one decreases.
2. Bending vibration:
Bending vibrations are of two sub-types.
1) In plane
A] Rocking : The atoms swing back and forth concerning the central atom of a molecule Two hydrogen atoms of a methylene
molecule move outward simultaneously and inward simultaneously
B] Scissoring : The two atoms approach each other and go away from each other.
2) Out of the plane
A] Wagging : Such type of vibration occurs when both the atoms of a molecule move one side of the plane
B] Twisting : In twisting, one molecule is above the plane and the other molecule is below the plane.
Non-fundamental vibrations:
1. Overtone vibrations occur at twice or thrice the value of fundamental vibrations.
2. Combination bands are the bands that result because of coupling of fundamental frequencies.
3. Fermi resonance bands are produced because of coupling between fundamental vibration and an overtone or because of a
combination band.
9](https://image.slidesharecdn.com/irspectrocopy-231130082556-7a57f04e/85/IR-SPECTROCOPY-Instrumentation-of-IR-spectroscopy-Application-of-IR-spectroscopy-pptx-9-320.jpg)
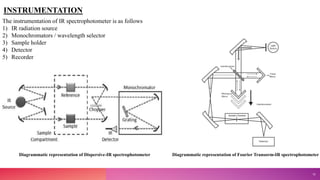
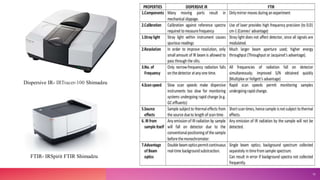


![2) WAVELENGTH SELECTORS / MONOCHROMATORS
They help in selecting a continuous IR radiation in the desired wavelength region.
They generally contain a chopper and a complex system of monochromators.
The choppers are generally used to enhance the signal to noise ratio of the instrument, and they also moderate
the intensity of radiation that reaches to the detector.
The monochromator is used to select it desired frequency of radiation which will be then allowed to incident on
the detector.
These monochromators are of two types:
1. Prismatic monochromator: They are made up of
glass/quartz and coated with alkyl halides.
A] Mono Pass (Radiation passes only once through the prism)
B] Double Pass (Radiation passes twice through the prism)
2. Grating monochromator: They are grooves made up of
aluminium and provide better dispersion of radiation than prisms.
A] Reflection gratings
B] Transmittance grating
17](https://image.slidesharecdn.com/irspectrocopy-231130082556-7a57f04e/85/IR-SPECTROCOPY-Instrumentation-of-IR-spectroscopy-Application-of-IR-spectroscopy-pptx-17-320.jpg)

![FACTORS AFFECTING VIBRATIONAL FREQUENCIES
A] Coupled vibration
An isolated C-H bond has only one stretching vibration frequency whereas methylene group shows two stretching vibrations
both symmetrical and asymmetrical.
Because of mechanical coupling or interaction between CH stretching vibrations in the CH2 group.
Asymmetric vibrations develop at higher frequency or wave numbers than stretching vibrations.
Such vibrations are called coupled vibrations because these vibrations occur at different frequency then the required for an
isolated CH stretching
B] Fermi resonance
Coupling of two fundamental vibration modes produces 2 new modes of vibration.
With frequencies higher and lower than the observed in absence of interaction.
This interaction takes place between fundamental vibrations and overtones, or combination tone vibration and they are
collectively called us Fermi resonance.
In Fermi resonance molecule transfer energy from fundamental vibrations into overtone or combination bands.
The resonance pushes the two levels apart and mixes their character and each level has some amount of fundamental and some
amount of overtone or combination tone characters.
21](https://image.slidesharecdn.com/irspectrocopy-231130082556-7a57f04e/85/IR-SPECTROCOPY-Instrumentation-of-IR-spectroscopy-Application-of-IR-spectroscopy-pptx-21-320.jpg)
![FACTORS AFFECTING VIBRATIONAL FREQUENCIES
C] Electronic effects
Changing the absorption frequencies for a particular group takes place when the substituent in the neighborhood of the group
is changed.
They include
Inductive effect: Inclusion of alkyl group gives +ve Inductive effect producing decreased absorption frequency. Adding an
electronegative atom or group produces –ve inductive effect leading to increased absorption frequency.
Mesomeric effect: It produces lengthening or weakening of a bond leading to lowering of absorption frequency.
Field effect: In ortho substituted compounds, the lone pair of electrons on two atoms influence each other through space
interactions and change the vibrational frequencies of both the groups. Example: Ortho halo acetophenone. This is called field
effect.
D] Hydrogen bonding
It occurs in any system having a proton donor group and a proton acceptor. If the S orbital of the proton effectively overlaps
the P or 𝜋 orbital of the acceptor group.
The stronger the hydrogen bond, the longer the OH bond, the lower the vibration frequency, broader and more intense will be
the absorption.
Intermolecular bonds produce broad bands whereas intramolecular hydrogen bonds produce sharp and well-defined bands.
22](https://image.slidesharecdn.com/irspectrocopy-231130082556-7a57f04e/85/IR-SPECTROCOPY-Instrumentation-of-IR-spectroscopy-Application-of-IR-spectroscopy-pptx-22-320.jpg)