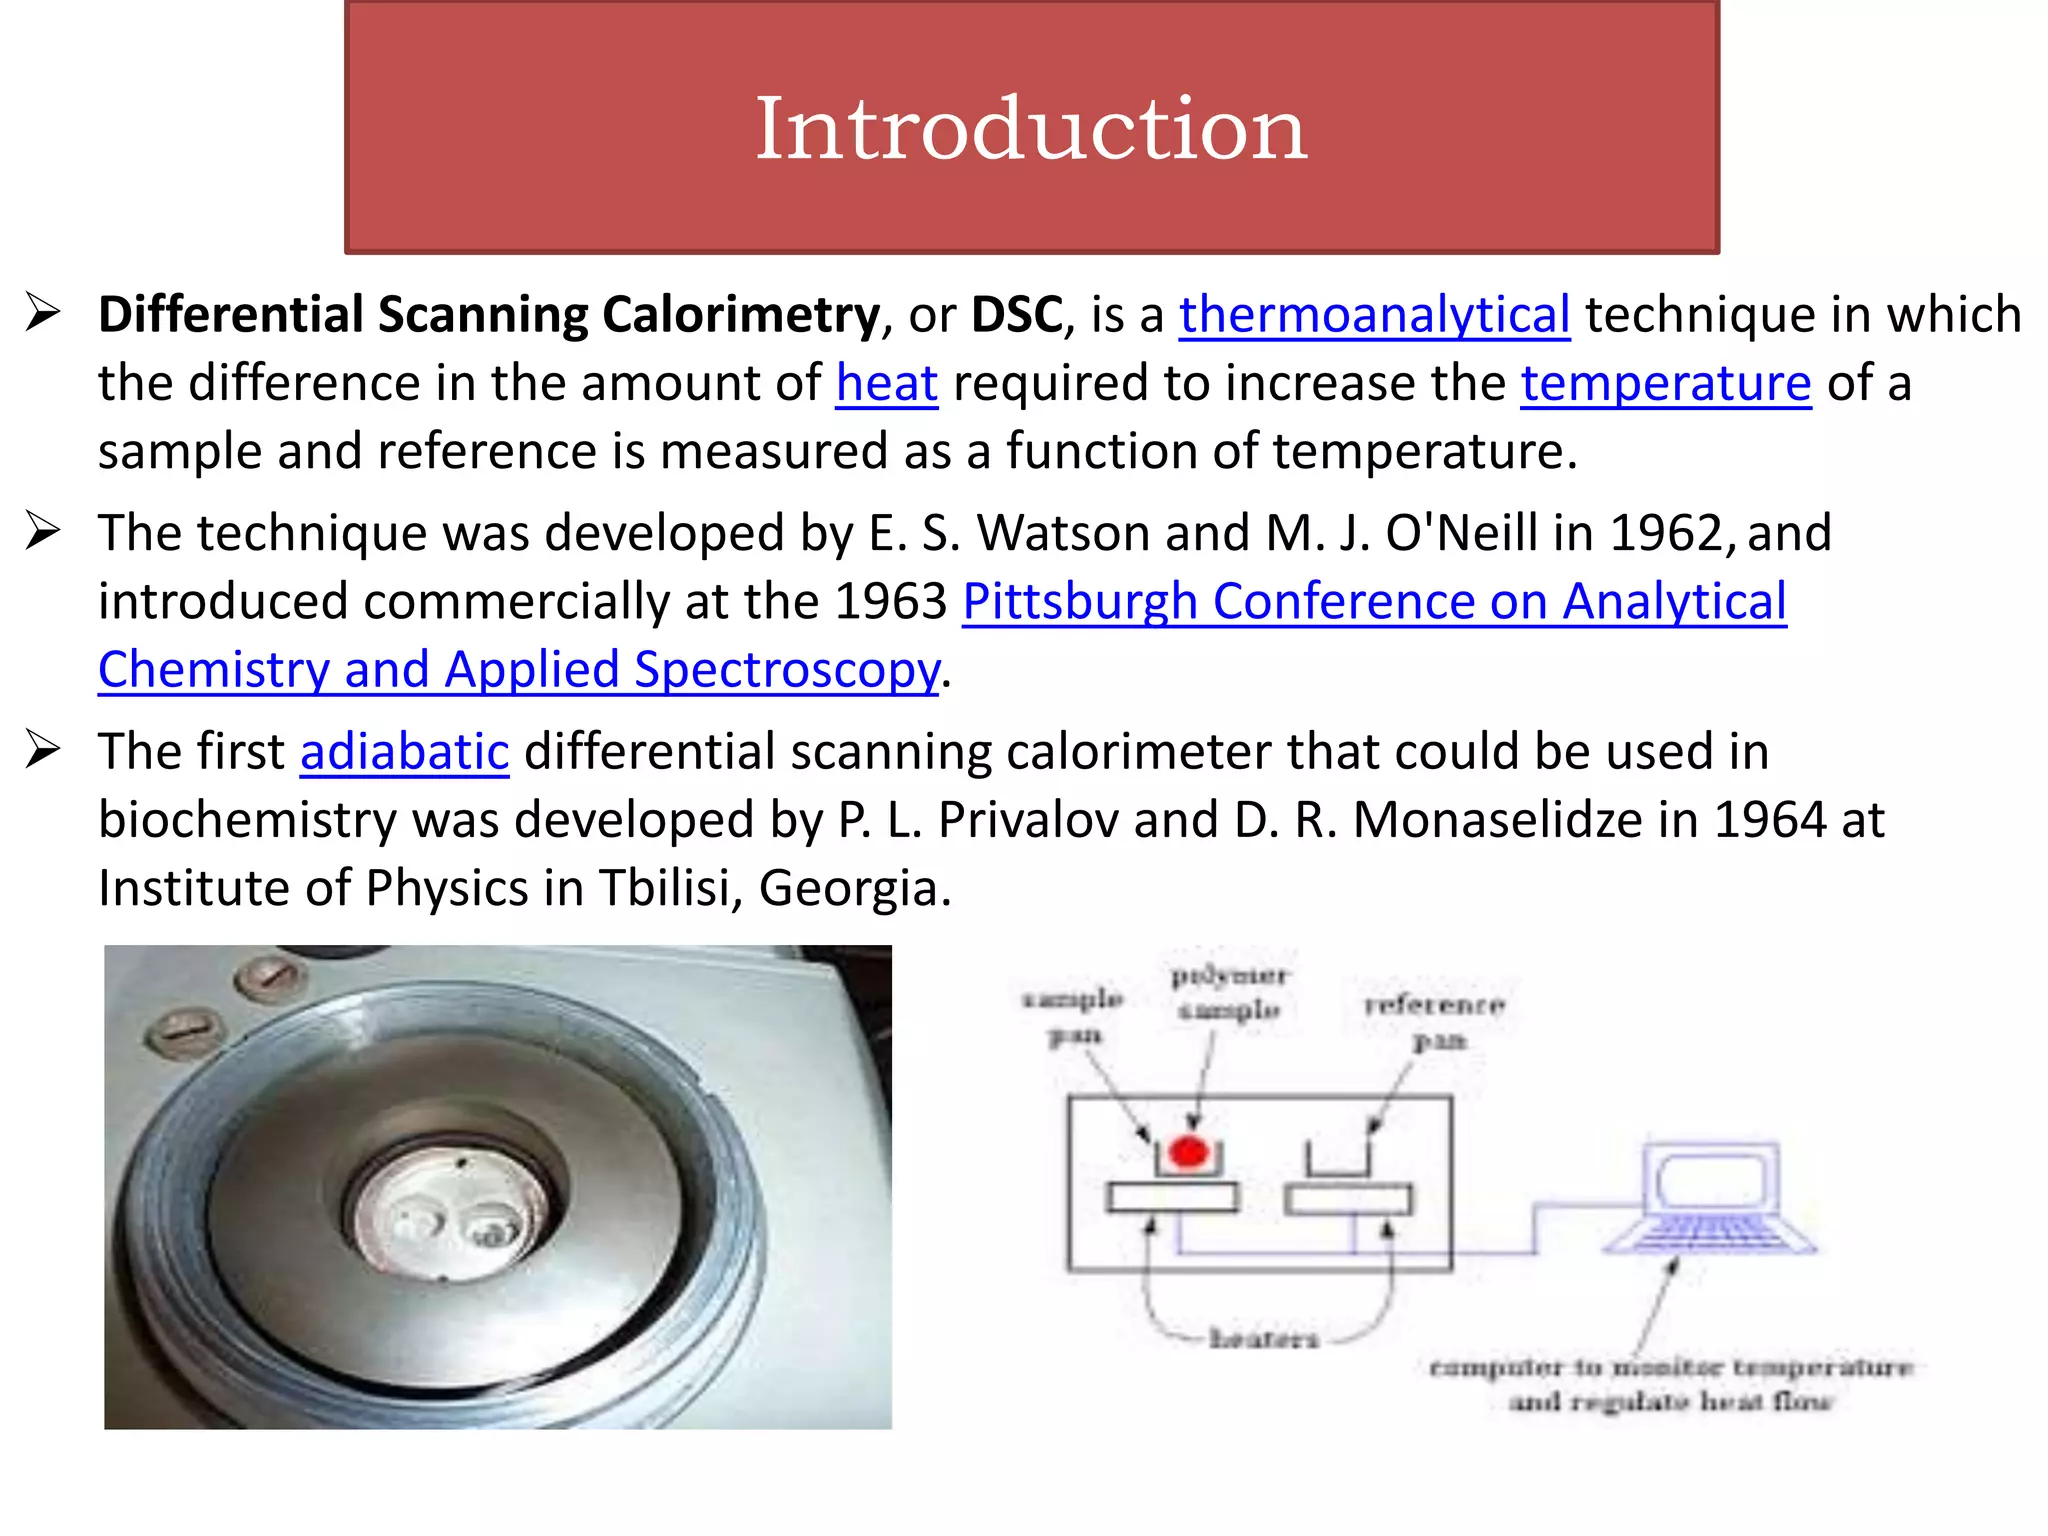
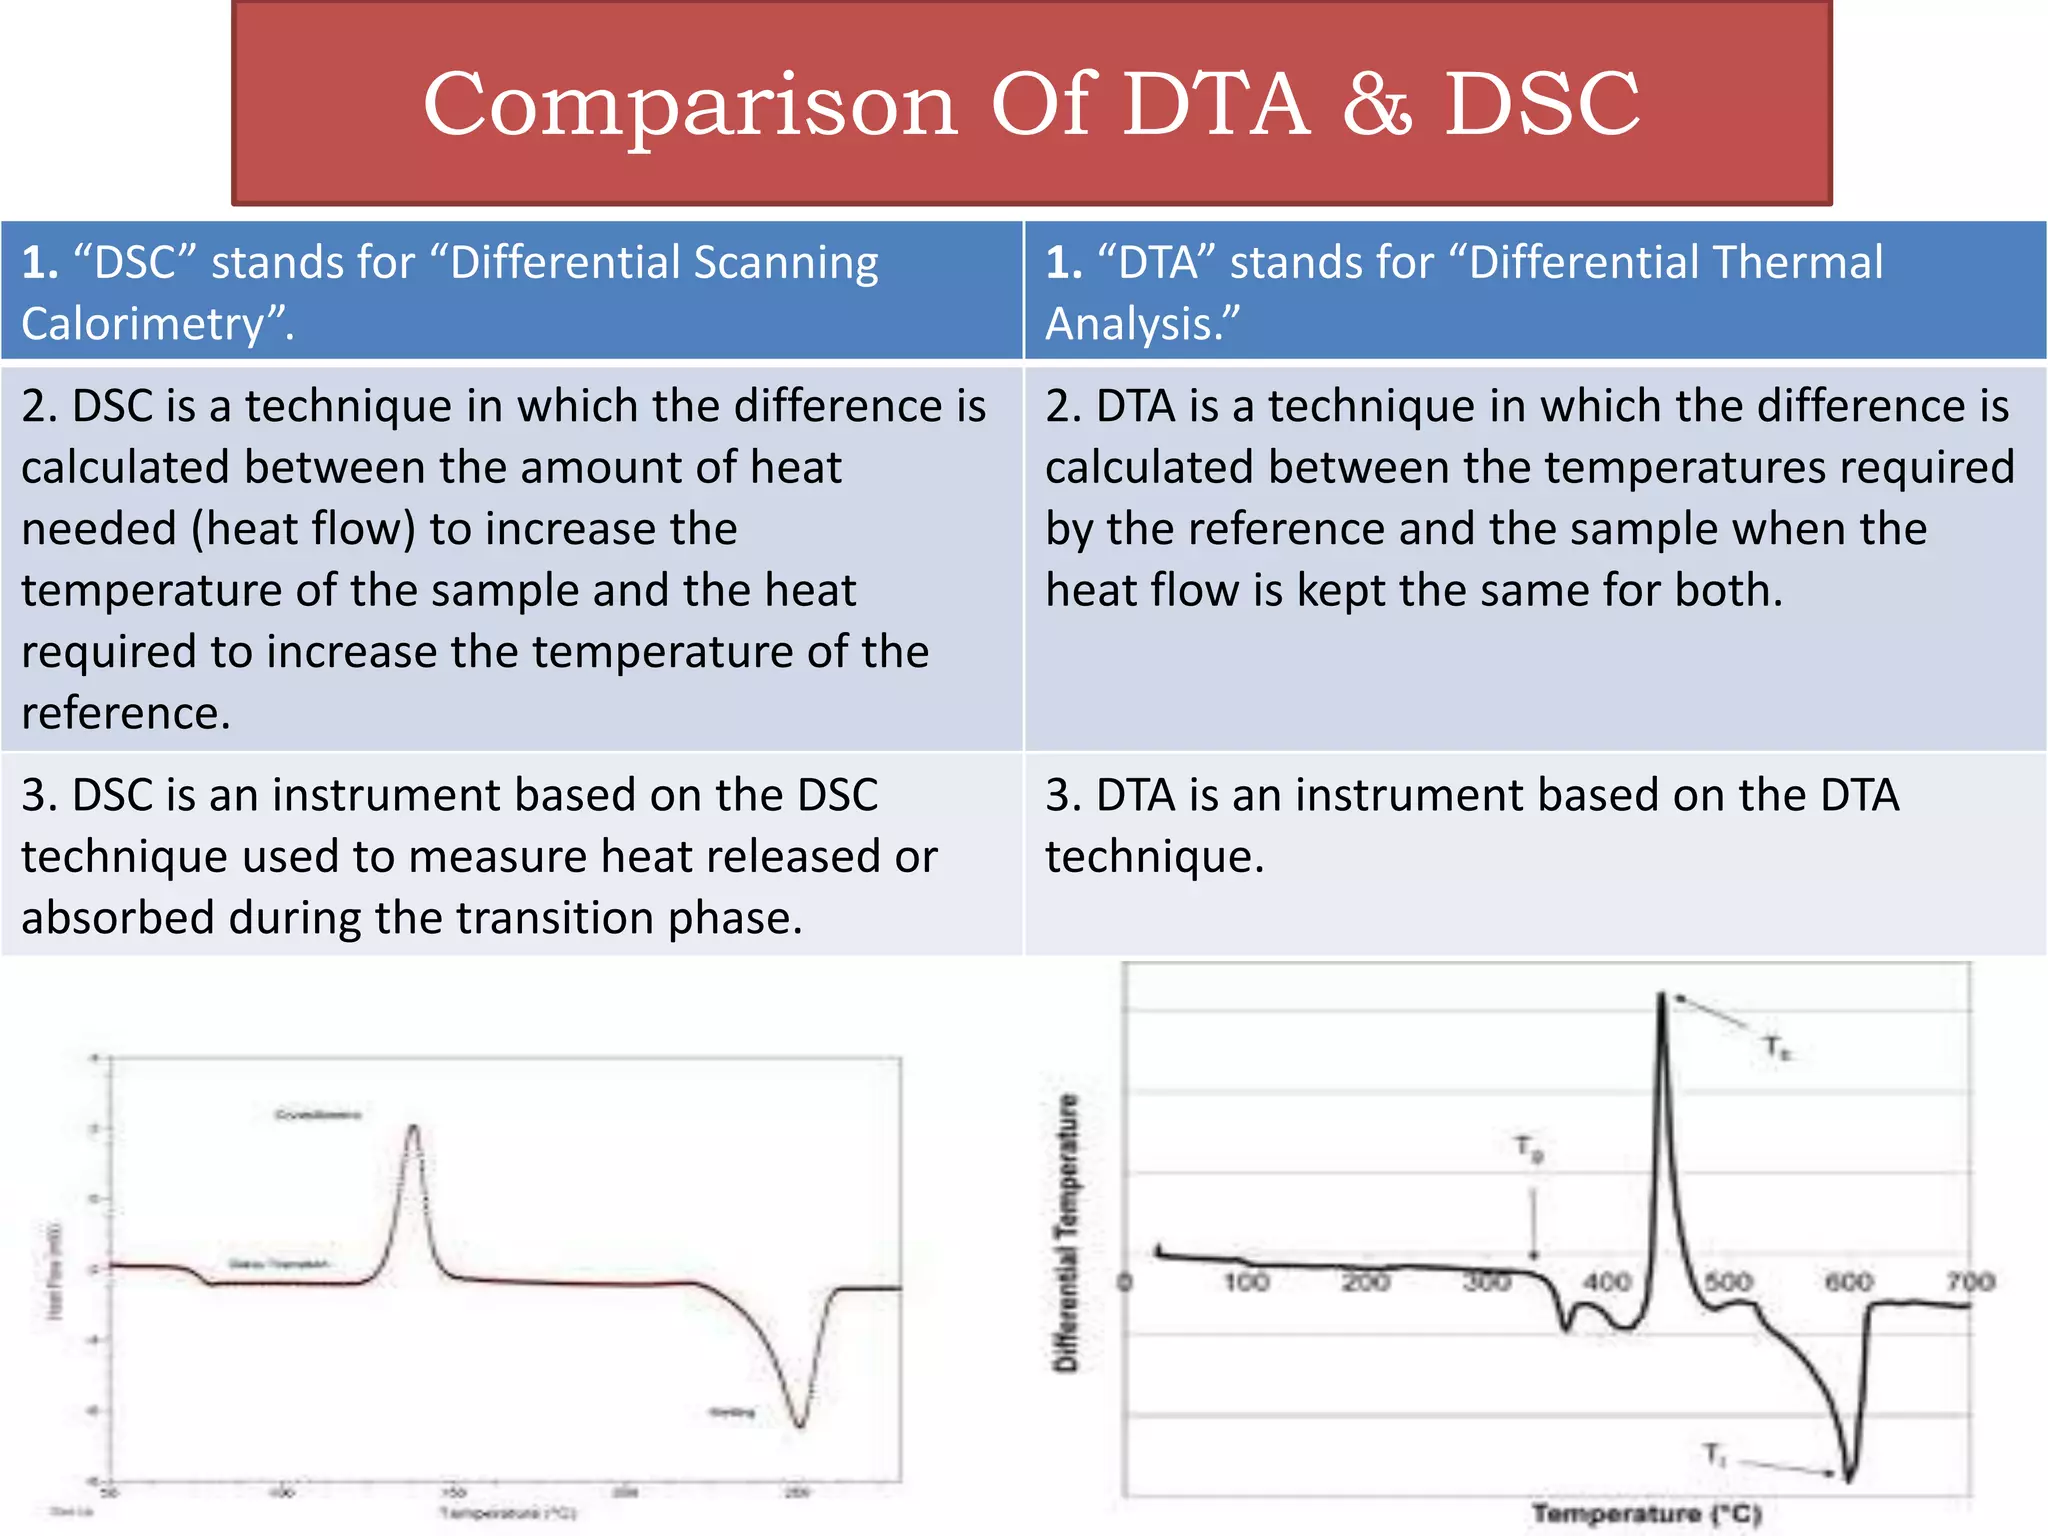
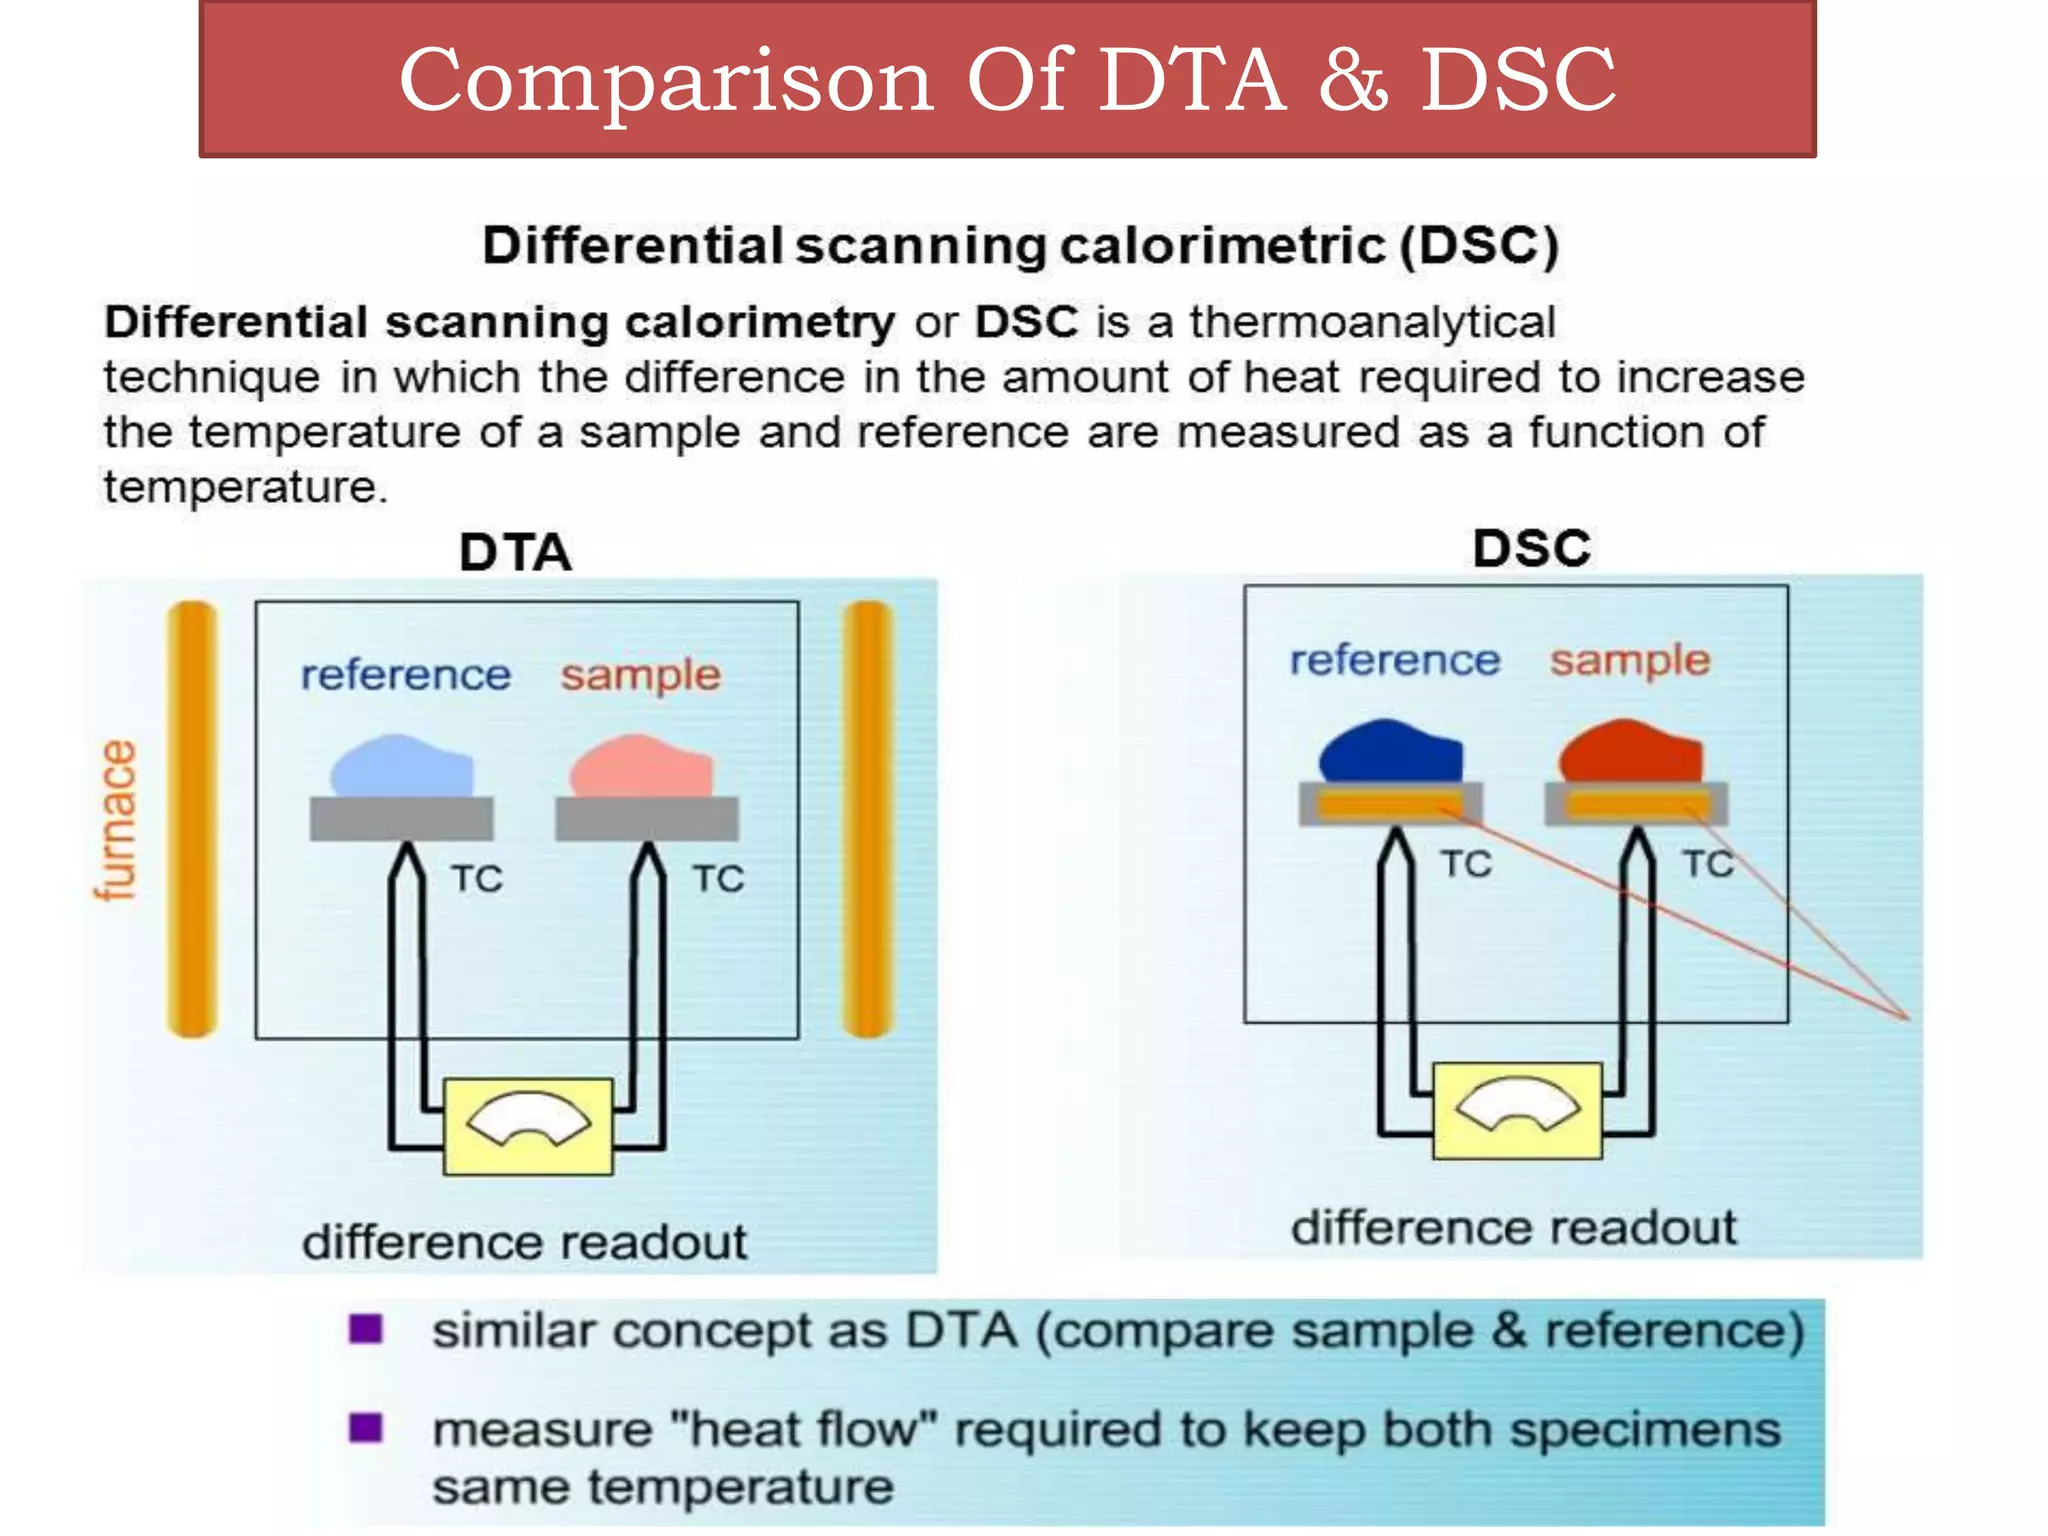
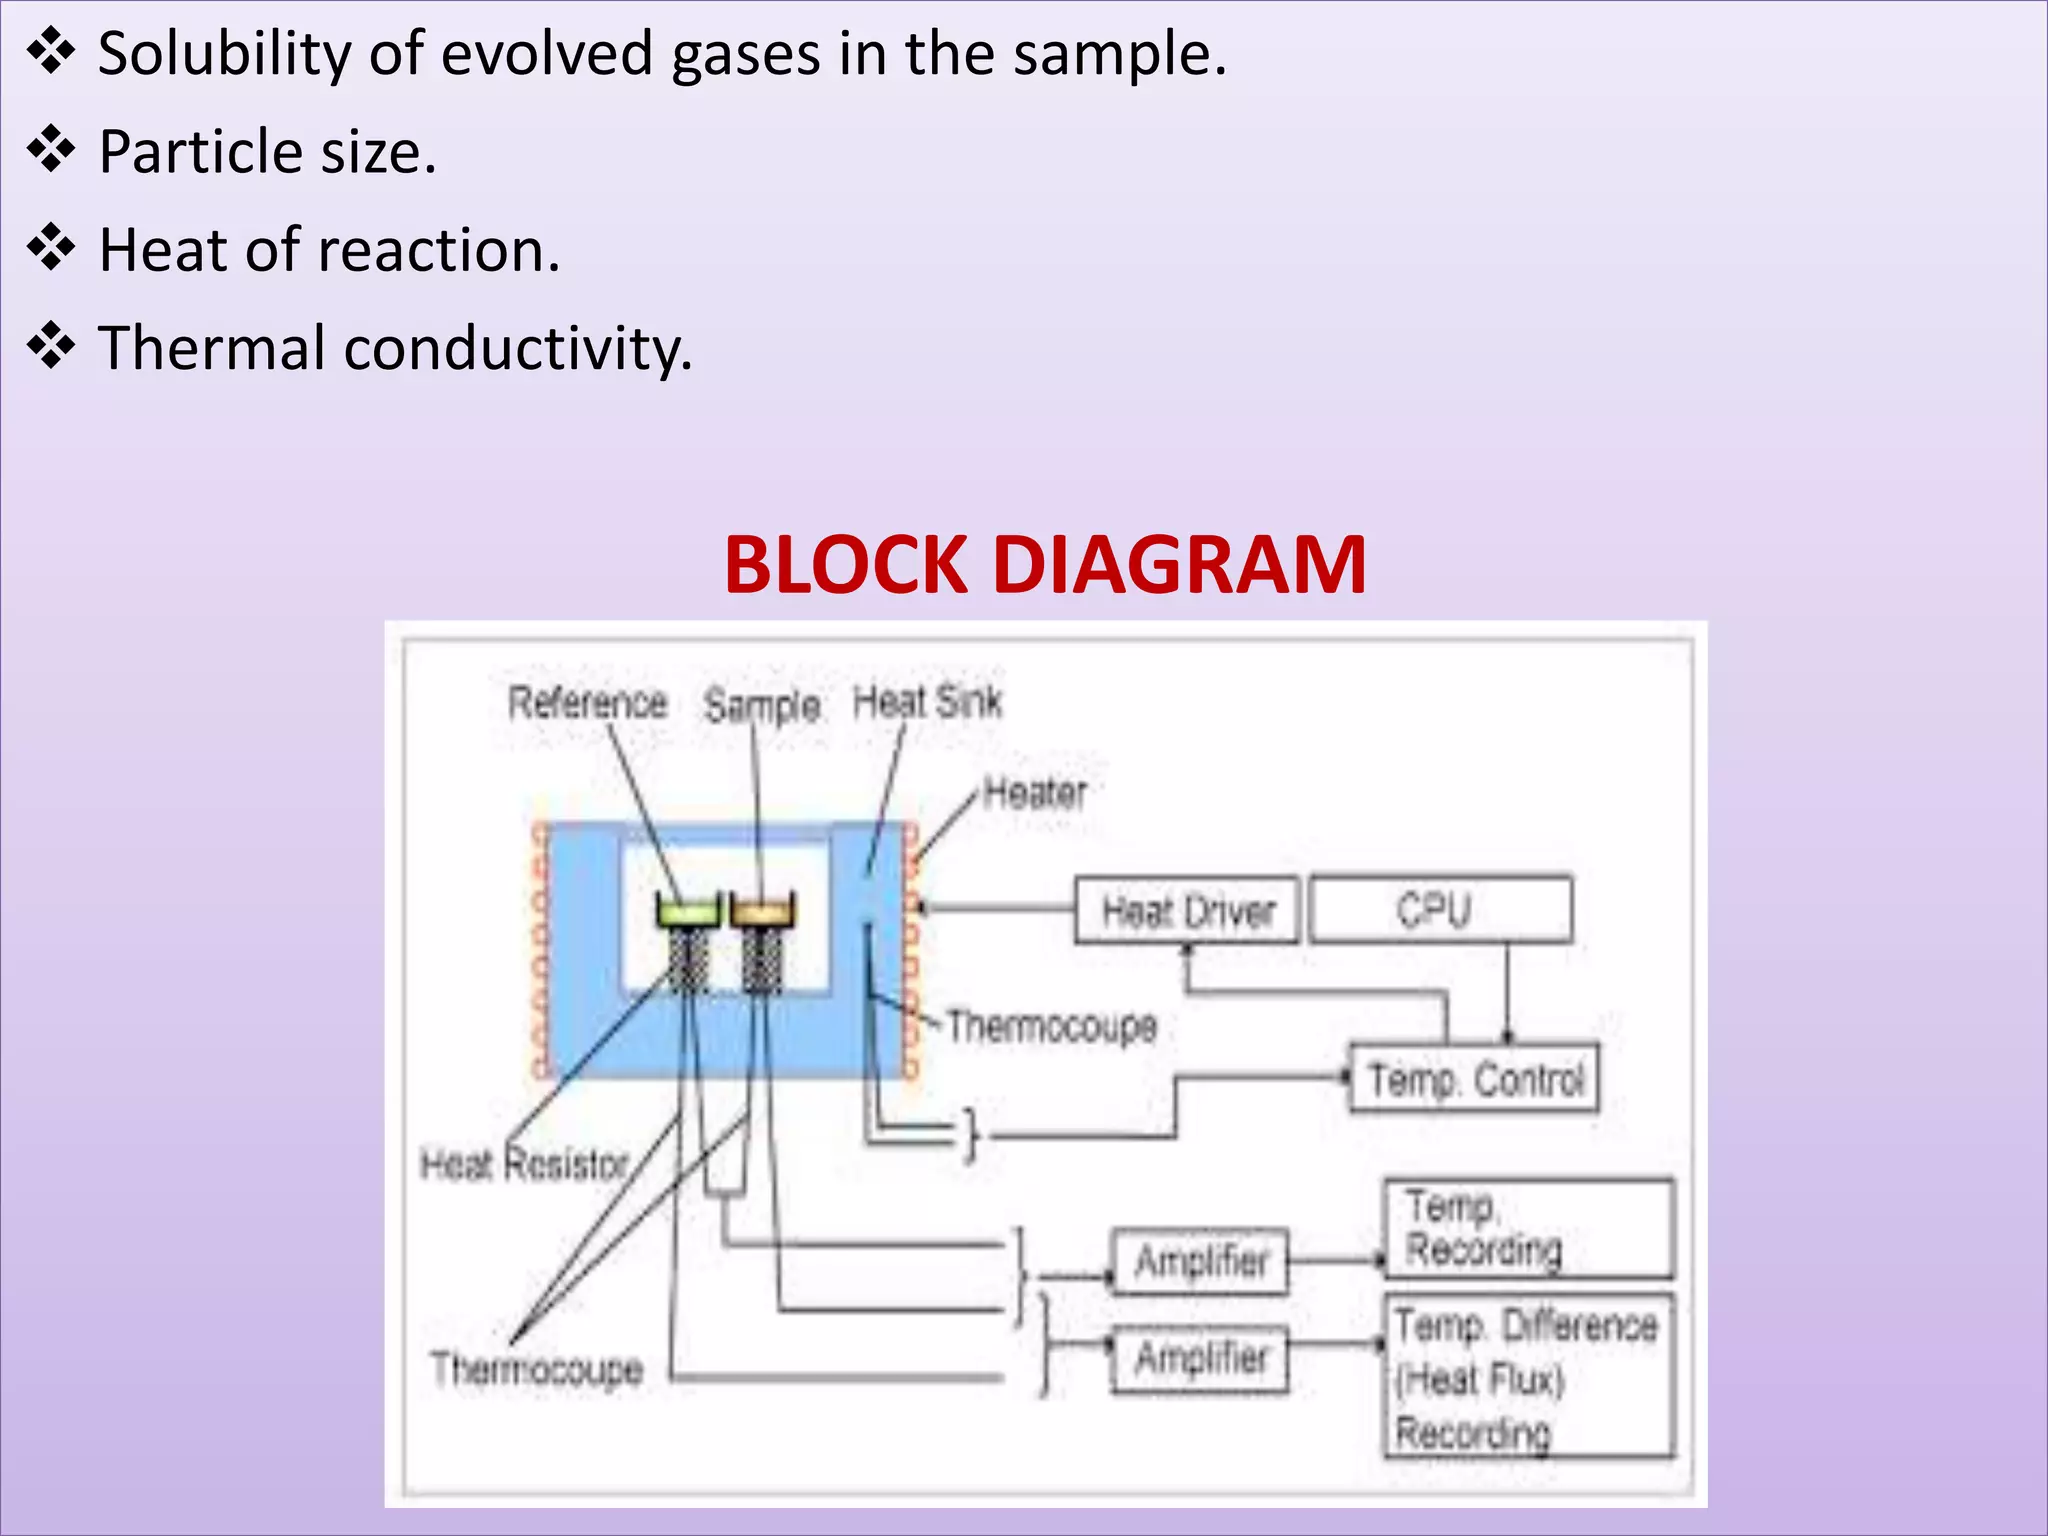
Differential Scanning Calorimetry
By
Department Of Chemistry
(Master Of Science)
Gautam Jha
Guided By
Prof. Dr.Medha Muralidhar
K.M Agrawal College
Of
Arts, Science & Commerce.
Introduction
 Differential Scanning Calorimetry, or DSC, is a thermoanalytical technique in which
the difference in the amount of heat required to increase the temperature of a
sample and reference is measured as a function of temperature.
 The technique was developed by E. S. Watson and M. J. O'Neill in 1962,and
introduced commercially at the 1963 Pittsburgh Conference on Analytical
Chemistry and Applied Spectroscopy.
 The first adiabatic differential scanning calorimeter that could be used in
biochemistry was developed by P. L. Privalov and D. R. Monaselidze in 1964 at
Institute of Physics in Tbilisi, Georgia.
Principles of DSC
 The Sample and Reference are maintained at the same temperature,
even during a thermal event in the sample.
 The energy required to maintain zero temperature difference
between the sample and the reference is measured.
 During a thermal event in the sample, the system will transfer heat to
or fro from the sample pan to maintain the same temperature in
reference and sample pans.
 DSC is a technique in which the difference in the amount of heat
required to heat the temperature of a sample and reference are
measured as function of temperature.
 Both the sample and reference are maintained at nearly the same
temperature throughout the experiment.
 A Differential Calorimeter measures the heats the sample relative to
a reference.
Comparison Of DTA & DSC
1. “DSC” stands for “Differential Scanning
Calorimetry”.
1. “DTA” stands for “Differential Thermal
Analysis.”
2. DSC is a technique in which the difference is
calculated between the amount of heat
needed (heat flow) to increase the
temperature of the sample and the heat
required to increase the temperature of the
reference.
2. DTA is a technique in which the difference is
calculated between the temperatures required
by the reference and the sample when the
heat flow is kept the same for both.
3. DSC is an instrument based on the DSC
technique used to measure heat released or
absorbed during the transition phase.
3. DTA is an instrument based on the DTA
technique.
Comparison Of DTA & DSC
Instrumentation Of DSC
• Two Basic types of DSC Instruments:
 Heat Flux DSC
Sample and reference holders:
• Al or Pt pans placed on constantan disc
• Sample and reference holders are
by a low-resistance heat flow path.
Sensors:
• Chromel® (an alloy made of 90% nickel
and 0% chromium)-constantan area thermocouples (differential heat flow)
• Chromel®-alumel (an alloy consisting of approximately 95% nickel, 2% manganese,
2% aluminium and 1% silicon) thermocouples (sample temperature).
Thermocouple is a junction between two different metals that produces
a voltage due to a temperature difference.
Furnace:
• One block for both sample and reference cells.
Temperature Controller:
• The temperature difference between the sample and reference is
converted to differential thermal power, which is supplied to the heaters
to maintain the temperature of the sample and reference at the
program value.
 Power Compensation DSC:
Sample Holder:
 Aluminum or Platinum Pans.
Sensors:
• Platinum resistance thermocouples
• Separate sensors and heaters for
the sample and reference.
• Furnace:
Separate blocks for sample and reference cells.
• Temperature controller:
Supply the differential thermal power to the heaters to maintain the
temperature of the sample and reference at the program value.
The main application of DSC is in studying
phase transitions, such as melting, glass transitions, or exothermic
decompositions. These transitions involve energy changes or heat
capacity changes that can be detected by DSC with great sensitivity.
Nature of DSC Curves
• The result of a DSC experiment is a curve of heat flux versus temperature or versus
time. There are two different conventions: exothermic reactions in the sample
shown with a positive or negative peak, depending on the kind of technology used
in the experiment.
• This curve can be used to calculate enthalpies of transitions, which is done by
integrating the peak corresponding to a given transition. The enthalpy of transition
can be expressed using equation:
ΔH = KA
• Where ΔH is the enthalpy of transition
• K is the calorimetric constant,
• A is the area under the peak
• The calorimetric constant varies from instrument to instrument, and can be
determined by analyzing a well-characterized material of known enthalpies of
transition.
• Area under the peak is directly proportional to heat absorbed or evolved by the
reaction,
• Height of the peak is directly proportional to rate of the reaction.
A schematic DSC curve of amount of energy input (y)
required to maintain each temperature (x), scanned across
a range of temperatures. Bottom: Normalized curves setting
the initial heat capacity as the reference. Buffer-buffer
baseline (dashed) and protein-buffer variance (solid).
Factors Affecting Curves
• Two types of factors effect the DSC curve:
1.Instrumental factors:
 Furnace heating rate.
 Recording or chart speed.
 Furnace atmosphere.
 Geometry of sample holder/location of sensors.
 Sensitivity of the recoding system.
 Composition of sample containers.
2. Sample Characteristics:
 Amount of sample
 Nature of sample
 Sample packing
 Solubility of evolved gases in the sample.
 Particle size.
 Heat of reaction.
 Thermal conductivity.
BLOCK DIAGRAM
References & Sources
1. Molecular biology (in Russian). 6. Moscow. 1975. pp. 7–33.
2. Wunderlich, B. (1990). Thermal Analysis. New York: Academic Press.
pp. 137–140.
3. Dean, John A. (1995). The Analytical Chemistry Handbook. New
York: McGraw Hill, Inc. pp. 15.1–15.5
4. B. Wunderlich, Macromolecular Physics, (1980), Vol. 3, Ch. 8, Table
VIII.6.
5. Brydson, J. A., Plastics Materials, Butterworth-Heinemann, 7th Ed
(1999).
6. Ezrin, Meyer, Plastics Failure Guide: Cause and Prevention, Hanser-
SPE (1996).
7. Wright, D. C., Environmental Stress Cracking of Plastics RAPRA
(2001).

Differential Scanning Colorimetry

  • 1.
    Differential Scanning Calorimetry By DepartmentOf Chemistry (Master Of Science) Gautam Jha Guided By Prof. Dr.Medha Muralidhar K.M Agrawal College Of Arts, Science & Commerce.
  • 2.
    Introduction  Differential ScanningCalorimetry, or DSC, is a thermoanalytical technique in which the difference in the amount of heat required to increase the temperature of a sample and reference is measured as a function of temperature.  The technique was developed by E. S. Watson and M. J. O'Neill in 1962,and introduced commercially at the 1963 Pittsburgh Conference on Analytical Chemistry and Applied Spectroscopy.  The first adiabatic differential scanning calorimeter that could be used in biochemistry was developed by P. L. Privalov and D. R. Monaselidze in 1964 at Institute of Physics in Tbilisi, Georgia.
  • 3.
    Principles of DSC The Sample and Reference are maintained at the same temperature, even during a thermal event in the sample.  The energy required to maintain zero temperature difference between the sample and the reference is measured.  During a thermal event in the sample, the system will transfer heat to or fro from the sample pan to maintain the same temperature in reference and sample pans.  DSC is a technique in which the difference in the amount of heat required to heat the temperature of a sample and reference are measured as function of temperature.  Both the sample and reference are maintained at nearly the same temperature throughout the experiment.  A Differential Calorimeter measures the heats the sample relative to a reference.
  • 4.
    Comparison Of DTA& DSC 1. “DSC” stands for “Differential Scanning Calorimetry”. 1. “DTA” stands for “Differential Thermal Analysis.” 2. DSC is a technique in which the difference is calculated between the amount of heat needed (heat flow) to increase the temperature of the sample and the heat required to increase the temperature of the reference. 2. DTA is a technique in which the difference is calculated between the temperatures required by the reference and the sample when the heat flow is kept the same for both. 3. DSC is an instrument based on the DSC technique used to measure heat released or absorbed during the transition phase. 3. DTA is an instrument based on the DTA technique.
  • 5.
  • 6.
    Instrumentation Of DSC •Two Basic types of DSC Instruments:  Heat Flux DSC Sample and reference holders: • Al or Pt pans placed on constantan disc • Sample and reference holders are by a low-resistance heat flow path. Sensors: • Chromel® (an alloy made of 90% nickel and 0% chromium)-constantan area thermocouples (differential heat flow) • Chromel®-alumel (an alloy consisting of approximately 95% nickel, 2% manganese, 2% aluminium and 1% silicon) thermocouples (sample temperature). Thermocouple is a junction between two different metals that produces a voltage due to a temperature difference.
  • 7.
    Furnace: • One blockfor both sample and reference cells. Temperature Controller: • The temperature difference between the sample and reference is converted to differential thermal power, which is supplied to the heaters to maintain the temperature of the sample and reference at the program value.  Power Compensation DSC: Sample Holder:  Aluminum or Platinum Pans. Sensors: • Platinum resistance thermocouples • Separate sensors and heaters for the sample and reference.
  • 8.
    • Furnace: Separate blocksfor sample and reference cells. • Temperature controller: Supply the differential thermal power to the heaters to maintain the temperature of the sample and reference at the program value. The main application of DSC is in studying phase transitions, such as melting, glass transitions, or exothermic decompositions. These transitions involve energy changes or heat capacity changes that can be detected by DSC with great sensitivity.
  • 9.
    Nature of DSCCurves • The result of a DSC experiment is a curve of heat flux versus temperature or versus time. There are two different conventions: exothermic reactions in the sample shown with a positive or negative peak, depending on the kind of technology used in the experiment. • This curve can be used to calculate enthalpies of transitions, which is done by integrating the peak corresponding to a given transition. The enthalpy of transition can be expressed using equation: ΔH = KA • Where ΔH is the enthalpy of transition • K is the calorimetric constant, • A is the area under the peak • The calorimetric constant varies from instrument to instrument, and can be determined by analyzing a well-characterized material of known enthalpies of transition. • Area under the peak is directly proportional to heat absorbed or evolved by the reaction, • Height of the peak is directly proportional to rate of the reaction.
  • 10.
    A schematic DSCcurve of amount of energy input (y) required to maintain each temperature (x), scanned across a range of temperatures. Bottom: Normalized curves setting the initial heat capacity as the reference. Buffer-buffer baseline (dashed) and protein-buffer variance (solid).
  • 11.
    Factors Affecting Curves •Two types of factors effect the DSC curve: 1.Instrumental factors:  Furnace heating rate.  Recording or chart speed.  Furnace atmosphere.  Geometry of sample holder/location of sensors.  Sensitivity of the recoding system.  Composition of sample containers. 2. Sample Characteristics:  Amount of sample  Nature of sample  Sample packing
  • 12.
     Solubility ofevolved gases in the sample.  Particle size.  Heat of reaction.  Thermal conductivity. BLOCK DIAGRAM
  • 13.
    References & Sources 1.Molecular biology (in Russian). 6. Moscow. 1975. pp. 7–33. 2. Wunderlich, B. (1990). Thermal Analysis. New York: Academic Press. pp. 137–140. 3. Dean, John A. (1995). The Analytical Chemistry Handbook. New York: McGraw Hill, Inc. pp. 15.1–15.5 4. B. Wunderlich, Macromolecular Physics, (1980), Vol. 3, Ch. 8, Table VIII.6. 5. Brydson, J. A., Plastics Materials, Butterworth-Heinemann, 7th Ed (1999). 6. Ezrin, Meyer, Plastics Failure Guide: Cause and Prevention, Hanser- SPE (1996). 7. Wright, D. C., Environmental Stress Cracking of Plastics RAPRA (2001).