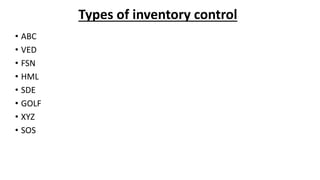
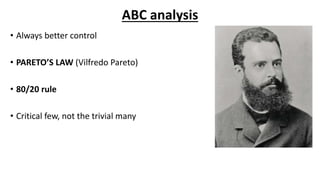
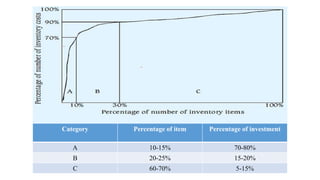
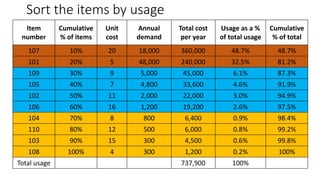
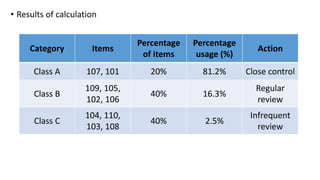
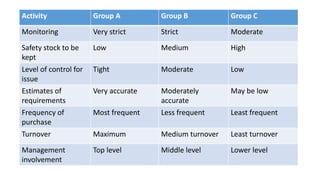
The document discusses inventory management principles including definitions, objectives, costs, and models. It summarizes key concepts like ABC analysis which categorizes inventory items into A, B, and C groups based on their value and usage. Group A items account for 20% of items but 80% of cost, requiring close control, while Group C items are less important with loose control. The document also covers economic order quantity and interval models to determine optimal reorder amounts and times.
Material management is a scientific technique, concerned with Planning, Organizing & Control of flow of materials, from their initial purchase to destination.
Inventory generally refers to the materials in stock. It is also called the idle resource of an enterprise. Inventories represent those items, which are either stocked for sale or they are in the process of manufacturing or they are in the form of materials, which are yet to be utilized.
The slides contains information on Production Management according to the UHS content of Pharmaceutical Marketing and Management. It would be helpful for Pharm.D students to cover their syllabus content.
It contains detailed information on:
Material Management
Planning of Production
Batch Record Maintenance by WHO
Tools of Inventory Control
Good Manufacturing Practices under Drug Act
5P's of Production Management
Objective of Production Management
Rules and Regulations of PM
Elements of Production Management
Defination : Inventories constitute an important component of a firms working capital .The various features of inventory are inventory as current asssets ,level of liquidity and liquidity lags .
Purpose : The purpose of holding inventoryis to achieve efficiency through cost reduction, increased sales volume ,to avail quantity discounts ,reduce risk of production stoppages ,reducing ordering costs and time .
Inventory Management techniques : 2 types :
1. Economic order quantity : it is the order quantity that minimisesthe total cost associated with inventory management .
2. 2. ABC system : A – items of high value but small in number
B – items of moderate value and size require reasonable attention
C - items of smaller value
It is concerned with planning, organizing and controlling the flow of materials from their initial purchase through internal operations to the service point through distribution.
OR
Material management is a scientific technique, concerned with Planning, Organizing &Control of flow of materials, from their initial purchase to destination
Problem statement of Hypertension. Measurement of blood pressure. Recent diagnostic criteria and management guidelines. Prevention of Hypertension. National Programme for Prevention and Control of Cancer, Diabetes,Cardiovascular Diseases and Stroke
CRISPR-Cas9, a revolutionary gene-editing tool, holds immense potential to reshape medicine, agriculture, and our understanding of life. But like any powerful tool, it comes with ethical considerations.
Unveiling CRISPR: This naturally occurring bacterial defense system (crRNA & Cas9 protein) fights viruses. Scientists repurposed it for precise gene editing (correction, deletion, insertion) by targeting specific DNA sequences.
The Promise: CRISPR offers exciting possibilities:
Gene Therapy: Correcting genetic diseases like cystic fibrosis.
Agriculture: Engineering crops resistant to pests and harsh environments.
Research: Studying gene function to unlock new knowledge.
The Peril: Ethical concerns demand attention:
Off-target Effects: Unintended DNA edits can have unforeseen consequences.
Eugenics: Misusing CRISPR for designer babies raises social and ethical questions.
Equity: High costs could limit access to this potentially life-saving technology.
The Path Forward: Responsible development is crucial:
International Collaboration: Clear guidelines are needed for research and human trials.
Public Education: Open discussions ensure informed decisions about CRISPR.
Prioritize Safety and Ethics: Safety and ethical principles must be paramount.
CRISPR offers a powerful tool for a better future, but responsible development and addressing ethical concerns are essential. By prioritizing safety, fostering open dialogue, and ensuring equitable access, we can harness CRISPR's power for the benefit of all. (2998 characters)
How many patients does case series should have In comparison to case reports.pdfpubrica101
Pubrica’s team of researchers and writers create scientific and medical research articles, which may be important resources for authors and practitioners. Pubrica medical writers assist you in creating and revising the introduction by alerting the reader to gaps in the chosen study subject. Our professionals understand the order in which the hypothesis topic is followed by the broad subject, the issue, and the backdrop.
https://pubrica.com/academy/case-study-or-series/how-many-patients-does-case-series-should-have-in-comparison-to-case-reports/
CHAPTER 1 SEMESTER V PREVENTIVE-PEDIATRICS.pdfSachin Sharma
This content provides an overview of preventive pediatrics. It defines preventive pediatrics as preventing disease and promoting children's physical, mental, and social well-being to achieve positive health. It discusses antenatal, postnatal, and social preventive pediatrics. It also covers various child health programs like immunization, breastfeeding, ICDS, and the roles of organizations like WHO, UNICEF, and nurses in preventive pediatrics.
The dimensions of healthcare quality refer to various attributes or aspects that define the standard of healthcare services. These dimensions are used to evaluate, measure, and improve the quality of care provided to patients. A comprehensive understanding of these dimensions ensures that healthcare systems can address various aspects of patient care effectively and holistically. Dimensions of Healthcare Quality and Performance of care include the following; Appropriateness, Availability, Competence, Continuity, Effectiveness, Efficiency, Efficacy, Prevention, Respect and Care, Safety as well as Timeliness.
Medical Technology Tackles New Health Care Demand - Research Report - March 2...pchutichetpong
M Capital Group (“MCG”) predicts that with, against, despite, and even without the global pandemic, the medical technology (MedTech) industry shows signs of continuous healthy growth, driven by smaller, faster, and cheaper devices, growing demand for home-based applications, technological innovation, strategic acquisitions, investments, and SPAC listings. MCG predicts that this should reflects itself in annual growth of over 6%, well beyond 2028.
According to Chris Mouchabhani, Managing Partner at M Capital Group, “Despite all economic scenarios that one may consider, beyond overall economic shocks, medical technology should remain one of the most promising and robust sectors over the short to medium term and well beyond 2028.”
There is a movement towards home-based care for the elderly, next generation scanning and MRI devices, wearable technology, artificial intelligence incorporation, and online connectivity. Experts also see a focus on predictive, preventive, personalized, participatory, and precision medicine, with rising levels of integration of home care and technological innovation.
The average cost of treatment has been rising across the board, creating additional financial burdens to governments, healthcare providers and insurance companies. According to MCG, cost-per-inpatient-stay in the United States alone rose on average annually by over 13% between 2014 to 2021, leading MedTech to focus research efforts on optimized medical equipment at lower price points, whilst emphasizing portability and ease of use. Namely, 46% of the 1,008 medical technology companies in the 2021 MedTech Innovator (“MTI”) database are focusing on prevention, wellness, detection, or diagnosis, signaling a clear push for preventive care to also tackle costs.
In addition, there has also been a lasting impact on consumer and medical demand for home care, supported by the pandemic. Lockdowns, closure of care facilities, and healthcare systems subjected to capacity pressure, accelerated demand away from traditional inpatient care. Now, outpatient care solutions are driving industry production, with nearly 70% of recent diagnostics start-up companies producing products in areas such as ambulatory clinics, at-home care, and self-administered diagnostics.
Leading the Way in Nephrology: Dr. David Greene's Work with Stem Cells for Ki...Dr. David Greene Arizona
As we watch Dr. Greene's continued efforts and research in Arizona, it's clear that stem cell therapy holds a promising key to unlocking new doors in the treatment of kidney disease. With each study and trial, we step closer to a world where kidney disease is no longer a life sentence but a treatable condition, thanks to pioneers like Dr. David Greene.
One of the most developed cities of India, the city of Chennai is the capital of Tamilnadu and many people from different parts of India come here to earn their bread and butter. Being a metropolitan, the city is filled with towering building and beaches but the sad part as with almost every Indian city
Telehealth Psychology Building Trust with Clients.pptxThe Harvest Clinic
Telehealth psychology is a digital approach that offers psychological services and mental health care to clients remotely, using technologies like video conferencing, phone calls, text messaging, and mobile apps for communication.
Empowering ACOs: Leveraging Quality Management Tools for MIPS and BeyondHealth Catalyst
Join us as we delve into the crucial realm of quality reporting for MSSP (Medicare Shared Savings Program) Accountable Care Organizations (ACOs).
In this session, we will explore how a robust quality management solution can empower your organization to meet regulatory requirements and improve processes for MIPS reporting and internal quality programs. Learn how our MeasureAble application enables compliance and fosters continuous improvement.
ICH Guidelines for Pharmacovigilance.pdfNEHA GUPTA
The "ICH Guidelines for Pharmacovigilance" PDF provides a comprehensive overview of the International Council for Harmonisation of Technical Requirements for Pharmaceuticals for Human Use (ICH) guidelines related to pharmacovigilance. These guidelines aim to ensure that drugs are safe and effective for patients by monitoring and assessing adverse effects, ensuring proper reporting systems, and improving risk management practices. The document is essential for professionals in the pharmaceutical industry, regulatory authorities, and healthcare providers, offering detailed procedures and standards for pharmacovigilance activities to enhance drug safety and protect public health.
The Importance of Community Nursing Care.pdfAD Healthcare
NDIS and Community 24/7 Nursing Care is a specific type of support that may be provided under the NDIS for individuals with complex medical needs who require ongoing nursing care in a community setting, such as their home or a supported accommodation facility.
2. Definition
• Usable but idle resource having an
economic value
• Can also be described in financial terms as
the sum total value of raw materials; semi
processed and finished goods at any given
time
• Stock: Tangible items such as materials
3. Inventory control:
• Method of maintaining a stock at a level at which the purchasing and stocking
costs are the lowest possible without interference with the supply
• It is one of the modern management techniques of operations research
Why we need
inventory
management
• To have material in hand when needed
• To minimise inventory investment
• Consistency of quality
• To operate efficiently
4. Aims and Objectives:
• Maintain availability of materials
• Minimise the ineffective stock
• Optimise the various costs associated with inventories
• To meet the health care requirement timely, effectively, efficiently, smoothly and
satisfactorily.
• To gain economy of purchase in lots.
• To reduce loss due to changes in prices of inventory items.
5. Basic principles of inventory management
• Definition of the context
• Determination of the types of stock records and inventory reports needed
• Selection of items
• Maintenance of appropriate service levels
• Determining when to reorder
• Determining how much to reorder
• Identification and control of inventory management costs
7. Purchase Cost
• Actual cost of the materials whether it is drugs, chemicals, linen or other stores
• The aim is to reduce this cost without compromising with the quality of supplies (drugs)
• The effort should be to reduce this as much as possible by following the simple
techniques like
• Bulk-buying
• Buying under generic names and not trade names
• Negotiated rates by assuring future business over a reasonable period
8. a ) Cost of money
b) Cost of space
c) Cost of additional manpower
d) Cost of obsolescence
e) Cost of deterioration
f) Cost of pilferage
Carrying cost
9. Ordering Cost
• It is the cost of placing an order, like cost involved in stationery, postage, telephone,
fax, manpower etc.
• This apparently is simple but can assume higher proportions because of the costs on
manpower.
Shortage Cost
• It deals with the cost of not having a particular material.
• The direct cost is the higher price we pay for procuring a substitute from an alternate
source.
• The indirect costs in this element are related to the business that we loose, and public
criticism etc.
10. • Context of an inventory management system. Two factors:
• Independent versus dependent
• Independent demand system: management of procurement and distribution of
finished goods
• Dependent demand systems: manage inventory requirements for raw
materials and supplies based on what is needed for production in a
manufacturing or repackaging operation
• Pull system or push system
• Pull system: operating units order medicines from a warehouse or supplier
according to local determination of need
• Push system: a central authority orders medicines from suppliers and
determines the quantities that will be shipped to the operating unit
11. Stock records
Primary source of information used in various reordering formulas
Source of data used to compile performance reports
Manual or computerized
• Vertical file card
• Kardex system
• Bin cards
• Ledger system
13. Lead Time :-
• Length of time in between the decision to replenish an item, and its actual addition to the
stock.
Identification of
need
Supplier Receipt of item
Internal lead time External lead time
Lead time
14. Service level and safety stock
• Safety stock:
The minimum safety stock needed to avoid a stockout is the quantity
of stock used on average during the average lead time from the
supplier
Safety stock = Lead time x Average consumption
• Service level:
Percentage of individual items ordered which can be fulfilled from
stock on hand
Service level = (No. of items issued No. of items requested) x 100
16. Inventory control models and reorder frequency
Qo = Quantity ordered , SS = Safety stock
I (average inventory) = SS + Qo
17. Most common inventory control models:
• Annual purchasing
• Scheduled purchasing
• Perpetual purchasing
• Draw-downs from framework contracts
18. • Advantages:
• Single procurement is easier to manage
• Prices per unit are lower when large volume purchases are made
• Greater purchase volumes result in lower prices and can be accompanied by
staggered deliveries to facilitate storage and distribution mangement
19. • Disadvantages:
• Actual consumption is different from the annual forecast
• Average stock levels and inventory-holding costs are higher
• Local suppliers that win annual tender contracts may find coping huge, single
deliveries difficult
• More storage space is required, unless deliveries from suppliers can be spaced
throughout the year
• Necessary funds may be difficult to obtain
• Workload in the procurement office and main receiving points is uneven
20. Scheduled purchasing
• Advantages:
• Estimated quantity rather than fixed quantity contract can be supported
• Preferable to local suppliers
• Inventory holding costs are less
• Less space is needed
• Items with variable demand can be purchased more frequently in smaller lots
• Procurement unit can respond more rapidly to programme needs
• Supports pooled procurement systems, where orders from all partners are joined and placed as
a single order
• Procurement and port clearing workload is fairly evenly spread over the year
21. • Disadvantages:
• When orders are placed late in the fiscal year, the purchasing cycle will not be
complete before the end of the year. This schedule may result in a conflict with
regulations regarding spending time limits
• Shortages caused by poor forecasting or changes in demand may occur with scheduled
review periods three to six months apart
22. Perpetual purchasing
• Perpetual inventory record is maintained for each item
• Inventory position (stock on hand and on order) is reviewed on a regular basis (at least
weekly)
• Whenever stock position falls below a designated reorder point, an order is initiated
Advantages:
• Safety stock and average inventories are much lower
• Ability to rapidly respond to sudden changes in consumption
• Useful where lead time is very less, one or two days. E.g. developed countries
23. • Disadvantages:
• Not suitable for developing countries because of governmental regulations and
difficulty in employing suitable primary distributors
• If lead times are less (one month or less), difficult to use without maintain large safety
stocks
• If supply system cannot maintain current and accurate stock records, because by the
time transactions are posted, vital items may be out of stock
• Frequent purchasing will drive up incremental purchasing costs and total purchasing
costs
• Difficult to fit into public health objectives and budgetary limits, because all the small
purchases must be tracked for compliance with guidelines
25. Drawing down from framework contracts
• Establishes the essential terms and conditions of the procurement
agreement such as time frame, product specifications, prices, quantitates
and conditions of supplier performance
• During the framework contract term, the supplier holds the stock until it
receives orders for specific purchases
• Each order itself is a separate contract that follows the broad framework
terms with specific terms added such as delivery date
26. Factors to consider in calculating reorder quantity
• Average consumption
• Lead time
• Safety stock
• Reorder level
• Maximum stock level
• Stock position
• Procurement period
• Projecting demand
• Projective
• Causal
• Judgemental
• Morbidity
27. Components of the observed demand pattern
• Base rate
• Trend
• Seasonality
• Cyclic demand
• Random noise
28. Standard reordering formula
1. Minimum and maximum stock level formula
SMIN = (LT x CA) + SS
SMAX = SMIN + (PP x CA)
QO (order quantity) = (SMAX + SB) – (S1 + SO)
• Average monthly consumption - (CA)
• Supplier lead time - (LT)
• Procurement period – (PP)
• Safety stock – (SS)
• Stock on hand in inventory - (S1)
• Stock now on order from a supplier but not yet received - (S0)
• Quantity of stock back-ordered to lower levels (SB)
29. • Lead time for tetracycline capsules is 2 months, the average monthly consumption is
1000 capsules and the additional safety stock allocated is 2000 capsules. Suppose
procurement period is 6 months, 3,000 tetracycline capsules are in stock and another
2000 are on order.
• SMIN = (2 X 1,000) + 2,000 = 4,000
• SMAX = 4,000 + (6 x 1,000) = 10,000 capsules
• Q0 = (10,000 + 0) – (3,000 + 2,000) = 5,000 capsules
30. 2. Consumption based reordering formula
QO = CA x (LT + PP) + SS + SB – (S1 + So)
CA = Average monthly consumption, adjusted for stockouts
LT = supplier lead time
PP = procurement period, time until next order will be placed
SS = safety stock
S1 = stock in inventory
SO = quantity of stock now on order from a supplier but not yet
received
SB = quantity back ordered to lower level
31. • E.g. No tetracycline capsules are in stock, and 2.00 are back-ordered to lower
level facilities at the time scheduled for reordering. One order is outstanding
to the supplier for 3,000 capsules. The lead time for this supplier id 2
months, the average monthly consumption is 1,000 capsules, the safety
stock calculated as 2,000 capsules and the procurement period is 6 months.
• Qo = 1000 x (2+6) + 2,000 + 2,000 – (0 + 3,000) = 9,000
32. Mathematical models for reordering
• Economic order quantity
• Economic order interval
• Exponential smoothing
33. Economic order quantity
• One of the oldest classical method, more than 50 years old
• Technique of reordering materials whenever stock reaches the reorder point
• The point at which ordering cost and carrying cost balance out is the one in which total
operating costs (working capital) are minimum
Assumptions:
• Lead time is constant
• Consumption pattern is predictable
• Orders are received instantaneously
• Stockouts are not permitted
34. • Economic order quantity = 2*Q*C1
P*C2
Q= annual consumption ( in units )
C1= replenishment or procurement
cost per order
P= purchase cost per bottle (unit)
C2= Inventory carrying cost per
item
35. Economic order interval
• Ideal interval for spacing orders placed for the EOQ.
• ECONOMIC ORDER INTERVAL= 2*C1
Q*P*C2
Q= annual consumption ( in units )
C1= replenishment or procurement
cost per order
P= purchase cost per bottle (unit)
C2= Inventory carrying cost per
item
36. E.g. The district health office purchases a wide variety of life saving drugs out of which quite a few
have limited shelf life. One of the drugs which cost Rs.35/bottle is required at an average rate of 50
bottles a month by the different PHCs which are serviced from this office. The cost to replenish the
stock of an item per unit is Rs.50/order and the purchase price Rs.35/bottle respectively. The
inventory carrying cost as calculated is 30%. What should be the economic order quantity and
economic order interval of the drug?
• Q= 50 X 12= 600 units per year
• C1= Rs. 50
• P= Rs. 35
• C2= 30% (0.3)
• EOQ= 2*Q*C1 = 2*600*50 = 60000 = 5714 = 75.4
P*C2 35*0.3 10.5
• ECONOMIC ORDER QUANTITY = 75 BOTTLES
39. Types of inventory control
• ABC
• VED
• FSN
• HML
• SDE
• GOLF
• XYZ
• SOS
40. ABC analysis
• Always better control
• PARETO’S LAW (Vilfredo Pareto)
• 80/20 rule
• Critical few, not the trivial many
41. Category Percentage of item Percentage of investment
A 10-15% 70-80%
B 20-25% 15-20%
C 60-70% 5-15%
42. Item number Unit cost
Annual
demand (units)
Total cost per
year
Usage as a % of total
usage
101 5 48,000 240,000 32.5%
102 11 2,000 22,000 3%
103 15 300 4,500 0.6%
104 8 800 6,400 0.9%
105 7 4,800 33,600 4.6%
106 16 1,200 19,200 2.6%
107 20 18,000 360,000 48.8%
108 4 300 1,200 0.2%
109 9 5,000 45,000 6.1%
110 12 500 6,000 0.8%
Total usage 737,900 100%
Calculate the total spending per year
43. Sort the items by usage
Item
number
Cumulative
% of items
Unit
cost
Annual
demand
Total cost
per year
Usage as a %
of total usage
Cumulative
% of total
107 10% 20 18,000 360,000 48.8% 48.8%
101 20% 5 48,000 240,000 32.5% 81.3%
109 30% 9 5,000 45,000 6.1% 87.4%
105 40% 7 4,800 33,600 4.6% 92%
102 50% 11 2,000 22,000 3.0% 94.9%
106 60% 16 1,200 19,200 2.6% 97.5%
104 70% 8 800 6,400 0.9% 98.4%
110 80% 12 500 6,000 0.8% 99.2%
103 90% 15 300 4,500 0.6% 99.8%
108 100% 4 300 1,200 0.2% 100%
Total usage 737,900 100%
44. Sort the items by usage
Item
number
Cumulative
% of items
Unit
cost
Annual
demand
Total cost
per year
Usage as a %
of total usage
Cumulative
% of total
107 10% 20 18,000 360,000 48.7% 48.7%
101 20% 5 48,000 240,000 32.5% 81.2%
109 30% 9 5,000 45,000 6.1% 87.3%
105 40% 7 4,800 33,600 4.6% 91.9%
102 50% 11 2,000 22,000 3.0% 94.9%
106 60% 16 1,200 19,200 2.6% 97.5%
104 70% 8 800 6,400 0.9% 98.4%
110 80% 12 500 6,000 0.8% 99.2%
103 90% 15 300 4,500 0.6% 99.8%
108 100% 4 300 1,200 0.2% 100%
Total usage 737,900 100%
45. • Results of calculation
Category Items
Percentage
of items
Percentage
usage (%)
Action
Class A 107, 101 20% 81.2% Close control
Class B
109, 105,
102, 106
40% 16.3%
Regular
review
Class C
104, 110,
103, 108
40% 2.5%
Infrequent
review
46. Activity Group A Group B Group C
Monitoring Very strict Strict Moderate
Safety stock to be
kept
Low Medium High
Level of control for
issue
Tight Moderate Low
Estimates of
requirements
Very accurate Moderately
accurate
May be low
Frequency of
purchase
Most frequent Less frequent Least frequent
Turnover Maximum Medium turnover Least turnover
Management
involvement
Top level Middle level Lower level
47. VED Analysis
• VED analysis is based on critical values and shortage costs of the Item. Based on the
criticality, the items could be classified into three categories:
• Vital (10%),
• Essential (39%)
• Desirable (51%)
48. VED ANALYSIS-CATEGORIZATION PLAN
FACTOR FIRST DEGREE SECOND DEGREE THIRD DEGREE
1. Stock out cost Below Rs. X
(30)
Between Rs. X & Y
(60)
Above Y (90)
2. Lead time for
procurement
1-4 weeks (30) 4-8 weeks (60) Over 8 weeks
(90)
3. Nature of
items
Produced to commercial
std. or off the shelf (20)
Produced to
suppliers design (40)
Produced to buyers
design or proprietary
items (60)
4. Source of
supply
Availability Local ( 20 ) Outstation ( 40 ) Imported supply (60)
50. ABC &VED MATRIX: CRTICALITY Vs COST
V E D
A AV AE AD Cat I
15 %
B BV BE BD
Cat II
40 %
C CV CE CD
Cat III
45 %
51. • Category I: includes all vital and expensive items, Requires close
monitoring and strict control.
• Category II: covers item of essential category and they are less expensive.
• Category III: comprises the desirable and cheaper group of items.
Control of Items by A-B-C and V-E-D Combination
52. FSN analysis
• Based on the consumption figure of items.
• F ( fast moving )
• S ( slow moving )
• N ( non moving )
• To conduct this analysis the last date of receipt or the last date of issue
whichever is later taken into account and the period, usually in terms of no.
of months, that has elapsed since the last movement is recorded.
53. Importance of FSN analysis
• It helps to identify:
• active items which require to be reviewed regularly
• surplus items whose stocks are higher than their rate of consumption
• non moving items which are not being consumed
54. Other types of inventory control
• HML -
• High, Medium, Low
• Based on unit price
• SDE - Scarce, Difficult, Easy to obtain
• Based on purchasing terms with respect to availability
• GOLF – Government, Ordinary, Local and Foreign
• Based on source of supply from which material is procured
• XYZ – Based on the value of Inventory stored
• SOS - Seasonal, Off seasonal
• Based on seasonal requirements
Maintain availability of materials whenever and wherever requires in optimal quantity
Maintain availability of materials
Minimise the ineffective stock
Optimise the various costs associated with inventories
To meet unforeseen future demand due to variation in forecast figures and actual figures.
To average out demand fluctuations due to seasonal or cyclic variations.
To meet the customer requirement timely, effectively, efficiently, smoothly and satisfactorily.
To smoothen the production process.
To facilitate intermittent production of several products on the same facility.
To gain economy of production or purchase in lots.
To reduce loss due to changes in prices of inventory items.
To meet the time lag for transportation of goods.
To meet the technological constraints of production/process.
To balance various costs of inventory such as order cost or set up cost and inventory carrying cost.
To balance the stock out cost/opportunity cost due to loss of sales against the costs of inventory.
To minimize losses due to deterioration, obsolescence, damage, pilferage etc.
To stabilize employment and improve lab our relations by inventory of human resources and machine efforts.
Seve
Definition of the context in which the inventory management system must function
Determination of the types of stock records and inventory reports needed
Selection of items to be stocked as standard items
Maintenance of appropriate service levels for different classes of items
Adoption of a decision rule or a model for determining when to reorder
Adoption of a decision rule or a model for determining how much to reorder
Identification and control of inventory management costs using product classification systems such as ABC analysis, VEN analysis
n basic issues must be carefully considered when an inventory management system is being initially designed or upgraded
The purchase cost is the direct cost of the material, which is inclusive of taxes and freight.
We can reduce this cost without compromising with the quality of the supplies. The techniques followed are bulk buying, rate contract, and combined buying, negotiating purchase prices by assuring long-term business.
The carrying cost which consists of costs incurred on money invested storage space, additional manpower, obsolescence, deterioration, breakage and pilferage is difficult to calculate.
It can be generally about 30% of the actual cost of inventory. To control this cost we have to strike a balance between purchase cost and carrying cost by procuring the items in optimum quantity, known as the economic order quantity (EOQ)
The shortage cost covers the loss of hospital revenue due to the non-availability of critical items other than the extra cost, which has to be paid to procure this item from an alternate source. To contain this cost it is advisable to have two to three suppliers of good reputation for all the critical and vital items.
The ordering costs both direct and indirect will go up with more frequent orders. The technique to control this cost is again by effecting economy in materials management
But there are some inherent problems, which are associated with bulk purchasing i.e. it may lead to huge stocks inventory, which in turn increases the 'carrying cost'.
Carrying Costs
This is hidden cost and not amenable to easy calculation. The cost of carrying an inventory can be large if one is not conscious of its implications.
a ) Cost of money:
When we purchase the drugs in bulk, we pay also large proportion of the drug budget at one time. Imagine if you were to borrow this money from a financier how much interest would accrue to the hospital. You can look at it in a different way also. An efficient stores manager instead of purchasing in bulk would divide it into small portions and stagger the supply at a quarterly/monthly interval and release the payment only for that small portion received.
b) Cost of space:
If the annual requirements of drugs were purchased in bulk, additional space/store rooms with fittings and furniture would be required. This would mean additional expenditure.
d) Cost of obsolescence:
Drugs also go out of fashion. If a drug's annual requirement in toto is purchased in bulk and right at the beginning of the year, there is every likelihood that a better/newer alternative arrives in the market. As and when it happens the ' demand or prescriptions for the old drug purchased in bulk will either cease or reduce considerably. Such dead stocks of medicines are a net loss to the hospital.
e) Cost of deterioration:
Drugs are sensitive and thermolabile items. When purchased in bulk they are likely to be stored for a very long period and get exposed to hot, humid and hostile weather and storage conditions. This may lead to disintegration, colour changes, growth of fungus in glucose-saline bottles etc. That is, we are not getting the right value for our investment.
The purchase cost and the carrying cost oppose each other. But there is a point/ quantity at which both are minimum/optimum. This quantity is known as economic order quantity (EOQ).
Pilferage is directly related to the level of stock/inventory of a drug. A large stock of a drug will result into more pilferage and vice versa.
Conservative estimates are that the carrying cost may be 25 per cent to 35 per cent of the actual inventory cost.
To reduce this cost one should buy in small quantity. But this may increase the purchase cost.
For example, you are suddenly told that oxygen is out of stock in the hospital. The functioning of the operation theatre and other sensitive areas of the hospital will be seriously disrupted. The patients will suffer and there will be a public criticism. Arrangements will have to be made to procure oxygen or for that matter another such vital drug, at a premium from market thereby, increasing the cost.
If tablets B complex, antacid or cough syrup is out of stock hardly anything will happen. Therefore, the shortage cost would vary according to the nature of an item.
Independent demand system are applicable to the management of procurement and distribution of finished goods.
Dependent demand systems manage inventory requirements for raw materials and supplies based on what is needed for production in a manufacturing or repackaging operation
Pull system: operating units order medicines from a warehouse or supplier according to local determination of need.
Push system: a central authority orders medicines from suppliers and determines the quantities that will be shipped to the operating unit, based on the annual distribution plan and on information transmitted to the warehouse about need at the operating unit
Vfc-file cards are stored vertically in alphabetical or numerical order in a card file or drawer
Kardex-file cards are stored in a visible-edge record-tray system, with names and stock numbers on the lower edge,overlapped to provide an index
Bc-file cards are physically kept with the stock. this system makes a visual check easy, serves as a reminder to keep records, and serves as a backup to records previously described. If a product have two different batches with two different batch numbers and expiry dates, two sets of bin cards should be maintained. However only one stock card containing information on both batches needs to be used.
Ls- records are kept on ledger heets in a bound or loose-leaf book.
Stock must be held for several reasons:
To ensure availability
To maintain confidence in the system
To reduce the unit cost of medicines
To avoid shortage costs
To minimise ordering costs
To minimise transport costs
To allow for fluctuations in demand
Stock must be held for several reasons:
To ensure availability
To maintain confidence in the system
To reduce the unit cost of medicines
To avoid shortage costs
To minimise ordering costs
To minimise transport costs
To allow for fluctuations in demand
The lead time consists of internal element (time elapsing between decision making and communication of the order) and external element (time elapsing between the receipt of order by the supplier and actual receipt of the material).
We can control internal lead time to an appreciable extent but have no control over the external lead time.
Service level: it measured by counting the total number of items issued and dividing by the total number of items requested. for e.g. 95 percent service level means these specific drug are in stock 95% of the time on an average. It twenty products are listed on a request and ten units of each product are requested, 200 items are on the order; if only 170 items are issued, the service level is 85%.
Safety stock: for e.g. if the average lead time is three months and the average monthly consumption is 1000 units, the minimum safety stock would be 3000 units.
Annual purchasing:
Disadvantages:
Actual consumption is different from the annual forecast, leading to shortages and surpluses; expensive emergency orders are required to cope with shortages and surplus stock may spoil or expire
Average stock levels and inventory-holding costs are higher
Local suppliers that win annual tender contracts may find coping huge, single deliveries difficult
More storage space is required, unless deliveries from suppliers can be spaced throughout the year
Necessary funds may be difficult to obtain
Workload in the procurement office and main receiving points is uneven
Advantages:
Estimated quantity rather than fixed quantity contract can be supported
Preferable to local suppliers because it allows then to spread their demand over the year
Inventory holding costs are less
Less space is needed in warehouses
Items with variable demand can be purchased more frequently in smaller lots, reducing overstocking and costly emergency orders
Procurement unit can respond more rapidly to programme needs and make better use of a limited pharmaceutical budget
Supports pooled procurement systems, where orders from all partners are joined and placed as a single order
Procurement and port clearing workload is fairly evenly spread over the year
They are most effective when consumption patterns are relatively stable
Safety stock and avg inventory are much lower.
It applied appropriately, it produces an even workload for procurement, warehousing and port clearing.
When the basic inventory control model has been established, the final question is how much should be ordered at each order interval
Average consumption: sometimes called the demand, the average consumption expected in the next purchasing cycle is the key variable that determines how much stock should be ordered. Future consumption is a great unknown of inventory management. However other factors are equally imp. Even if consumption is accurately predicted, stockouts will occur if the lead time is badly underestimated or if another factor is overlooked or miscalculated.
Lead time- it is the time between initiation of a purchase order and receipt at the warehouse from the selected supplier. If a distinct trend exists in that supplier’s performance, the average should be weighted toward recent performance with a moving average. However if the pattern fluctuates- for example, two months, six months, it is best to apply lead time analysis or calculate SD
Safety stock: It is the stock that should always be on hand to prevent stockouts. When lead times and consumption are predictable and stable, the reorder level does not necessarily include safety stock, however when consumption patterns and lead times are highly variable, additional safety will be needed.
Reorder level: the reorder level is the quantity of remaining stock that should trigger a reorder of the item. In the minimum-maximum ordering system, this level is called minimum stoxk level. The standard way to set the reorder level in a basic purchasing formula is to multiply the average lead time by the average consumed during the lead time. This stock may or may not be the same as the safety stock and in fact may include a separate quantity of stock as a safety stock.
Maximum stock level; in most reordering formulas, this level is the largest stock level, which is the stock needed to satisfy demand until the next order after the current one is received.
Stock position: stock position is the sum of stock on hand (working and safety stock) and stock on order, minus any stock back-ordered to clients. Overstocks may occur if several months worth of stock are on hand or on order when a new order is placed. Stockouts may result if significant quantitites form an upcoming from an upcoming order are on back-order to lower level facilities and this amount is not factored into the reorder quantity.
Procurement period: it covers the time until next regular order will be placed. In a scheduled system, the period might be in multiples of one month; in a perpetal system, it could be counted in days or weeks for the purposes of forecasting. Note that the quantity ordered plus the safety stock must cover the time until the next order is received, which is the procurement period plus the lead time. Stock levels are dependent on accurately estimating medicine demand. If estimates are not based on accurate stock-keeping records, then stock level computations will also be inaccurate, and health institutions will run the risk of mismanaging procurements, resulting in overstocking or stockouts.
Projecting demands: ordering rationally requires forecasting future needs, the least predictable variable in a reordering formula.
1- projective: forecasts using past consumption to predict demand (in pharmaceutical supply systems, the method most likely to produce reasonably accurate forecasts)
2- causal: based on external factors such as market conditions, epidemics, changes in health system size or structure
3- judgemental: based on subjective estimates of purchasing staff and advice from other staff (the least demanding method, and often the least accurate)
4- morbidity: based on incidence of disease and the use of standard treatment guidelines
Base rate: demand may be fairly stable from month to month.
Trend: a steady pattern of increasing or decreasing demand, for eg, increased usage caused by gradually increasing patient attendances.
Seasonality: predictable changes, for eg, increase in demand for malaria drugs during the rainy season
Cyclic demand: demand that ebbs and flows, for eg, with a country’s economic cycle
Random noise: unexplained variations in demand, for eg, in 1 month, 100 bottles of amoxicillin suspension were consumed, with a pattern of 30, 10, 8 and 20 bottles in succeeding months, with no obvious reason for the variation.
Among all these. Random noise is the real problem as in many consumption series at the item level, it is the dominant component.
Average monthly consumption, adjusted for stockouts - (CA)
PP- time until the next order will be placed
Safety stock – additional stock to cope with variability in consumption and lead time (SS)
Quantity at which the cost of ordering the annual requirements and the cost of carrying the inventory are equal
It can also be said that EOQ is “ the square root of two times a guess, times a scientific guess, divided by a precise guess, times management’s guess”
Vilfredo Pareto (1848 -1923) In 1906, he made the famous observation that twenty percent of the population owned eighty percent of the property in Italy
This method aims to draw managers’ attention on the critical few (A-items) not on the trivial many (C-items).
First important step in inventory management is to have a selective approach to fix up inventory levels, order quantities & the extent to which the control can be exercised.
ABC ( Always Better Control ) analysis is an effective tool for such selective control. ABC analysis is a basic tool which helps the management to place their efforts where the results would be useful to the greatest possible extent. This technique involves the classification of inventory items into three categories A,B and C in descending order of annual consumption and monetary value of each items.
The ABC approach states that a company should rate items from A to C, basing its ratings on the following rules:
A-items are goods whose annual consumption value is the highest; the top 70-80% of the annual consumption value of the company typically accounts for only 10-20% of total inventory items.
B-items are the interclass items, with a medium consumption value; those 15-25% of annual consumption value typically accounts for 30% of total inventory items.
C-items are, on the contrary, items with the lowest consumption value; the lower 5% of the annual consumption value typically accounts for 50% of total inventory items.
The annual consumption value is calculated with the formula:
(Annual demand) x (item cost per unit)
Through this categorization, the supply manager can identify inventory hot spots, and separate them from the rest of the items, especially those that are numerous but not that profitable.
The higher the usage, the more activity an item is likely to have; to ensure accurate record balances higher priority items are counted more frequently
Avoiding stockouts on A items is priority, should have tight inventory control, more secured storage areas and better sales forecasts: reorders should be frequent, with weekly or even daily reorder. Greater impact on investment and purchasing spend.
B-items; an important aspect of class B is the monitoring of potential evolution toward class A or in the contrary toward class C
C- items; rordering is made less frequently, a typical inventory policy for C items consist of having only 1 unit on hand and of reordering only when an actual purchase is made; this avoids stock-out situation after purchase which can be an acceptable situation. The bottom of the C category is the best place to start when performing a periodic obsolescence review
VED Analysis
The limitation of ABC analysis is that it is based only on monetary value and the rate of consumption of the items. Sometimes, particularly in a hospital, and item of low monetary value and consumption (e.g. Injection Adrenaline, Anti-Snake Venom etc.,) may be very vital or even life saving.
Their importance cannot be overlooked simply because they do not appear in A category of inventory. Therefore, another parameter of the materials is their "criticality' '.
This could be in terms of the therapeutic value of a drug or intrinsic value of the material in achieving the objectives of hospital system. VED analysis is based on critical values and shortage costs of the Item. Based on the; criticality, the items could be classified into three categories:
Vital,
Essential and
Desirable.
1) Vital Items: There are several vital items in the inventory of a hospital, which could make difference between life and death. There can be serious functional dislocation of patient care when such items are not available even for short period adversely effecting the image of the hospital. Such items should always be stocked in sufficient quantity to ensure their constant availability. Top management should control this group of items. -
2) Essential Items: The shortage of such items can be tolerated for a short period. If these items are not available for a few days or a week, functioning of the hospital can be adversely affected (drugs like Antibiotics etc.). Top/middle level management should preferably control these items.
3) Desirable Items: The shortage of these items will not adversely affect the patient care or hospital functioning even if the shortage is prolonged (items like Vitamins). Middle/lower level management should control desirable items.
As against the cost criteria in ABC analysis the VED analysis is based on subjective analysis by a group of physicians. Such an analysis enables the administrator to give more attention to vital and essential items.
A combination of ABC and VED analysis can be gainfully employed to evolve a meaningful control over the material supplies particularly in a hospital system.
We can combine both and classify the materials depending on both the consumption value and the criticality; it will give us a fruitful result. This can be done in nine ways
An item belonging to both A and V class is costlier, at the same time highly critical, the management should see that it is available at any time the need arises and the stock levels to be controlled properly to see that inventory carrying cost are kept under control.
The items under this analysis are classified into three groups :
The last two categories are viewed further to decide on disposal action to deplete their stocks & thereby release managements’ productive capital
3) HML :- -
Commonly used for management of consumable items.
High, Medium, Low
Based on unit price
Does not depend on consumption
4) SDE - Scarce, Difficult, Easy to obtain
Based on purchasing terms with respect to availability
' 5) GOLF - Government Ordinary, Local and Foreign
Based on source of supply from which material is procured
6) FSN' - Fast moving, Slow moving and Non moving
Based on issues from stores
7) XYZ –
Based on the value of Inventory stored
8) SOS - Seasonal, Of seasonal
Based on seasonal requirements