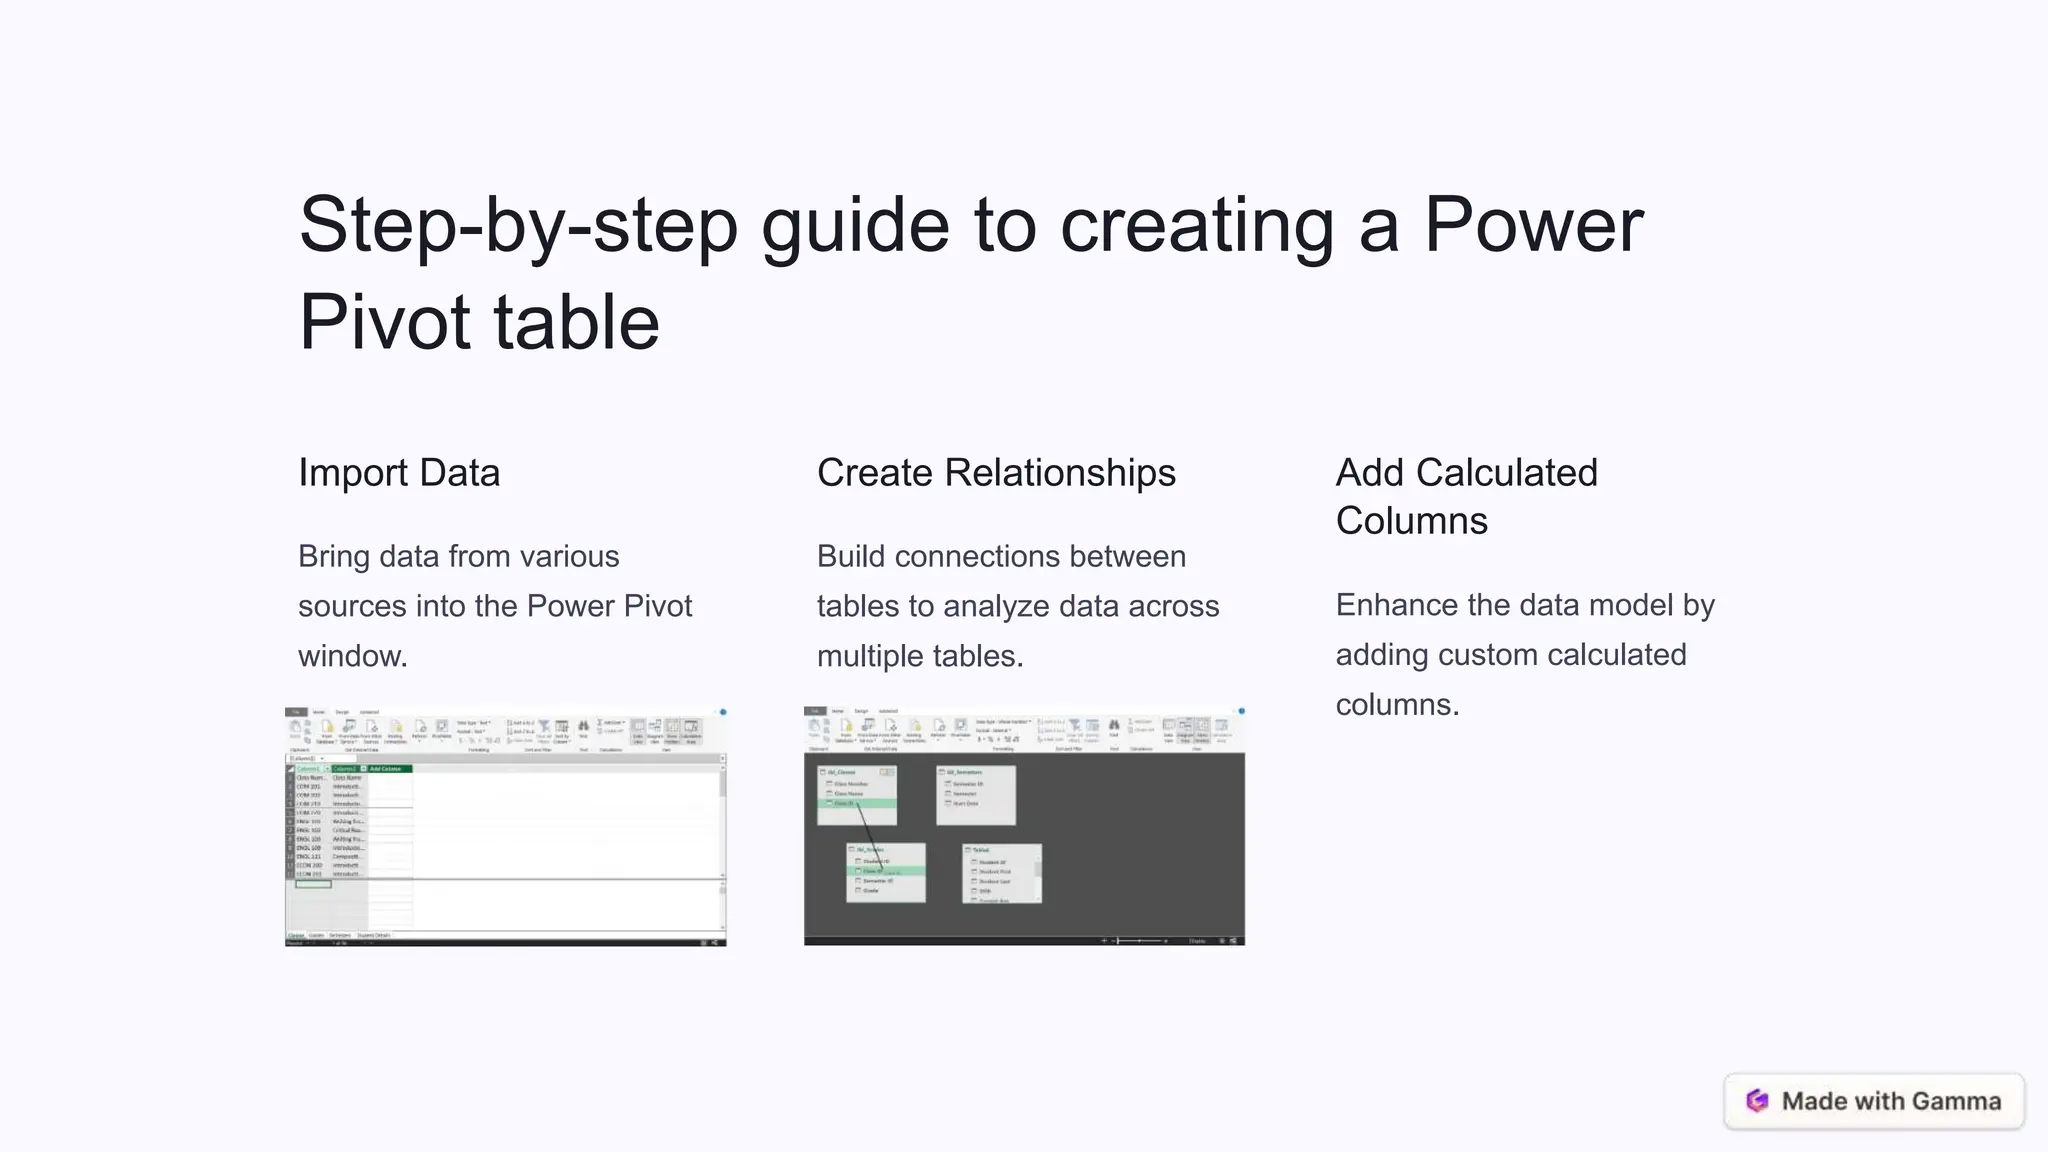
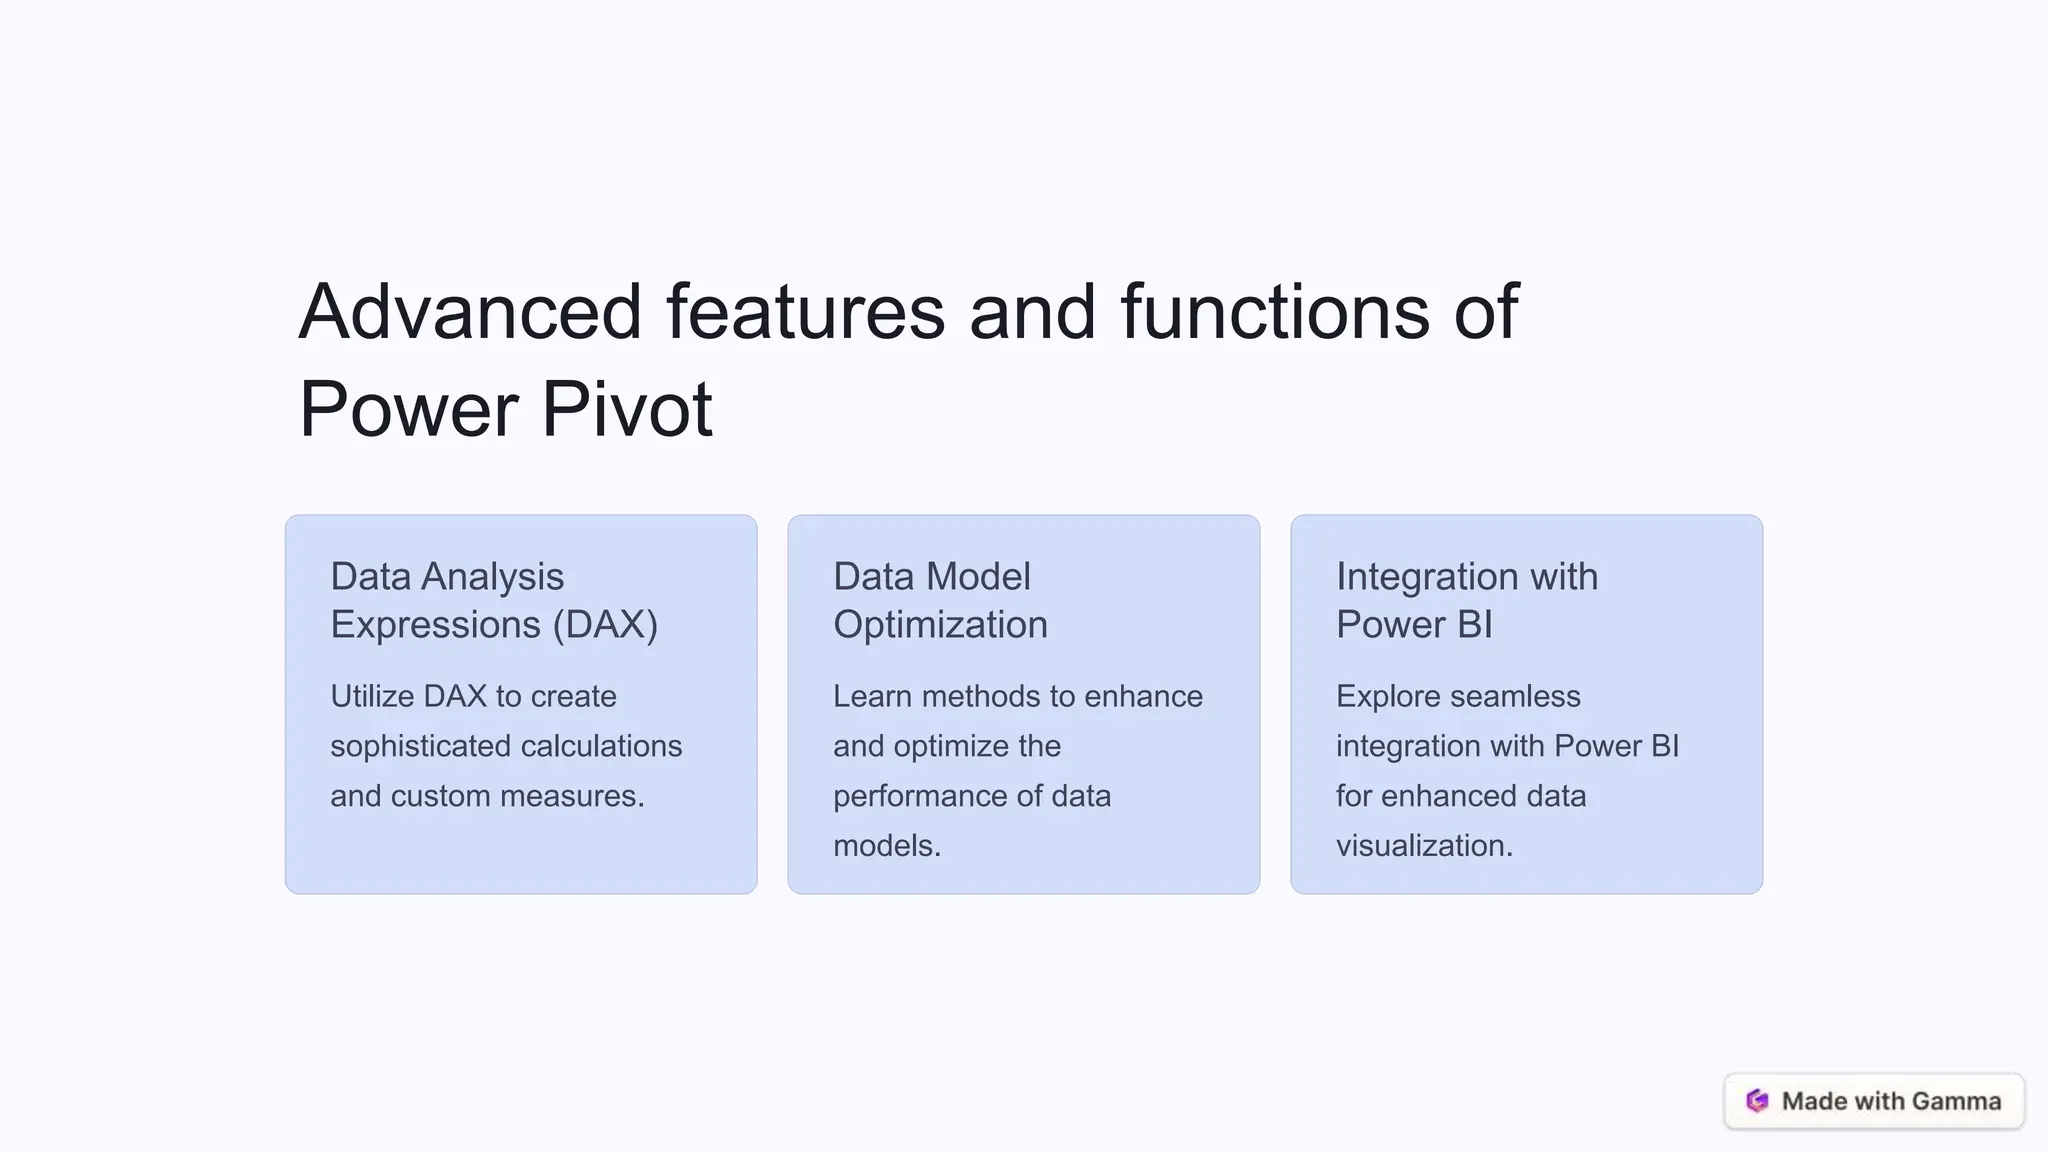
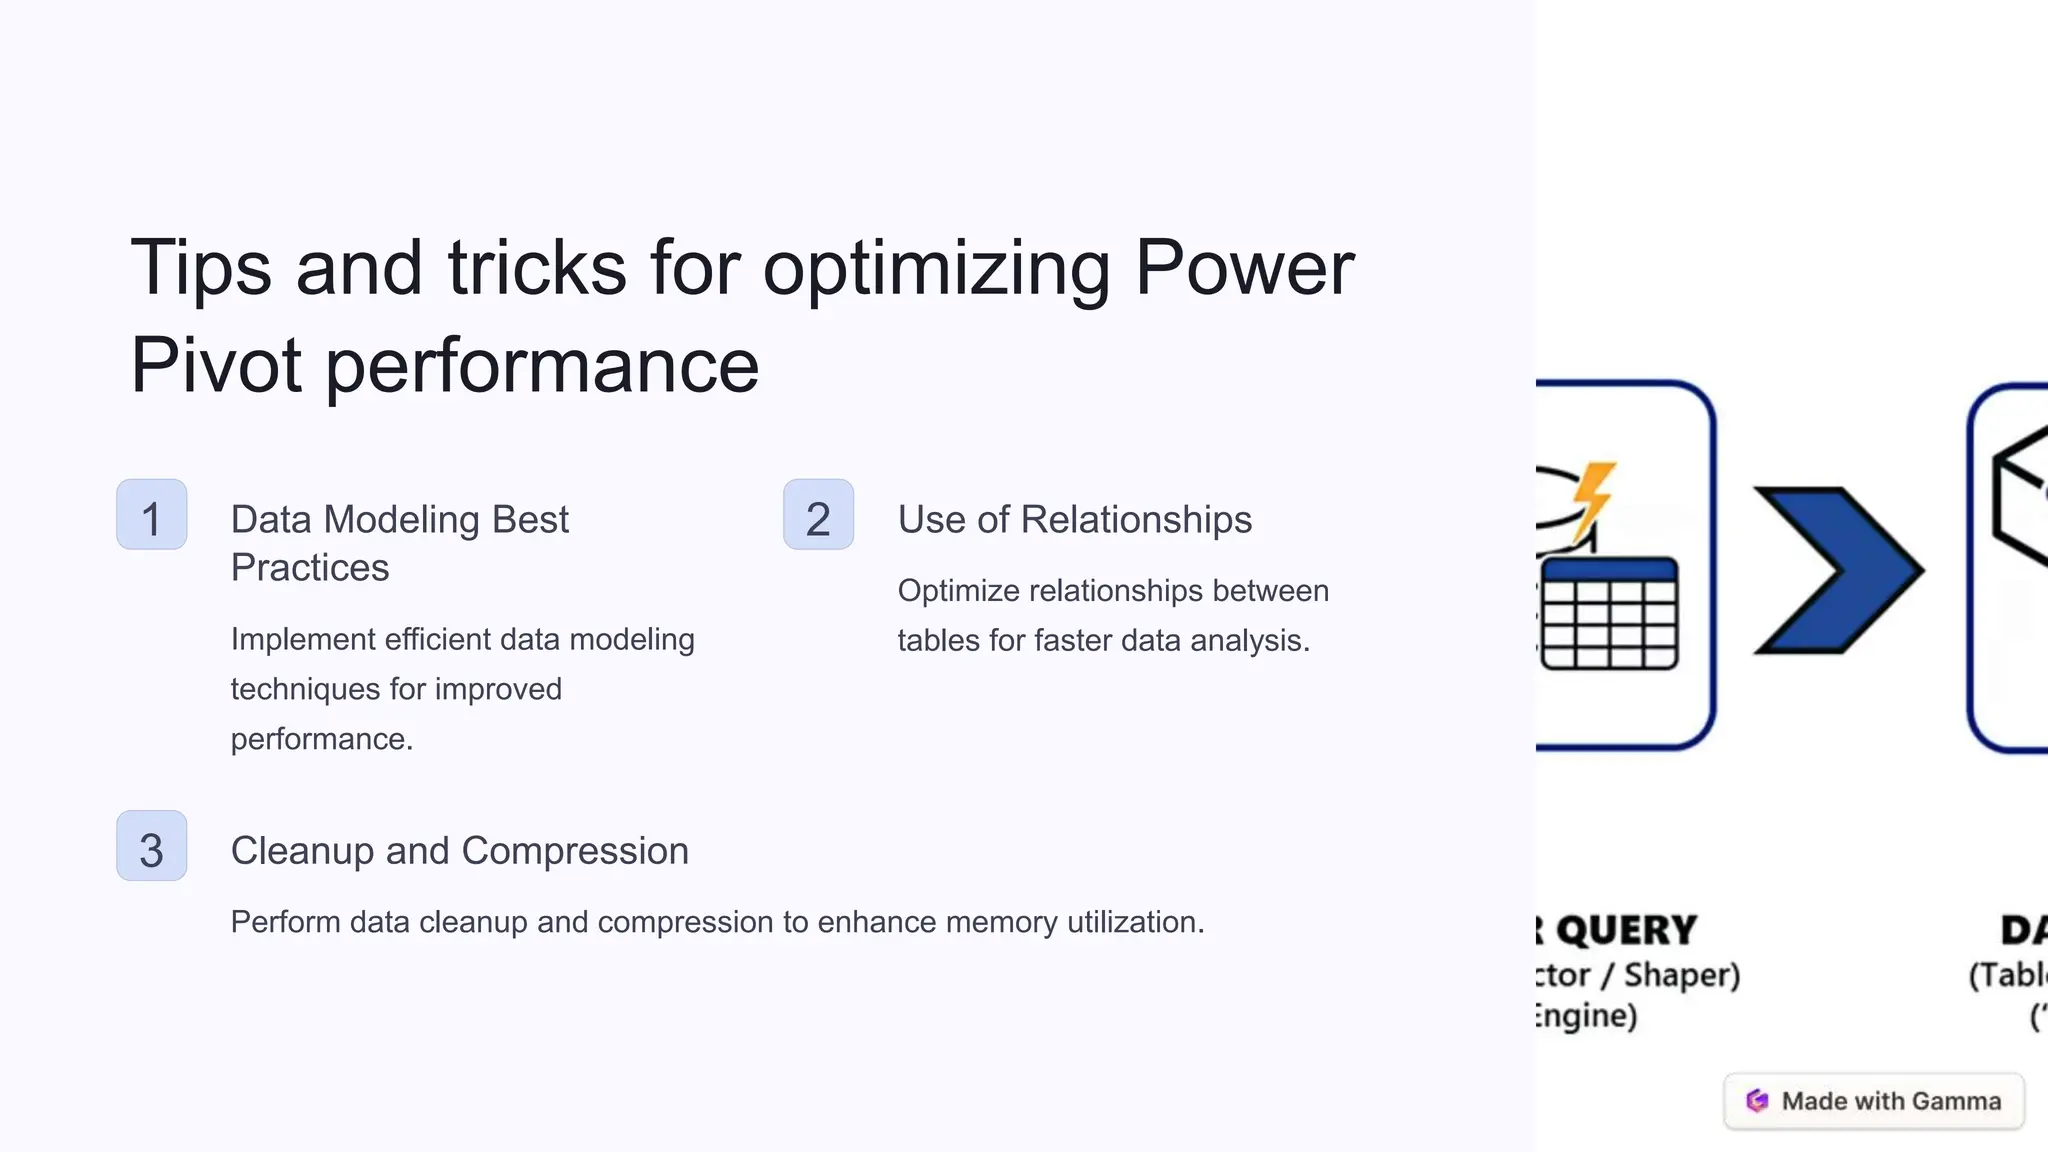
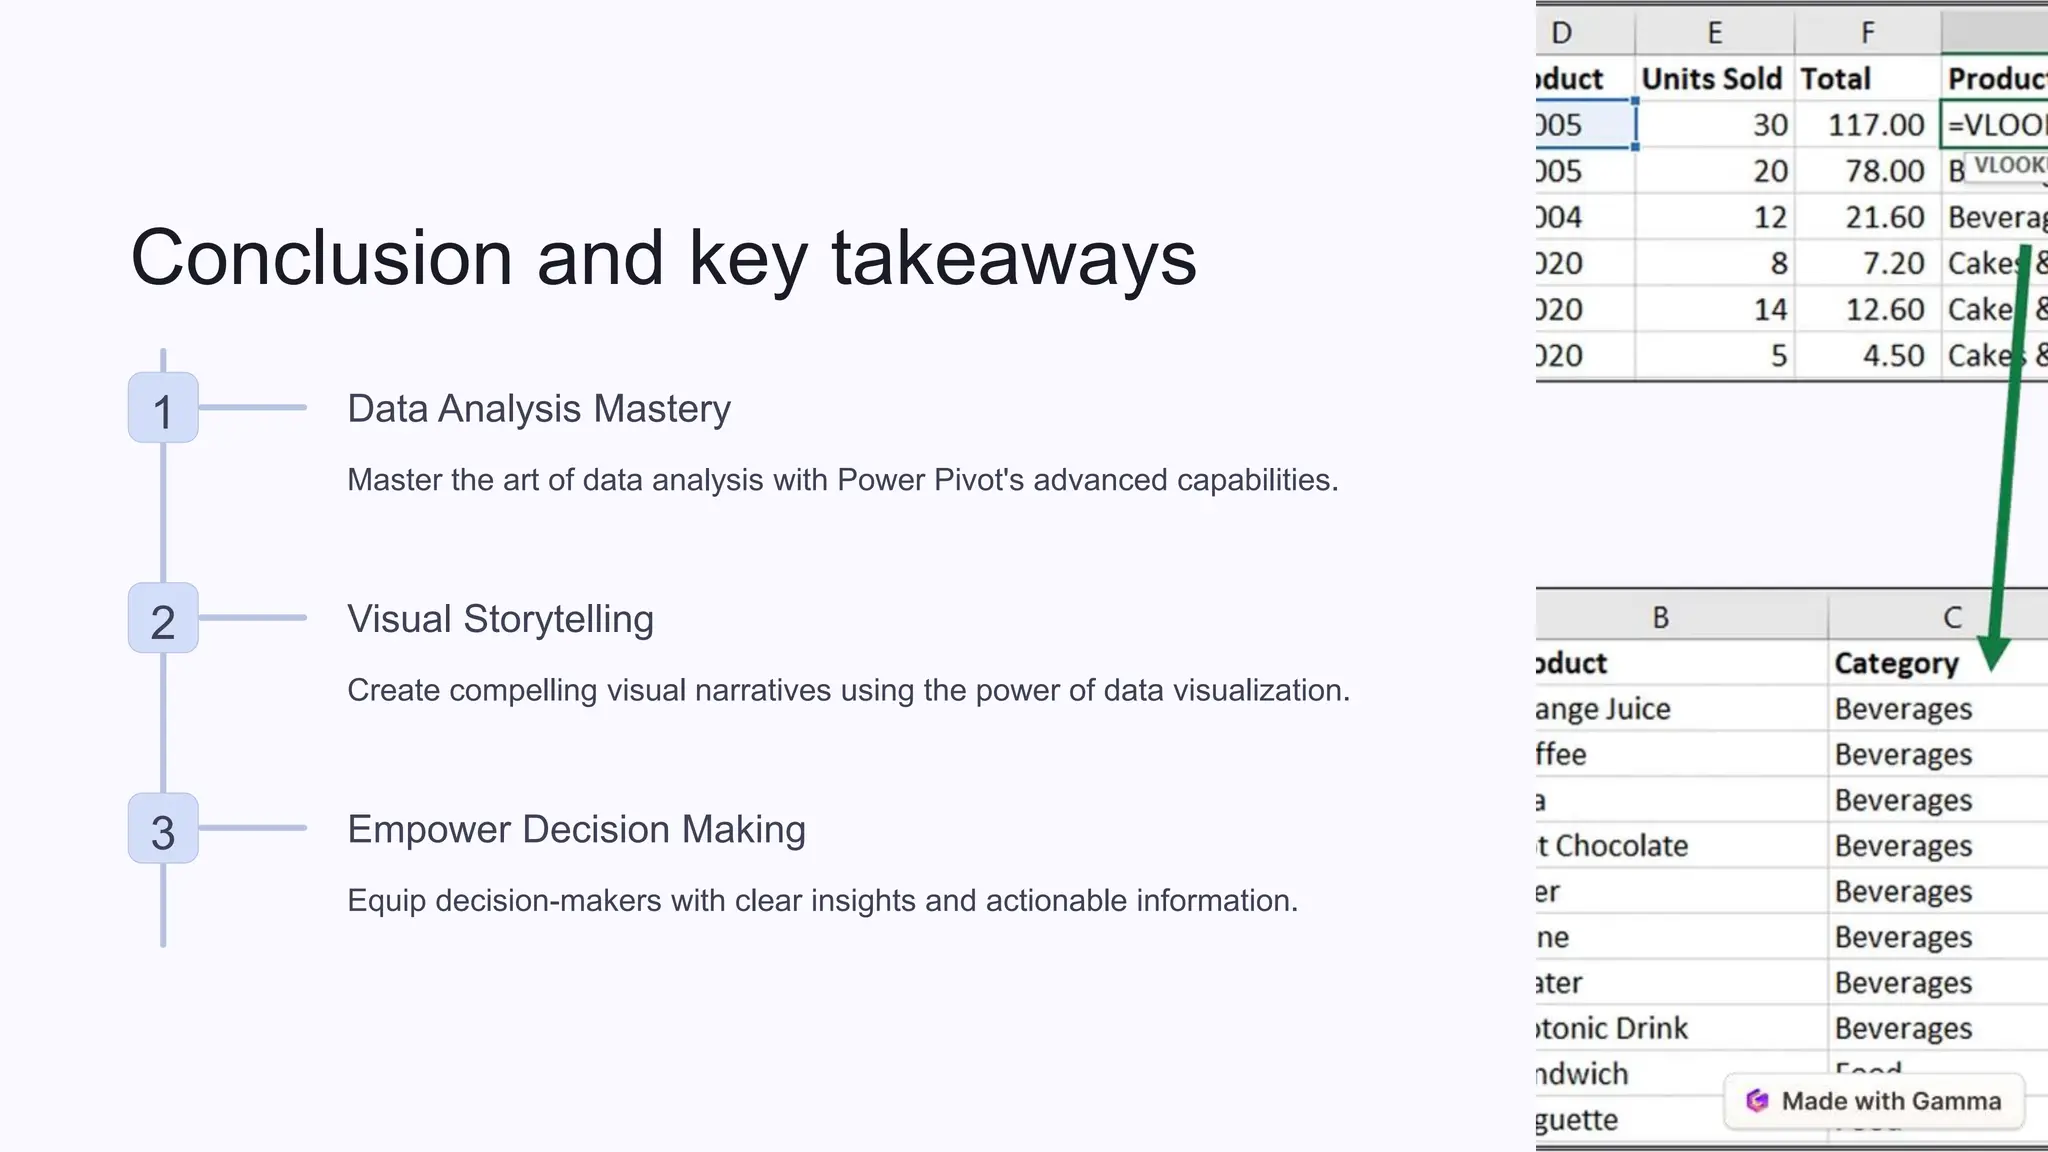
Power Pivot is a powerful data modelling tool in Excel. It allows users to create data models, analyse large datasets, and create sophisticated reports.
From idea to production in a day – Leveraging Azure ML and Streamlit to build...
Introduction-to-Power-Pivot-in-Excel.pptx
1. Introduction to Power
Pivot in Excel
Power Pivot is a powerful data modeling tool in Excel. It allows users to
create data models, analyze large datasets, and create sophisticated
reports.
by anupama
2. What is Power Pivot?
Data Modeling
Power Pivot enables users to
create data models for in-depth
analysis.
Excel Integration
It's an Excel add-in, seamlessly
integrating with familiar Excel
tools.
Big Data Analysis
Capable of handling and
analyzing large datasets
efficiently.
3. Benefits of using Power Pivot
1 Data Integration
Consolidates data from multiple sources
for comprehensive analysis.
2 Speed
Allows for fast reporting and analysis of
large datasets.
3 Advanced Calculations
Enables complex calculations and
statistical analysis with ease.
4 Visualization
Creates interactive and visually compelling
reports and dashboards.
4. Example of Power Pivot in action
Dynamic Dashboard
An example of an interactive
dashboard created using
Power Pivot.
Complex Data Model
Illustration of a sophisticated
data model built with Power
Pivot.
Visual Reports
Examples of visually rich and
insightful reports generated
using Power Pivot.
5. Step-by-step guide to creating a Power
Pivot table
Import Data
Bring data from various
sources into the Power Pivot
window.
Create Relationships
Build connections between
tables to analyze data across
multiple tables.
Add Calculated
Columns
Enhance the data model by
adding custom calculated
columns.
6. Advanced features and functions of
Power Pivot
Data Analysis
Expressions (DAX)
Utilize DAX to create
sophisticated calculations
and custom measures.
Data Model
Optimization
Learn methods to enhance
and optimize the
performance of data
models.
Integration with
Power BI
Explore seamless
integration with Power BI
for enhanced data
visualization.
7. Tips and tricks for optimizing Power
Pivot performance
1 Data Modeling Best
Practices
Implement efficient data modeling
techniques for improved
performance.
2 Use of Relationships
Optimize relationships between
tables for faster data analysis.
3 Cleanup and Compression
Perform data cleanup and compression to enhance memory utilization.
8. Conclusion and key takeaways
1 Data Analysis Mastery
Master the art of data analysis with Power Pivot's advanced capabilities.
2 Visual Storytelling
Create compelling visual narratives using the power of data visualization.
3 Empower Decision Making
Equip decision-makers with clear insights and actionable information.