Download as PDF, PPTX


![#sqlsatParma
#sqlsat462November 28°, 2015
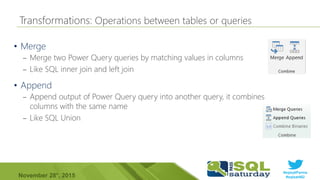
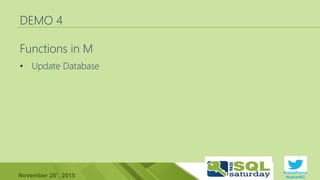
•
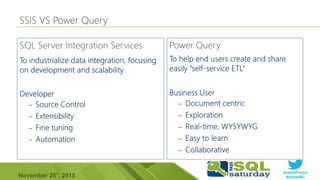
•
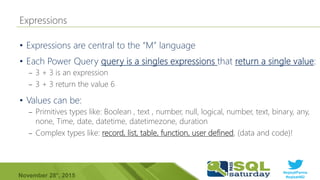
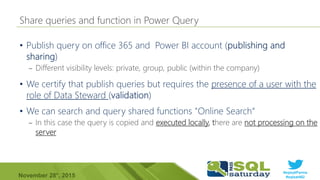
[
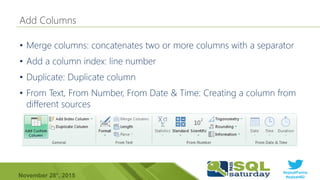
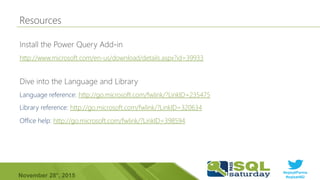
Man = [Athletic = 10 , NonAthletic = 50 ],
Woman = [Athletic = 20 , NonAthletic = 40 ],
Total = Man[Athletic] + Woman[Athletic]
]
= [Athletic = 10 , NonAthletic = 50]](https://image.slidesharecdn.com/powerquery-151130140936-lva1-app6891/85/Power-query-27-320.jpg)
![#sqlsatParma
#sqlsat462November 28°, 2015
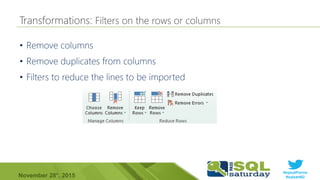
•
•
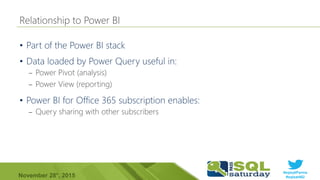
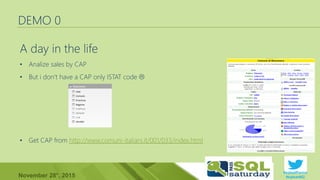
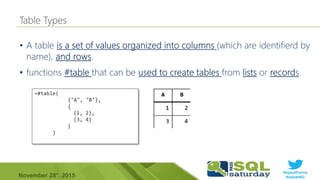
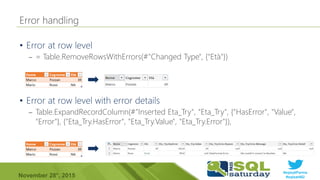
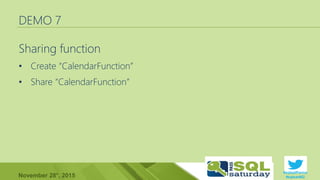
– to a position N of a list
– a row in a table
[
Data = {
[Athletic = 10 , NonAthletic = 50 ],
[Athletic = 20 , NonAthletic = 40 ]
},
Total = data{0}[Athletic] + data{1}[Athletic]
]
= { 1..7 }](https://image.slidesharecdn.com/powerquery-151130140936-lva1-app6891/85/Power-query-28-320.jpg)
![#sqlsatParma
#sqlsat462November 28°, 2015
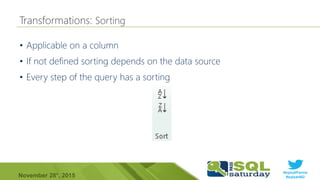
•
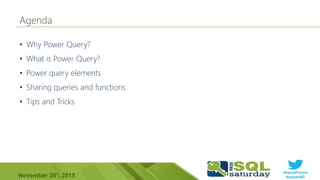
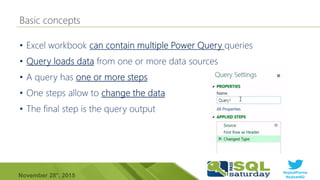
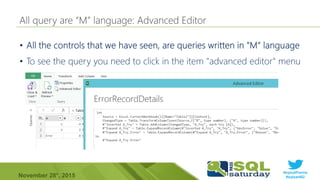
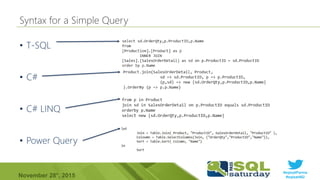
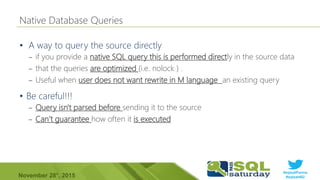
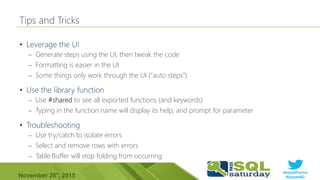
– Result of previous step typically used in the next step
– Step can be defined and reused later on
– Step isn’t evaluated if it isn’t used
let
Source = Sql.Database(".", "AdventureWorksDW2012"),
Sales = Table.FirstN(Source{[Schema="dbo",Item="Sales"]}[Data],10),
Rank = List.Sort(Sales[SalesAmount] ,Order.Ascending),
in
Rank
•
– These become the steps in a query
– Each query created by the UI consist of a let single expression
•
– This is the output of the query
– It can reference any of the expressions](https://image.slidesharecdn.com/powerquery-151130140936-lva1-app6891/85/Power-query-30-320.jpg)

![#sqlsatParma
#sqlsat462November 28°, 2015
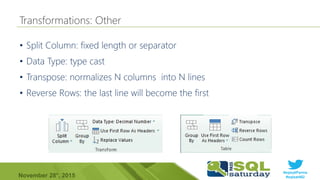
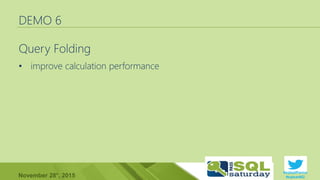
•
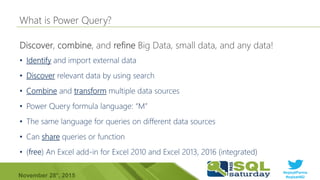
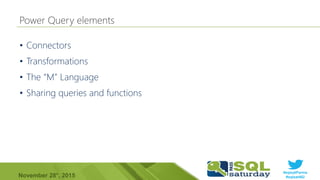
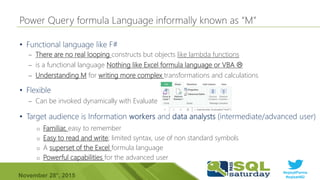
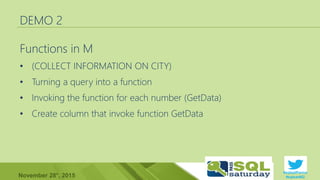
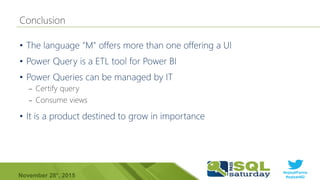
– A function is a value which, when invoked with arguments, produces a new value.
– Function are written by listing the function’s parameters in parentheses, followed
by the goes-to symbol =>, followed by the expression defining the function.
(x) => (x*x) //Multiply the value x to x
(x,y) => (x*y) //Multiply the value x to y
[
Mol = (x,y) = > x*y
]](https://image.slidesharecdn.com/powerquery-151130140936-lva1-app6891/85/Power-query-33-320.jpg)

![#sqlsatParma
#sqlsat462November 28°, 2015
•
o Attempts evaluation
o Encodes results and errors as record values
o Optional otherwise clause
=Table.AddColumn(Source, “Eta_Bis", each try Number.From([Età]) otherwise 0)
try error "Bad"
// [ HasError = true,
// Error = [
// Reason = "Expression.Error",
// Message = "Bad",
// Detail = null
// ]
// ]
try error "Bad" otherwise 42 // 42](https://image.slidesharecdn.com/powerquery-151130140936-lva1-app6891/85/Power-query-38-320.jpg)

![#sqlsatParma
#sqlsat462November 28°, 2015
•
– When?
o Column filters, row filters, joins, group by, pivot, unpivot
o Numeric calculations, aggregations
– Functionality depends on the data source
o Relational sources (SQL Server, Oracle, etc) support the
most functionality
o Also fold to OData, Active Directory, Exchange, and others
•
o Use Table.Buffer() or List.Buffer()
o By combining data from multiple data sources with different privacy level
o Preventing query folding with custom SQL (Sql.Database("localhost","adventureworkdw",[Query="select * from dimdate"])](https://image.slidesharecdn.com/powerquery-151130140936-lva1-app6891/85/Power-query-40-320.jpg)


This document contains the agenda for a Power Query event. It includes sections on the sponsor, organizers, presenter Marco Pozzan, and an agenda with topics like Power Query basics, functions, error handling, privacy settings, and demos. The event aims to teach participants about Power Query's capabilities for data transformation, integration, and analysis.