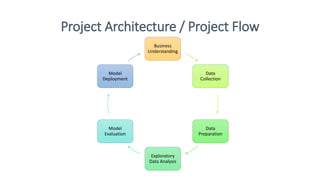
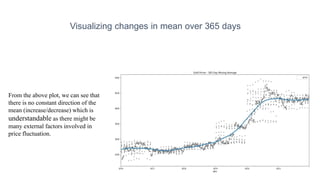
Presented By:
1.Anupama
2.Laiba
3.Somanath
4.Sunny
5.Rohan
6.Yoginee
Contents
• Business Objective
• Project Architecture
• Data Collection & Details
• Exploratory Data Analysis
• Visualizations
• Modeling
• Evaluation
• Deployment
Business Objective
• Data provided is related to gold prices. The objective is to understand
the underlying structure in your dataset and come up with a suitable
forecasting model which can effectively forecast gold prices for next
30 days.
• This forecast model will be used by gold exporting and gold importing
companies to understand the metal price movements and accordingly
set their revenue expectations.
Significance of GOLD
GOLD
Global
Currency
Investment
Tool
Hedging
against
inflation
Stable
Commodity
Project Architecture / Project Flow
Business
Understanding
Data
Collection
Data
Preparation
Exploratory
Data Analysis
Model
Evaluation
Model
Deployment
Data Collection & Details
 2182 rows & 2 column
 Year range 01-01-2016 to 21-12-2021
 Unique Date 2182 and Price 1876
These are the explanations for variables.
1) Date (object) : Daily entry date
2) Price (Float64) : Gold Price
Importing libraries and Data Sets
Exploratory Data Analysis (EDA)
Information Head
Shape
Is Null present?
Find the Unique values
Duplicates
Describe the data
EDA (Visualization)
1.We can see that there is an increasing Trend. So, Trend is not constant.
2.Variance is also not constant.
The drastic increase in gold price after the year 2020 and there is intermediate fluctuation in 2021.
EDA Visualizations
Time series decomposition
•Trend - Slow moving changes in a
time series, Responsible for making
series gradually increase or decrease
over time.
•Seasonality - Seasonal Patterns in the
series. The cycles occur repeatedly
over a fixed period of time.
•Residuals - The behavior of the time
series that cannot be explained by the
trend and seasonality components.
Also called random errors/white
noise.
Visualizing changes in mean over 365 days
From the above plot, we can see that
there is no constant direction of the
mean (increase/decrease) which is
understandable as there might be
many external factors involved in
price fluctuation.
To Check Normality In The Data
Bar Plot
Pie Chart
Trend & Seasonality in Months
Trend & Seasonality in Weeks
Correlation Plot - EDA
Split The Data
EDA in HTML using Sweetviz
Modelling
Model Building
ARIMA Model
Forecast for the 30 Days
SARIMA Model
Forecast for next 30 Days
Holt Method
single & Multiple exponential smoothing
Fit the model tend=‘add', season=‘add'
EMA Model
Model Evaluation
Compering plots
ARIMA
SARIMA
Single exponential smoothing (Hot Encoding)
Multiple exponential smoothing ( Hot Encoding)
Compering values
EMA Model
Multiple exponential smoothing ( Hot Encoding)
Single exponential smoothing (Hot Encoding)
ARIMA
SARIMA
Deployment
Deployment App
Challenges faced
• Research on history of gold prices
• Deciding model building technique
How Challenges Overcome
• As we are not much aware of the gold price we have done a lot of
research to find out the gold price history.
• We as a team worked so hard to get the knowledge on the previous
year gold price data.
• Which helps us to do the project more effectively.
Deciding Model Building Technique
• As we tried many model building techniques every model don’t have
such a significant difference in the output
• We are little bit worried about the output results that we got.
• But we again overcame this as a team, Everyone has worked really
hard on this part and we finally build a model that best suits the data
Time Series Forecasting Project  Presentation.

Time Series Forecasting Project Presentation.