Downloaded 446 times


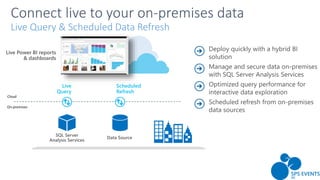


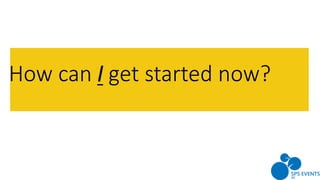


![The MEDIAN function returns the median of the numbers in a column. The
MEDIANX function returns the median of an expression evaluated for each
row in a table.
Syntax:
=MEDIANX( ALLSELECTED(Product[ProductName])
,[Sum of RevenueAmount])
Median(X)](https://image.slidesharecdn.com/powerbibasicsspsreston16-161206004358/85/Power-BI-From-the-Basics-41-320.jpg)
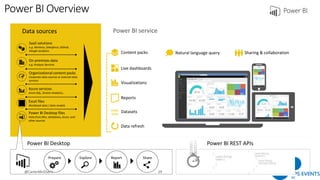
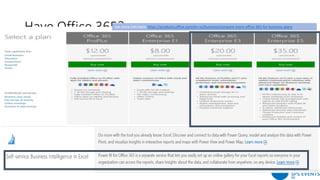
![Returns the k-th percentile of values in a range, where k is in the range
0..1, inclusive or exclusive.
You can use this function to establish a threshold of acceptance. For example, you can
decide to examine candidates who score above the 90th percentile.
Syntax:
PERCENTILE.INC (Column, K) or PERCENTILE.EXC (Column, K)
PERCENTILEX.INC (Table, Expression, K) or
PERCENTILEX.EXC (Table, Expression, K)
PERCENTILEX.INC (Product
,[Sum of RevenueAmount],0.9)
Percentile(X)](https://image.slidesharecdn.com/powerbibasicsspsreston16-161206004358/85/Power-BI-From-the-Basics-42-320.jpg)
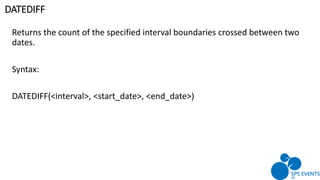
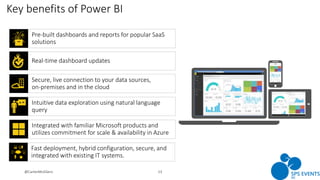
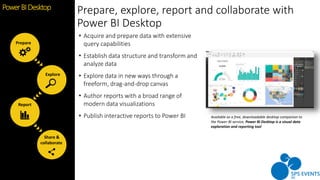
![The XNPV function returns the net present value for a schedule of cash
flows that is not necessarily periodic.
Syntax: XNPV(<table>, <values>, <dates>, <rate>)
Present value := XNPV( CashFlows,
[Payment],
[Date], 0.09 )
= 2086.65
Date Payment
1/1/2014 -10000
3/1/2014 2750
10/30/2014 4250
2/15/2015 3250
4/1/2015 2750
XNPV](https://image.slidesharecdn.com/powerbibasicsspsreston16-161206004358/85/Power-BI-From-the-Basics-44-320.jpg)
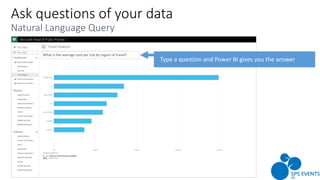
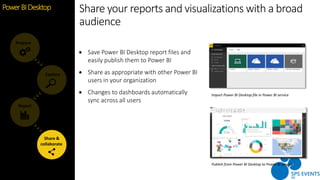
![Returns the product of an expression evaluated for each row in
a table.
Future investment= [Sum of RevenueAmount]
* Productx(Rates,1+[Rates])
The PRODUCTX function takes as its first argument a table,
or an expression that returns a table. The second argument is a column that contains
the numbers for which you want to compute the product, or an expression that
evaluates to a column.
Rates
5.0%
4.0%
3.5%
2.0%
3.0%
5.0%
PRODUCT(X)](https://image.slidesharecdn.com/powerbibasicsspsreston16-161206004358/85/Power-BI-From-the-Basics-45-320.jpg)
![CrossFilter( FK, PK, direction )
• Similar to UseRelationship, you can change the filter direction
• Direction: both, one, none
• Calculate( [My measure], CrossFilter( … ) )
DAX Expressions for relationships](https://image.slidesharecdn.com/powerbibasicsspsreston16-161206004358/85/Power-BI-From-the-Basics-46-320.jpg)
![Count of Customers = //filters through Sales by default
Calculate( CountRows( Customer ) )
Count of Customers using Region =
Calculate( [Count of Customers],
//Cut filtering between Sales and Customer, then use the inactive relationship
CrossFilter( Sales[CustomerId], Customer[Id], none ),
UseRelationship ( Customer[RegionId], Region[Id] )
)
Count of Customers using Sales and Region =
Calculate( [Count of Customers], //filters through Sales by default
//Filter Customers to only those in remaining Regions
Filter( Customer, Contains( Region, [Id], Customer[RegionId] ) )
)
CrossFilter(FK, PK, direction)](https://image.slidesharecdn.com/powerbibasicsspsreston16-161206004358/85/Power-BI-From-the-Basics-47-320.jpg)

Nikkia T. Carter is the CEO of Carter-Mcgowan Services, LLC, which specializes in business technology consulting, Microsoft solutions including SharePoint and Office 365, and various app and website development services. The document also covers aspects of Power BI, detailing its capabilities for data analysis and visualization, and outlines features of Power BI Desktop that enable users to prepare, explore, and share data insights. Additionally, it emphasizes the various partnerships, certifications, and experiences that establish the company’s credibility in the industry.