Downloaded 14 times


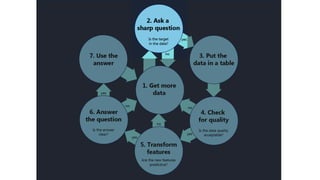


![1. How much / how many?
2. Which category?
3. Which groups?
4. Is it weird?
5. Which action?
[algorithm]](https://image.slidesharecdn.com/dataanalyticsusingpowerbi-170405120945/85/Data-analytics-using-Power-BI-20-320.jpg)

![Which category?
Is this an image of a cat or
a dog?
Which aircraft is causing
this radar signature?
What is the topic of this
news article?
[classification]](https://image.slidesharecdn.com/dataanalyticsusingpowerbi-170405120945/85/Data-analytics-using-Power-BI-22-320.jpg)


![Diamonds
[prediction]](https://image.slidesharecdn.com/dataanalyticsusingpowerbi-170405120945/85/Data-analytics-using-Power-BI-38-320.jpg)


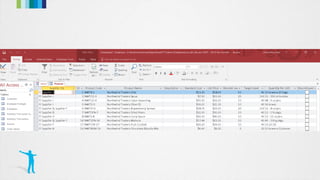
This document provides an overview of Power BI and its capabilities for data analytics. Power BI allows users to analyze data and share insights across devices. It connects to various data sources and allows users to clean, transform and visualize data through reports and dashboards. Examples shown include visualizing diamond data and using algorithms for classification, prediction and other tasks. Power BI provides tools for business users to gain insights from metrics in a centralized location.