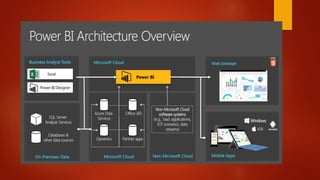
Power BI is a Microsoft business analytics service that allows users to create reports and dashboards without relying on developers. The presentation covers various aspects of Power BI, including its architecture, components like Power BI desktop and mobile, as well as DAX functions and report publishing. Advantages include ease of use and advanced visualizations, while disadvantages involve sharing limitations and certain UI issues in slicers.


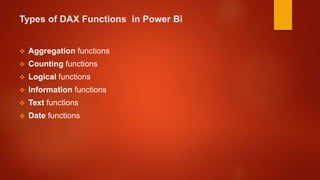
![Examples of Dax Functions:
1) SUM(<COLOUM>)
-- RETURN A DECIMAL NUMBER AFTER SUMMATION OF VALUES IN THE COLUMN
EX: SUM(SALES[AMOUNT])
2) SUM(<TABLE>,<EXPRESSION>)
--RETURN THE SUM OF EXPRESSION EVALUATED FOR EACH ROW IN THE TABLE
EX: SUM(FILTER(INTERNETSALES,[INTERNETSALES[SALESTERRITORYID]=5),[FREIGHT])
3) COUNT(<COLOUM>)
--THE COUNT FUNCTION COUNTS THE NUMBER OF CELLS IN A COLUMN THAT CONTAIN NUMBERS
(DATES,TEXT).
EX: COUNT([SHIPDATE])
4) DISTINCTCOUNT(<COLOUM>)
--THE DISTINCTCOUNT FUNCTION COUNTS THE NUMBER OF DIFFERENT CELLS IN A COLUMN OF NUMBERS.
EX: =DISTINCTCOUNT(RESELLERSALES_USD[SALESORDERNUMBER])](https://image.slidesharecdn.com/power-bi-180505180737/85/Power-bi-14-320.jpg)


![[DSC Europe 25] Andrzej Kowalczyk - AI - how to start small and grow in the f...](https://cdn.slidesharecdn.com/ss_thumbnails/oy1zmo94qv6vpcqjvno2-andrzej-kowalczyk-ai-how-to-start-small-and-grow-in-the-future-1-260119121559-cf093b23-thumbnail.jpg?width=640&height=640&fit=bounds)


![[DSC Europe 25] Ivan Lukovic & Marija Djukic - From Data to Value: Why Maturi...](https://cdn.slidesharecdn.com/ss_thumbnails/ahrfps8xr6knowwhacxh-1-ivan-marija-dsc-2025-ld-v1-presentation-260115093812-be21adfc-thumbnail.jpg?width=640&height=640&fit=bounds)


![[DSC Europe 25] Bojan Djuricic - Predictive Design Process.pdf](https://cdn.slidesharecdn.com/ss_thumbnails/5awdrbedqdek3gqu2ezy-4-the-predictive-design-bojan-djuricic-260120105856-6c399e9b-thumbnail.jpg?width=640&height=640&fit=bounds)


