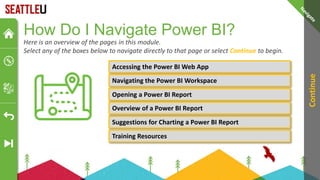
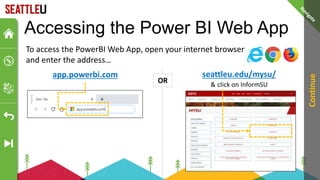
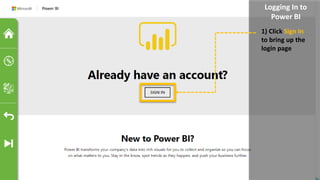
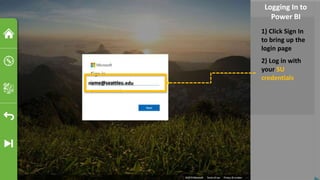
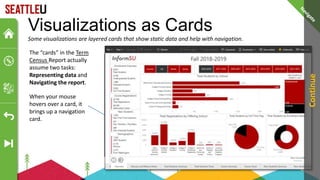
This PowerPoint presentation provides an interactive tutorial on Power BI. It begins with an overview on how to navigate the interactive slides. It then discusses how Power BI works with Seattle University and how users can access Power BI reports. The presentation demonstrates how to log into the Power BI web app and navigate the different sections of the workspace. It also shows how to open and interact with a sample Power BI report on enrollment data, including applying slicers to filter the visualizations. The presentation concludes with suggestions for exploring Power BI reports and links to additional training resources.
![How to navigate this
Interactive PowerPoint Presentation
This presentation is designed to be an interactive space while providing information.
Whenever you see a GOLD ringed box, it means you can click or select
an interaction within the presentation.
Click or Select
Here
Alternatively, you can also hit the [ENTER] or the [arrow keys] on your
keyboard to navigate through animations.
Click
Here
to
Continue](https://image.slidesharecdn.com/v1-231117191309-25732008/85/PowerBI-Tutorial-pptx-2-320.jpg)