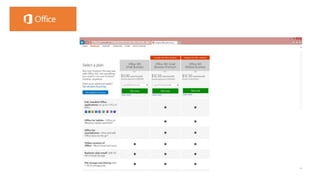
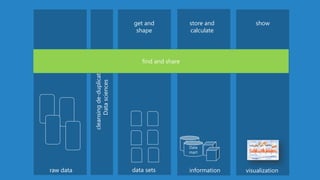
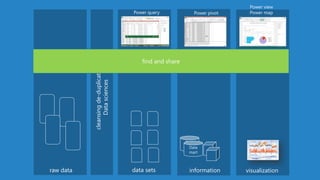
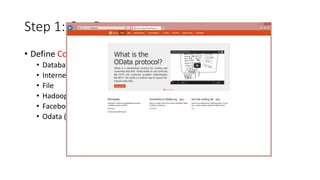
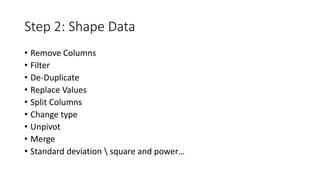
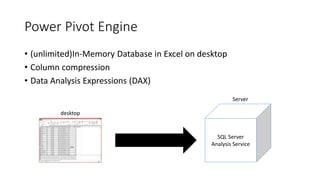
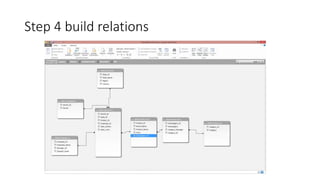
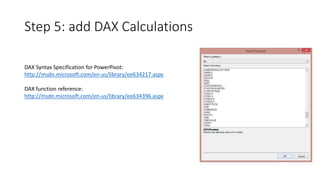
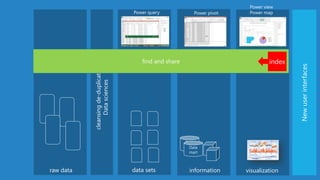
The document provides an overview of new data analytics capabilities in Excel including Power Query, Power Pivot, and Power View. It discusses three main steps to create insights with Power Query: 1) Get Data from various sources, 2) Shape Data by cleaning, filtering, and transforming it, and 3) Load Data into Excel, Power Pivot, or Power View. It then demonstrates how to build relationships and calculations with Power Pivot and visualize data with Power View and Power Map. The presentation aims to explain Microsoft's new focus on subscriptions, the cloud, and supporting analytics use cases.