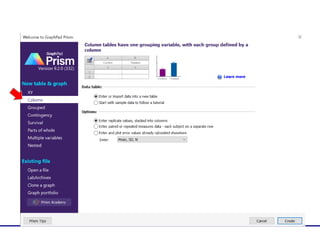
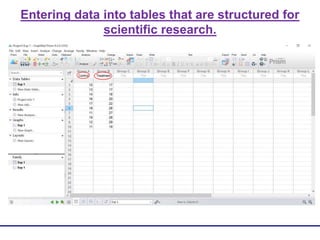
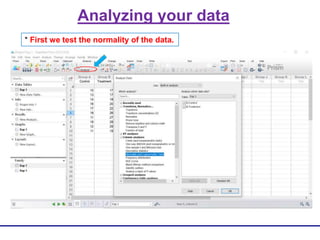
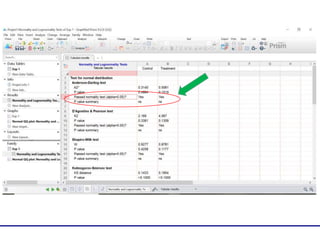
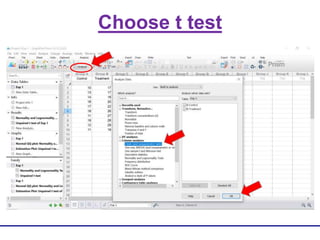
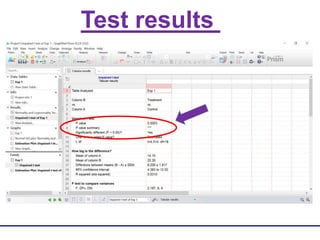
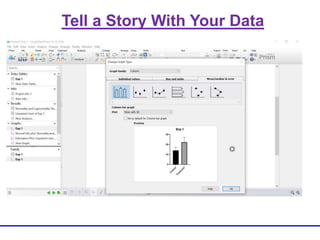
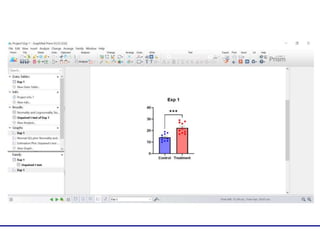
GraphPad Prism is a leading data analysis and visualization software that has powerful biostatistics, curve fitting, and graphing tools. It allows users to easily organize, analyze, and graph repeated experiments and pick appropriate statistical tests. Some key features include making different types of graphs from statistical data, excellent analysis for baseline corrections and normalizing multiple data sets on the same graph, and customizable and professional-looking graphing options. The software also has 8 tables for structuring scientific research data and analyzing it through testing normality, choosing statistical tests like the t-test, and determining best-fit parameters for models.