Downloaded 13 times
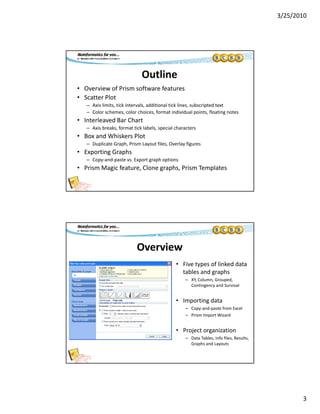
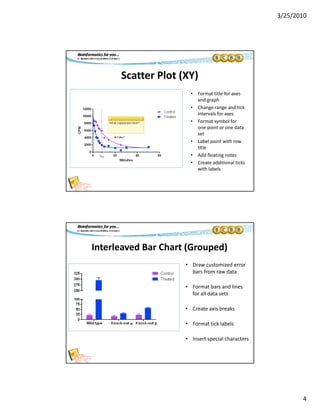

This document summarizes features of the Prism graphing software for customizing graphs. It discusses how to customize various graph types like scatter plots, bar charts, and box plots by changing axes, colors, labels, and more. It also covers exporting graphs, cloning graphs to create new figures easily, and using templates to store common graph types and analyses. Upcoming seminars on curve fitting and statistical applications in Prism are also listed.