Downloaded 289 times
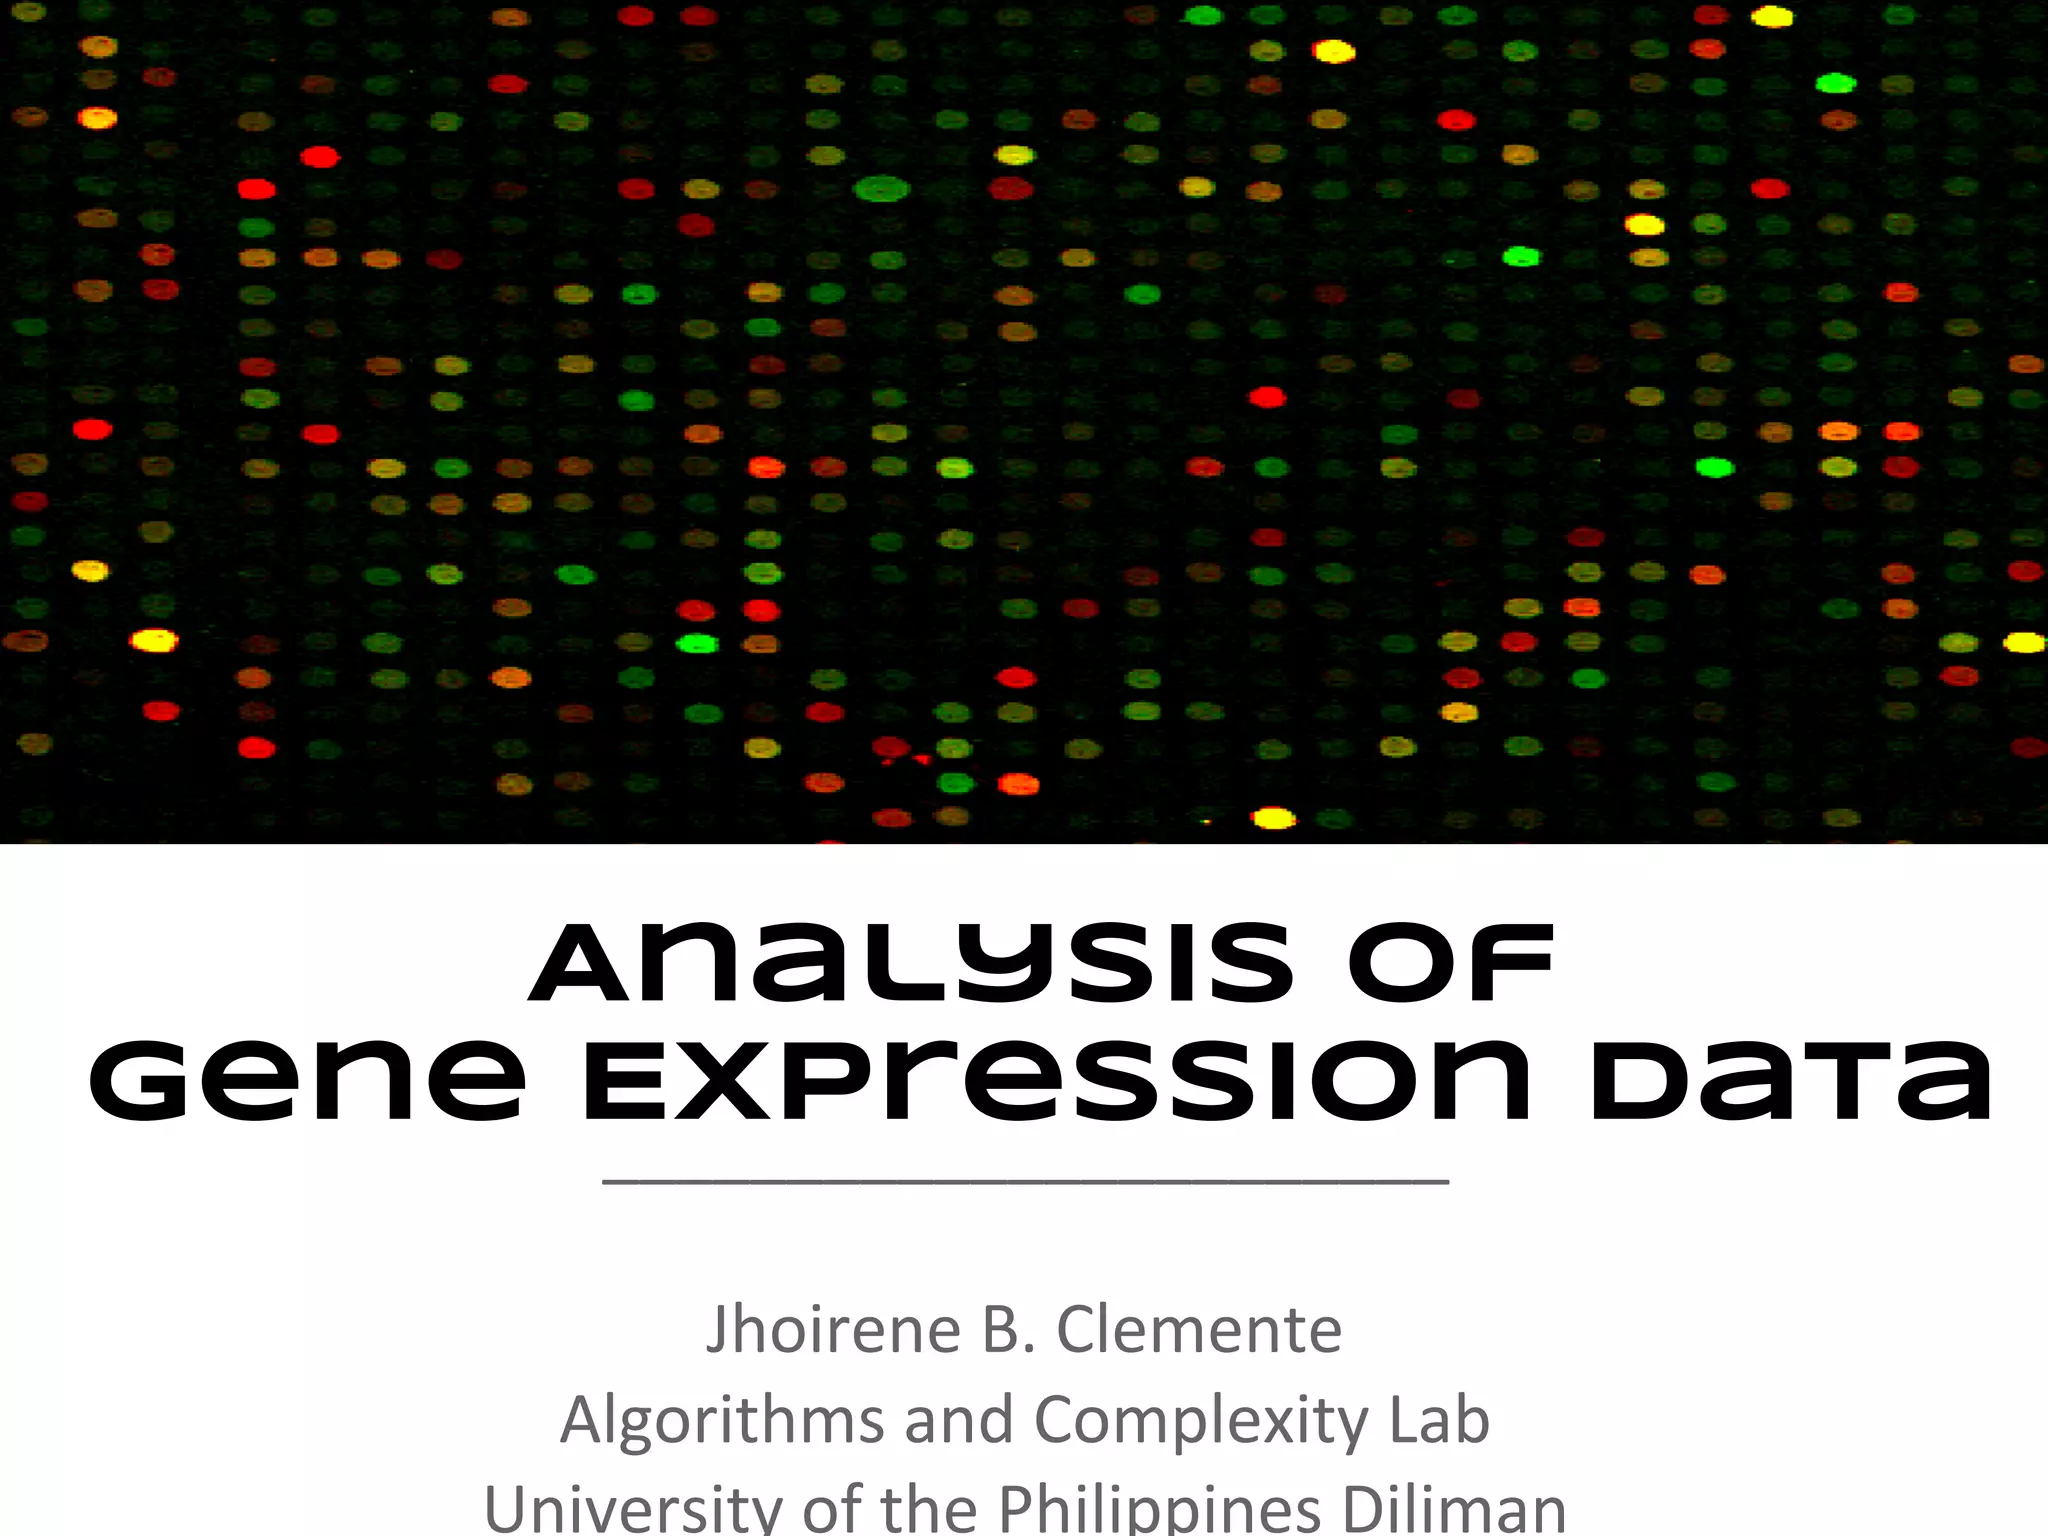
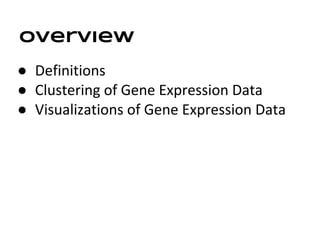
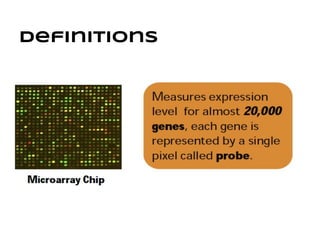
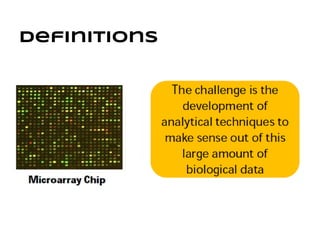
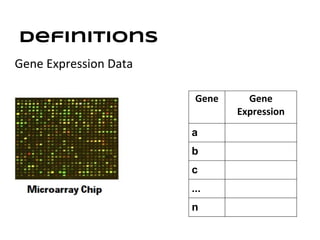
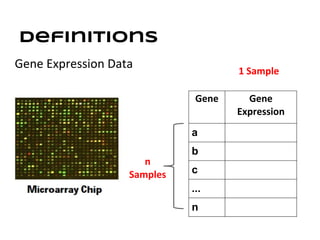
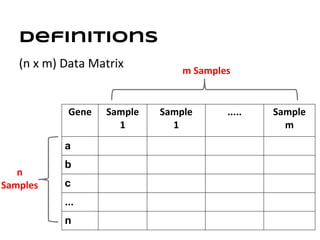
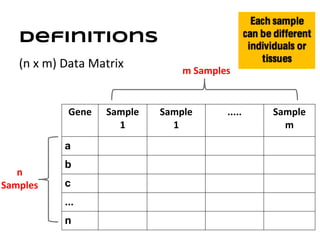
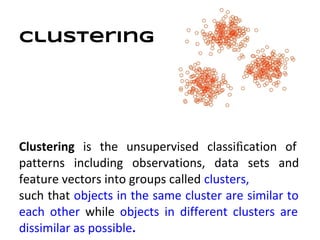
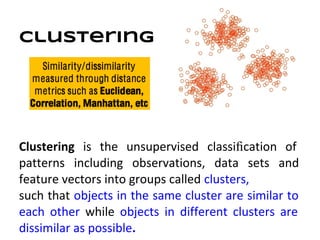
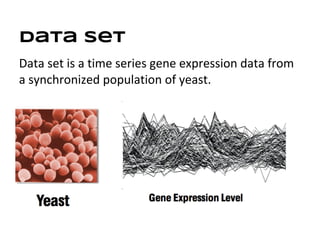
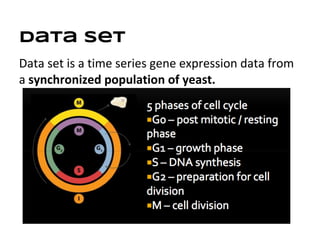
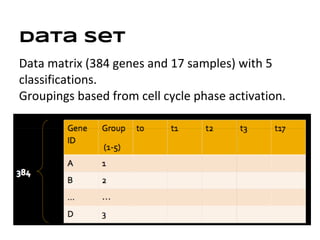
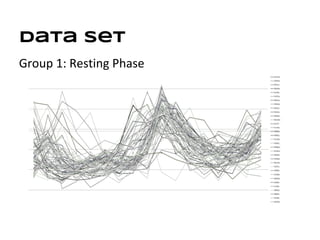
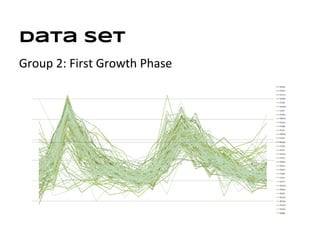
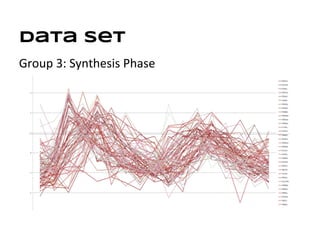
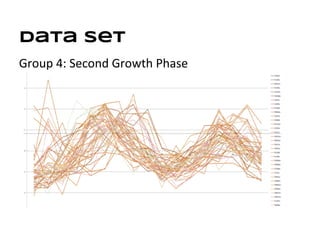
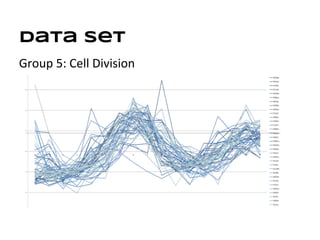
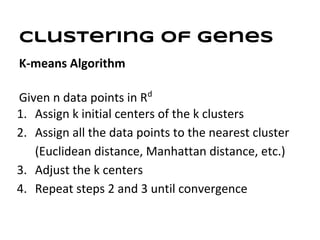
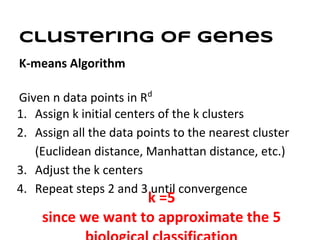
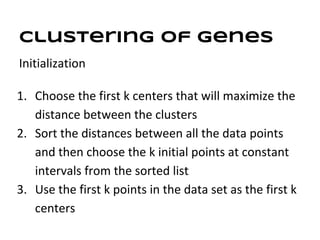
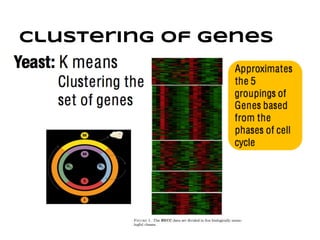
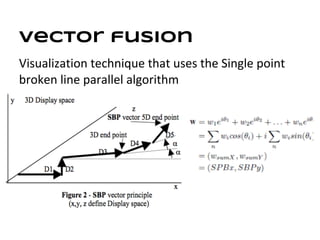
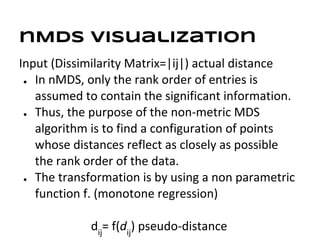
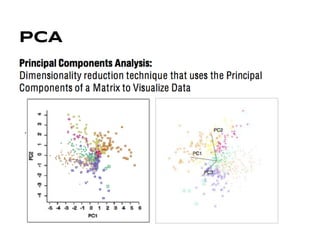
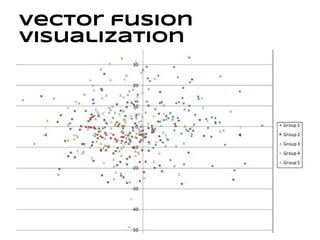
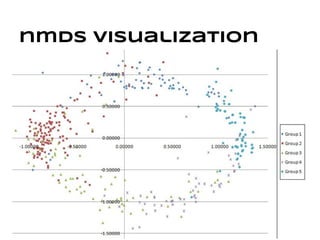
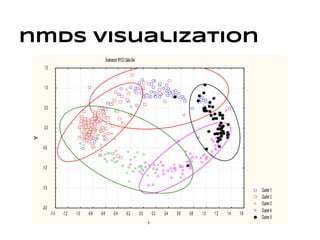
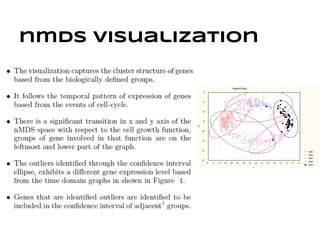
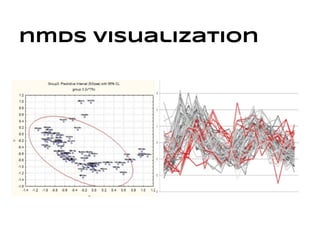
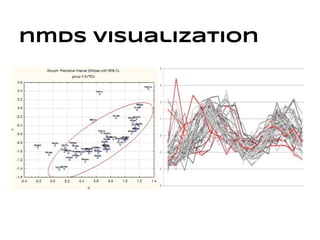


This document discusses analyzing and visualizing gene expression data. It defines key terms like genes and gene expression data. It also describes clustering gene expression data using k-means clustering to group genes based on similarity in a dataset of yeast cell cycle genes. Finally, it discusses visualizing gene expression data using techniques like vector fusion, nMDS, and PCA to project high-dimensional gene expression datasets into 2D or 3D spaces.