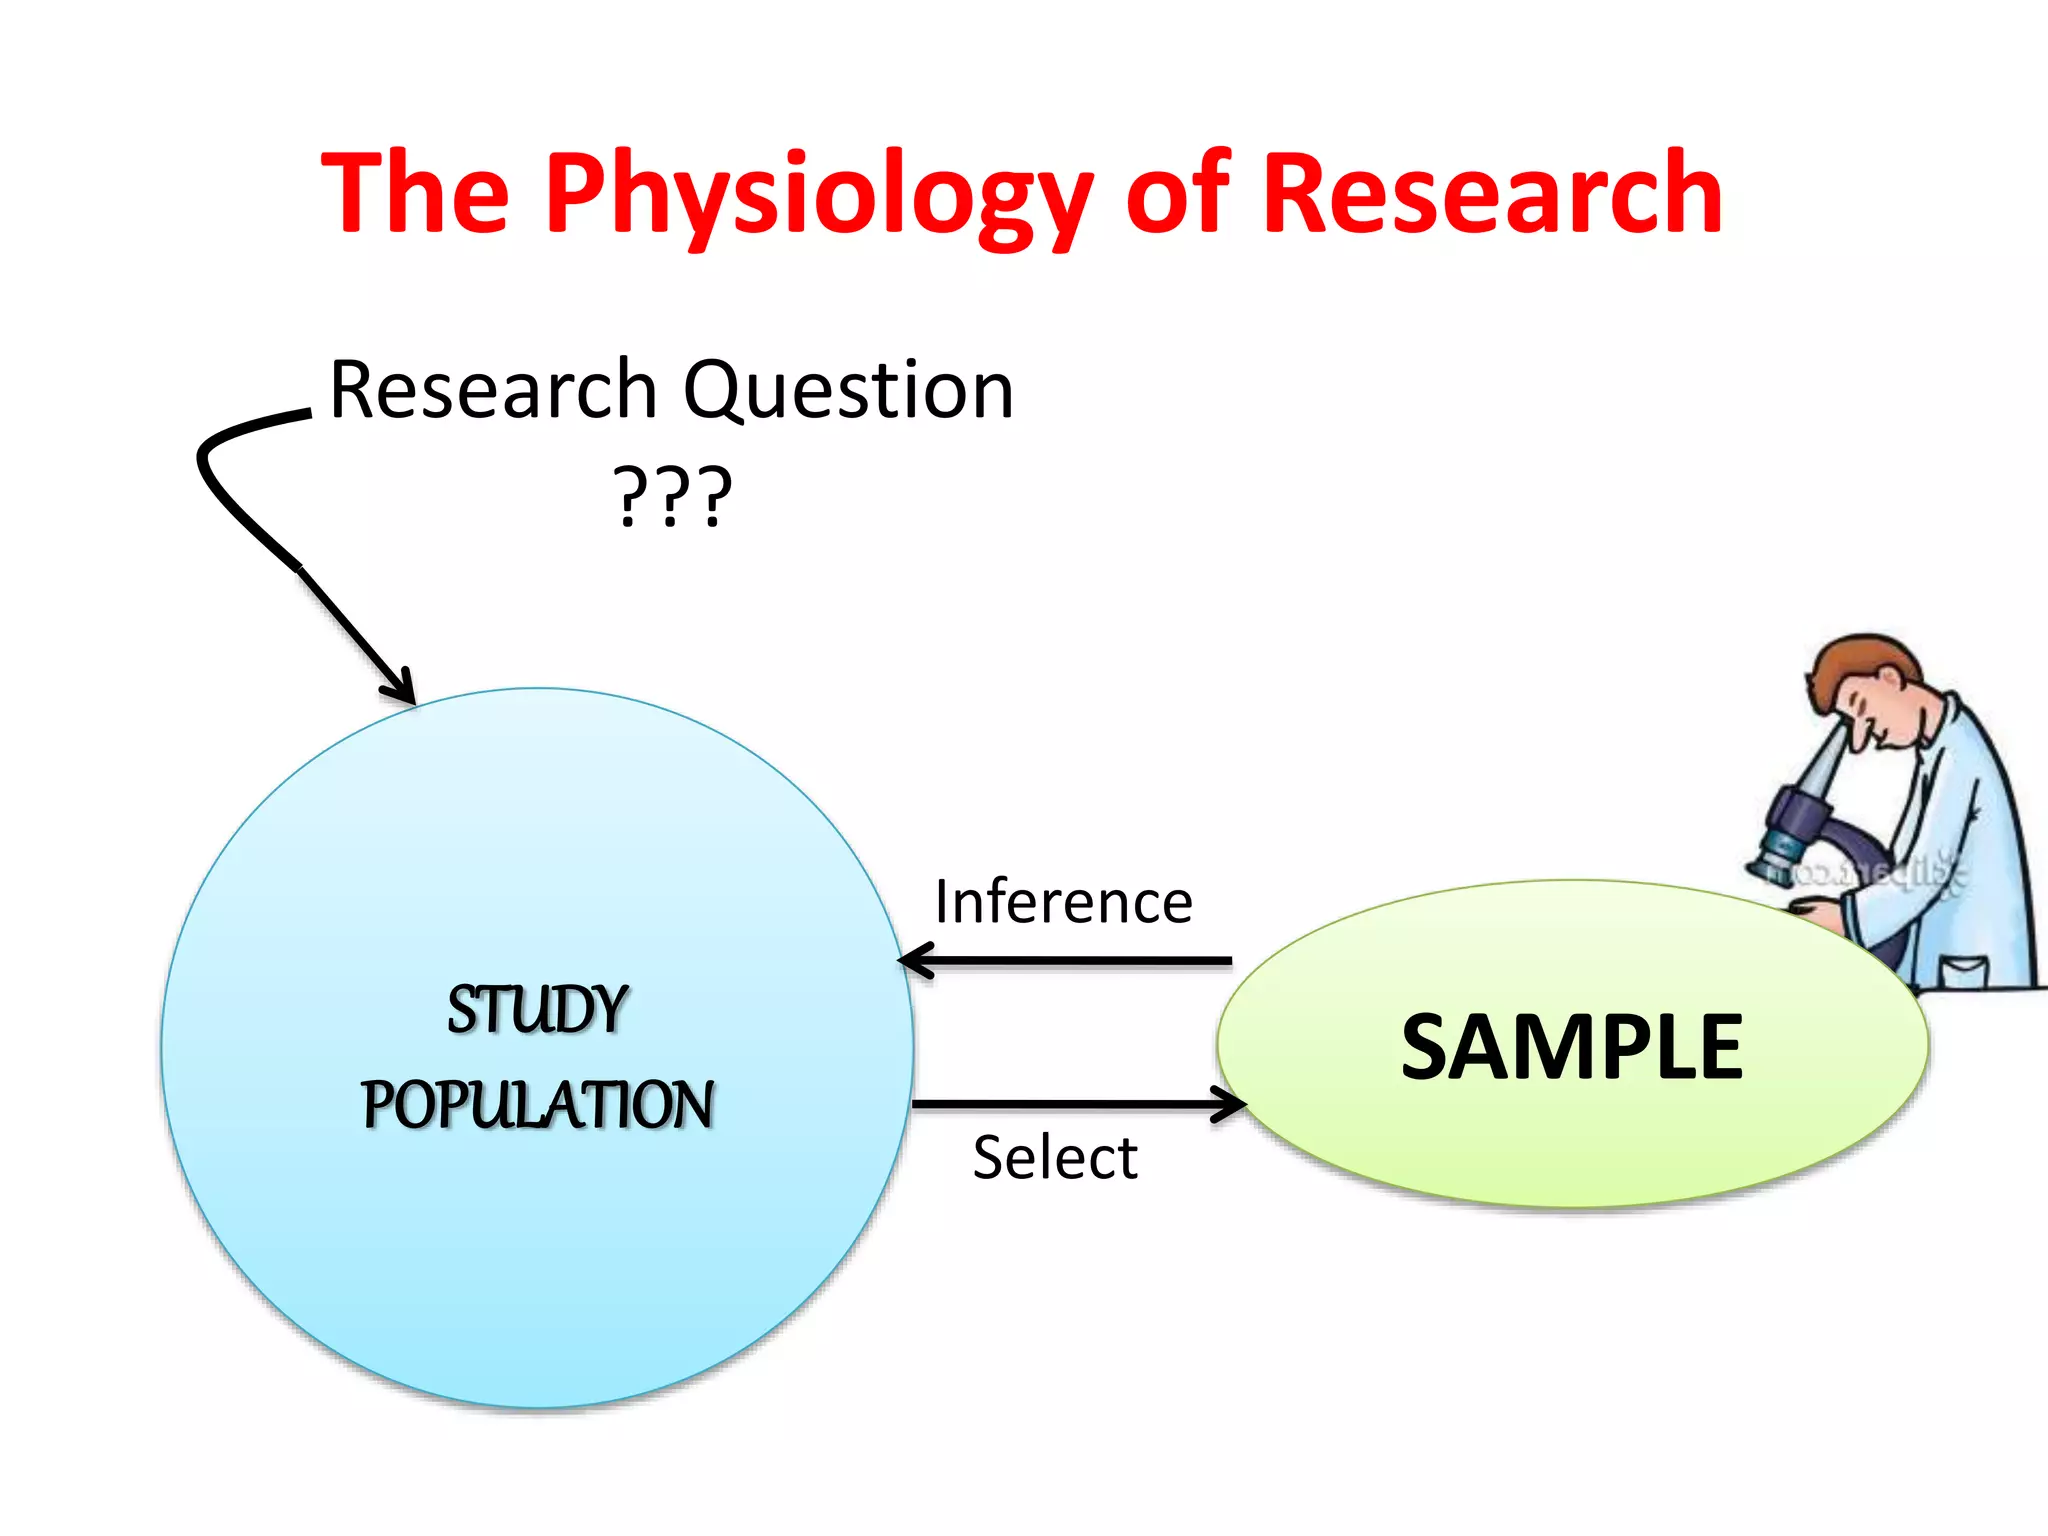
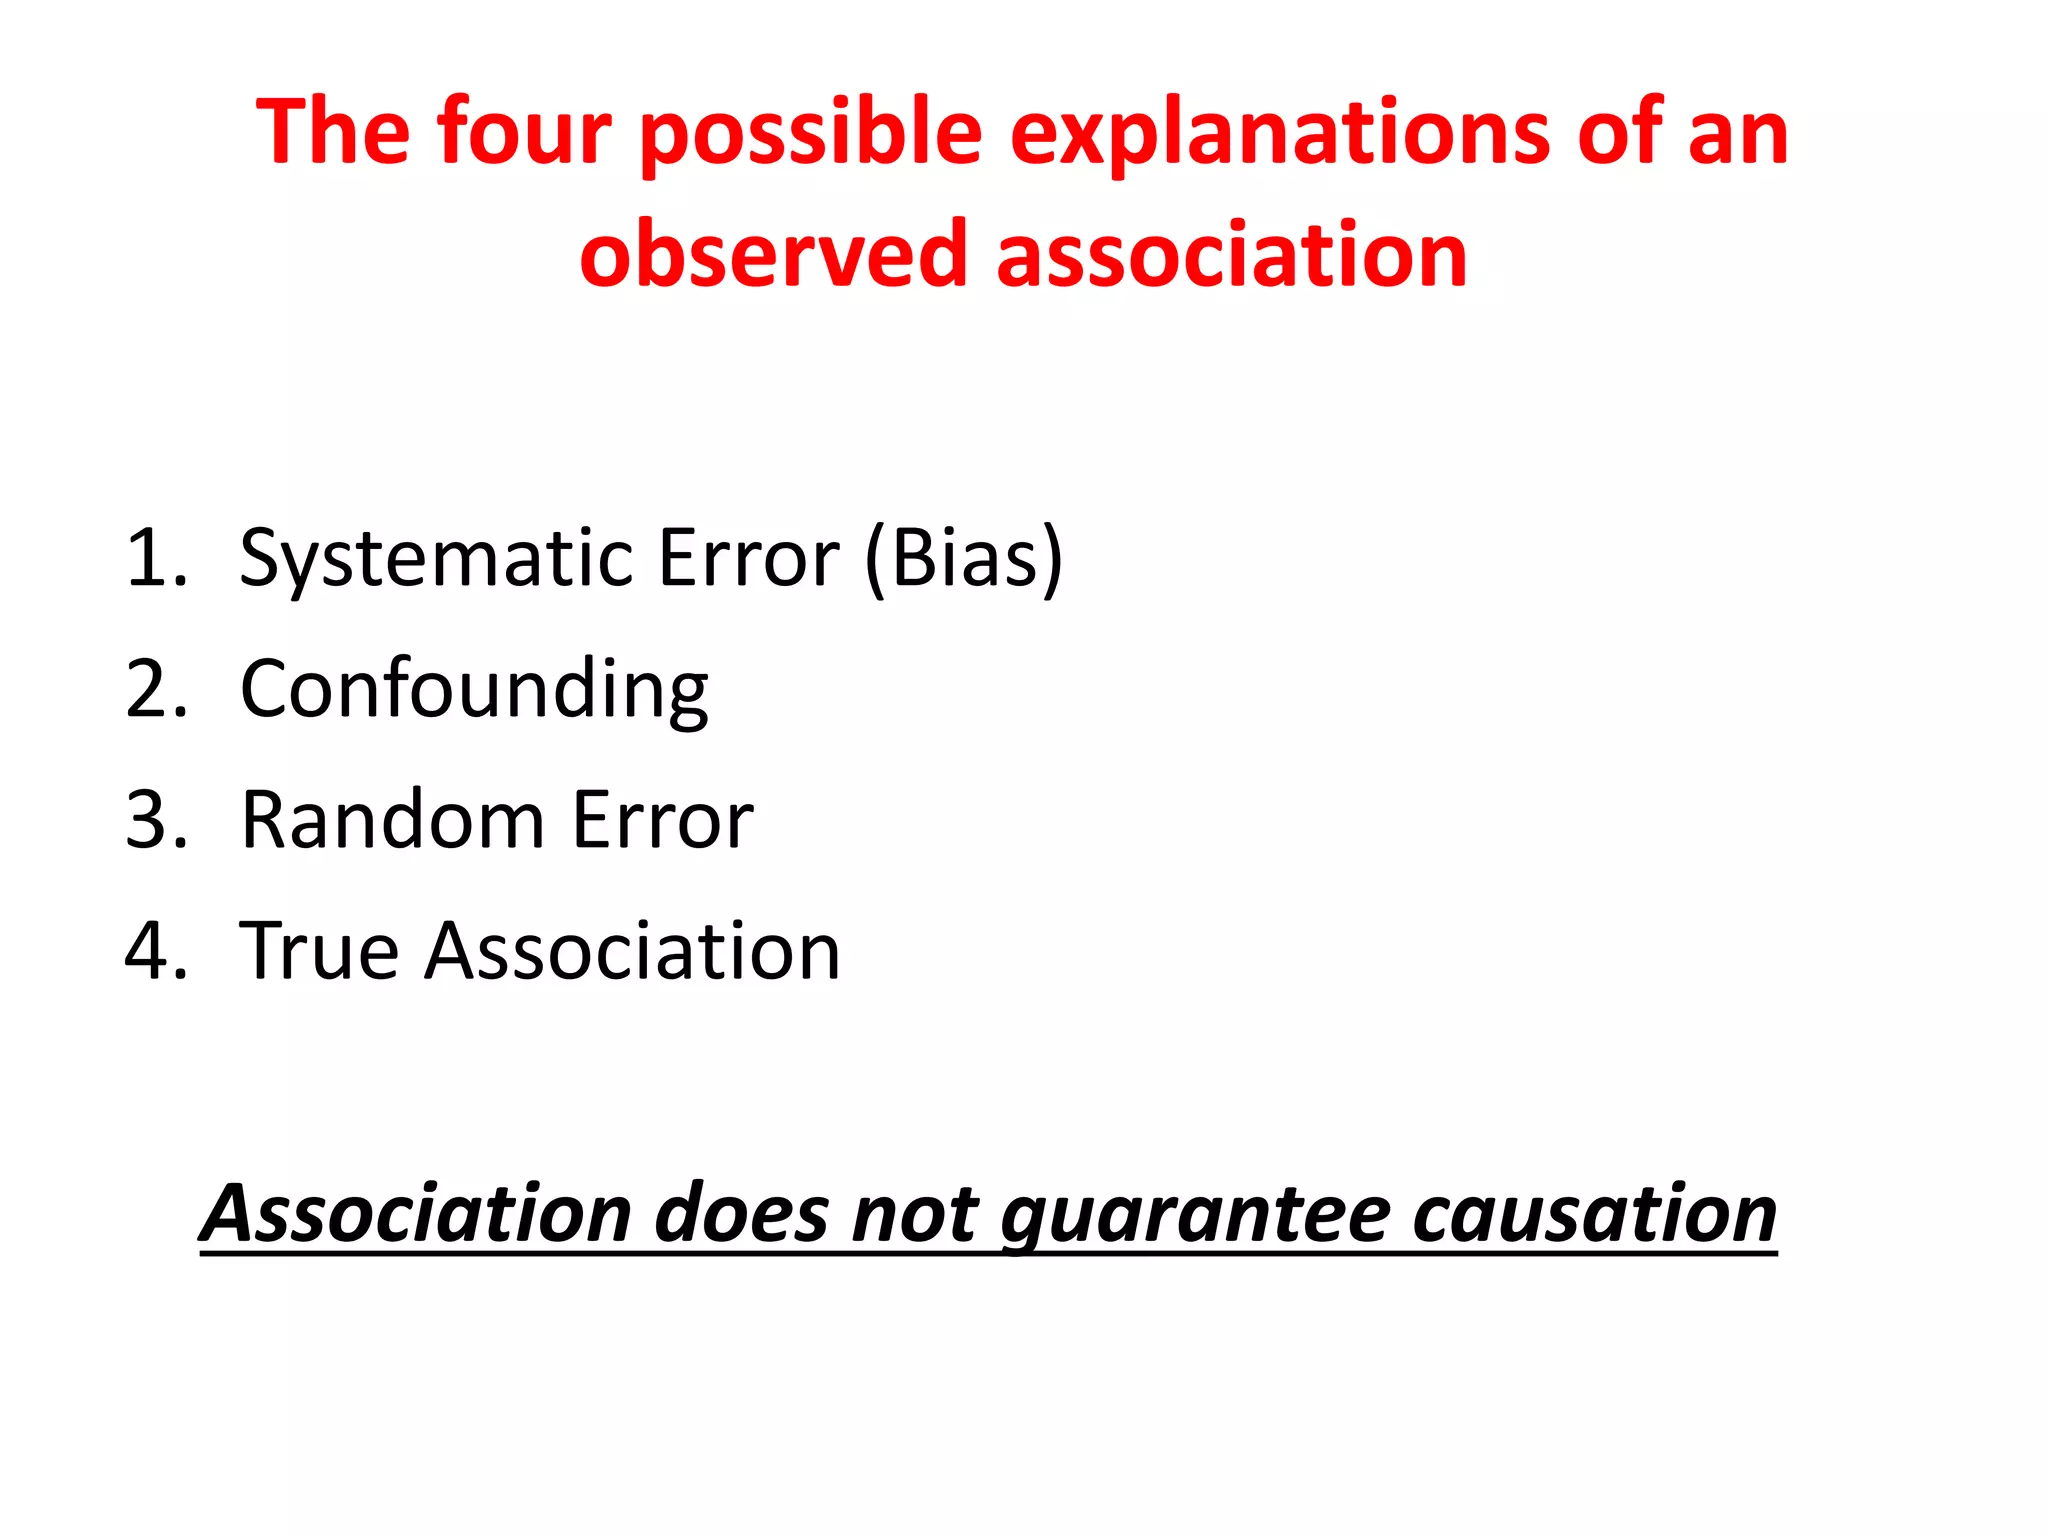
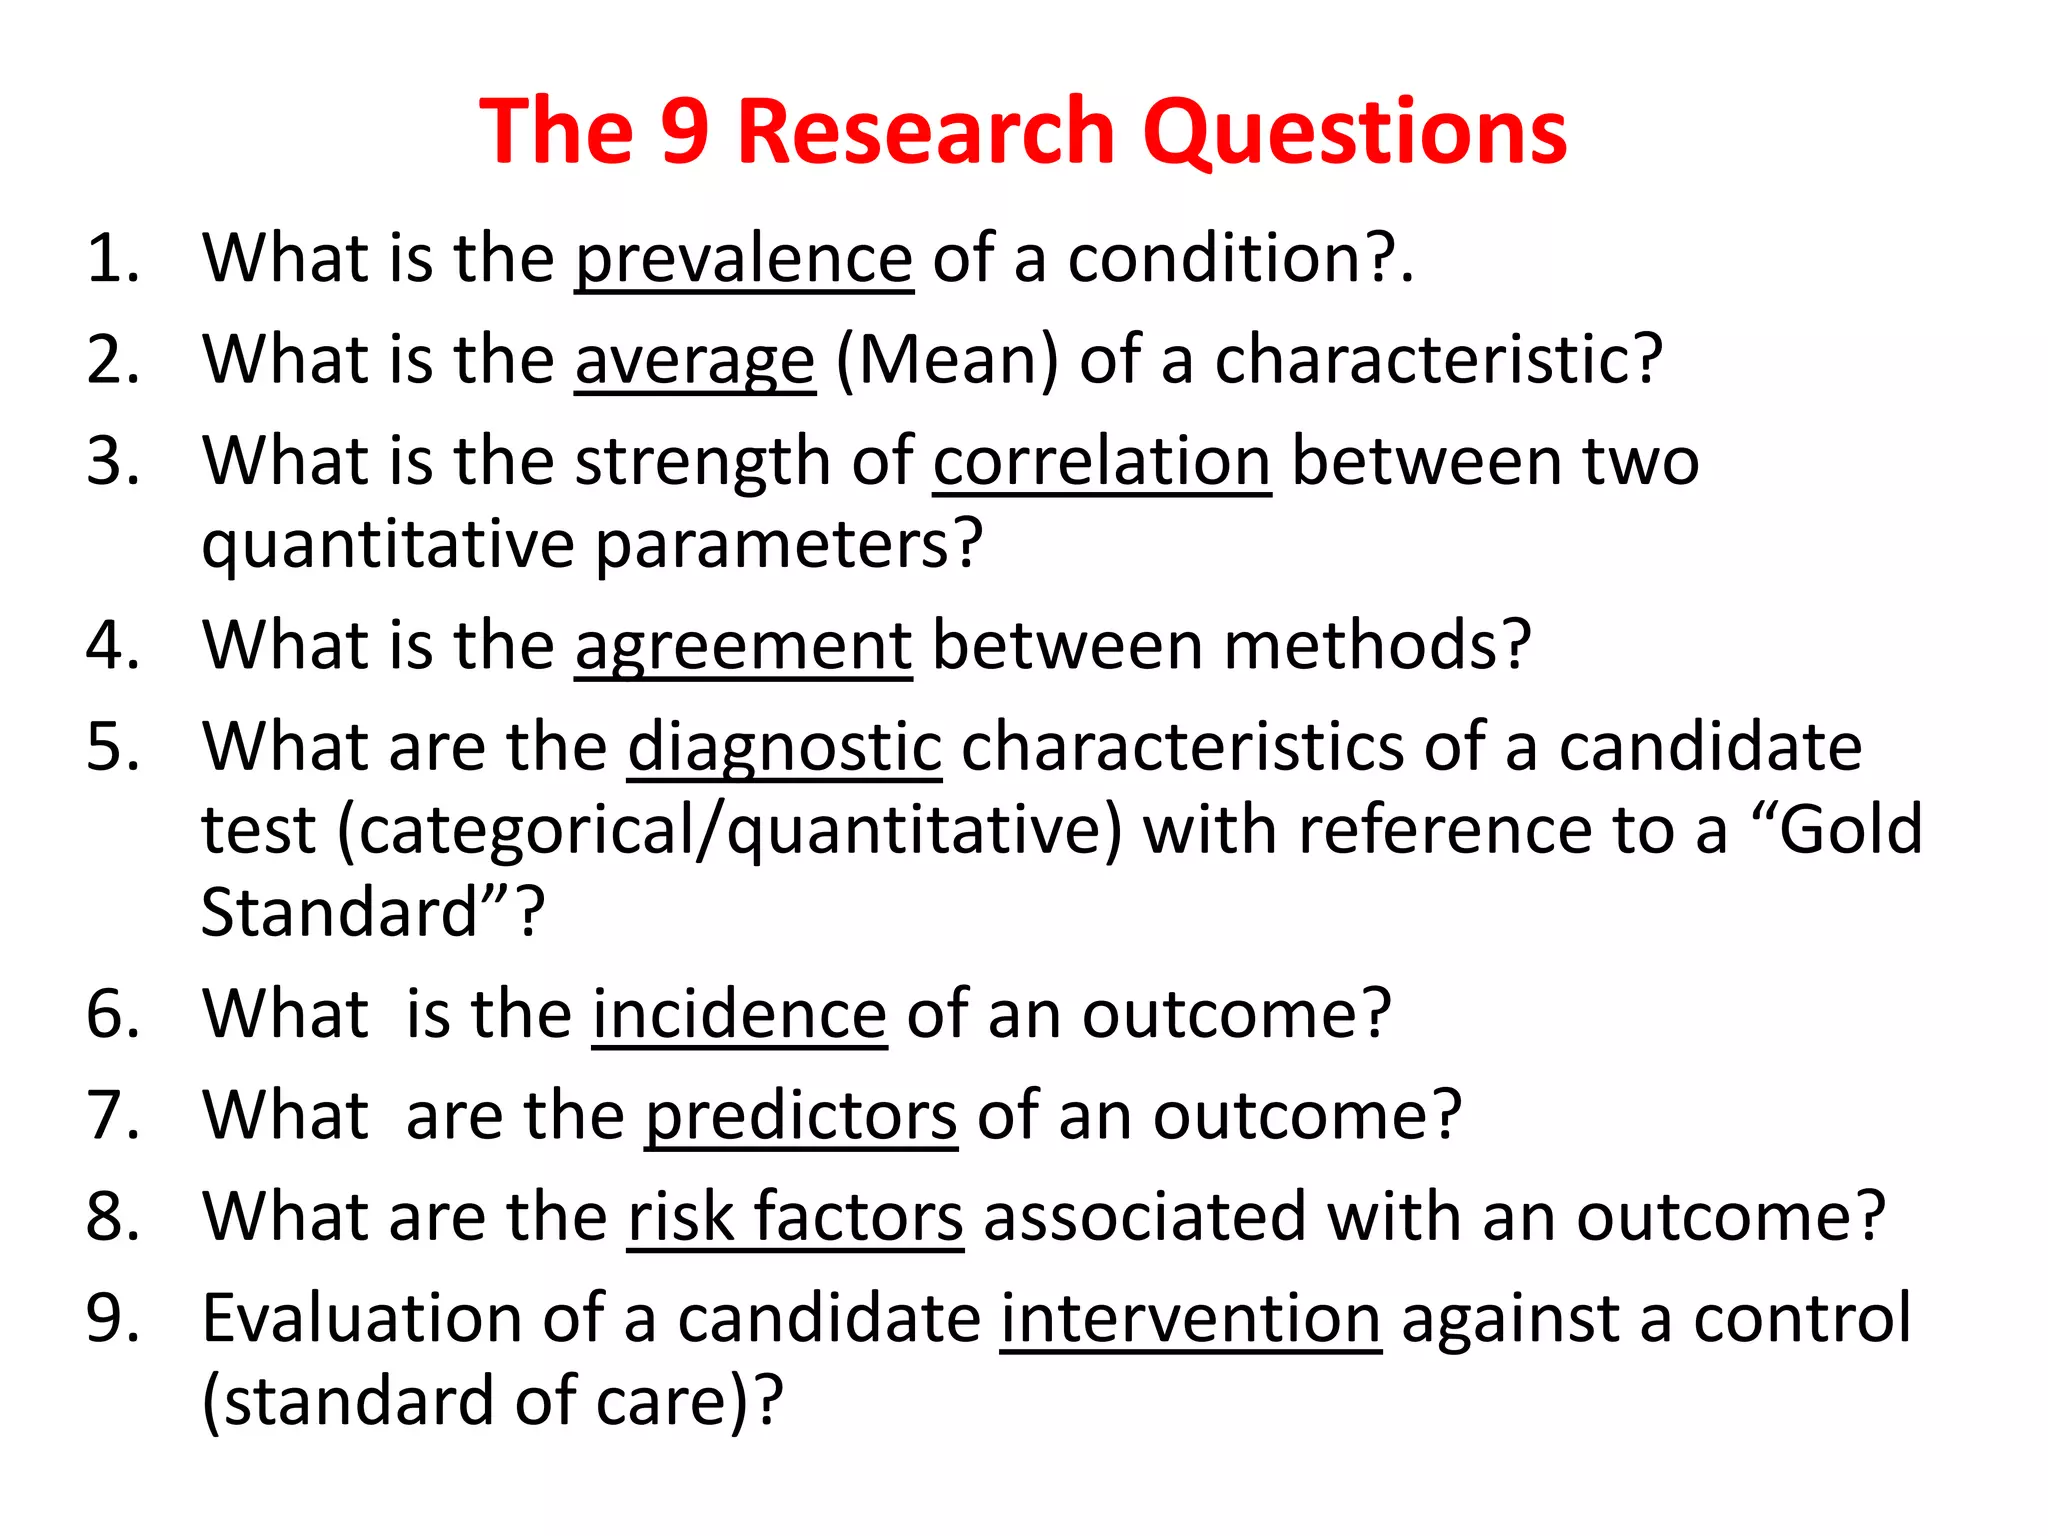
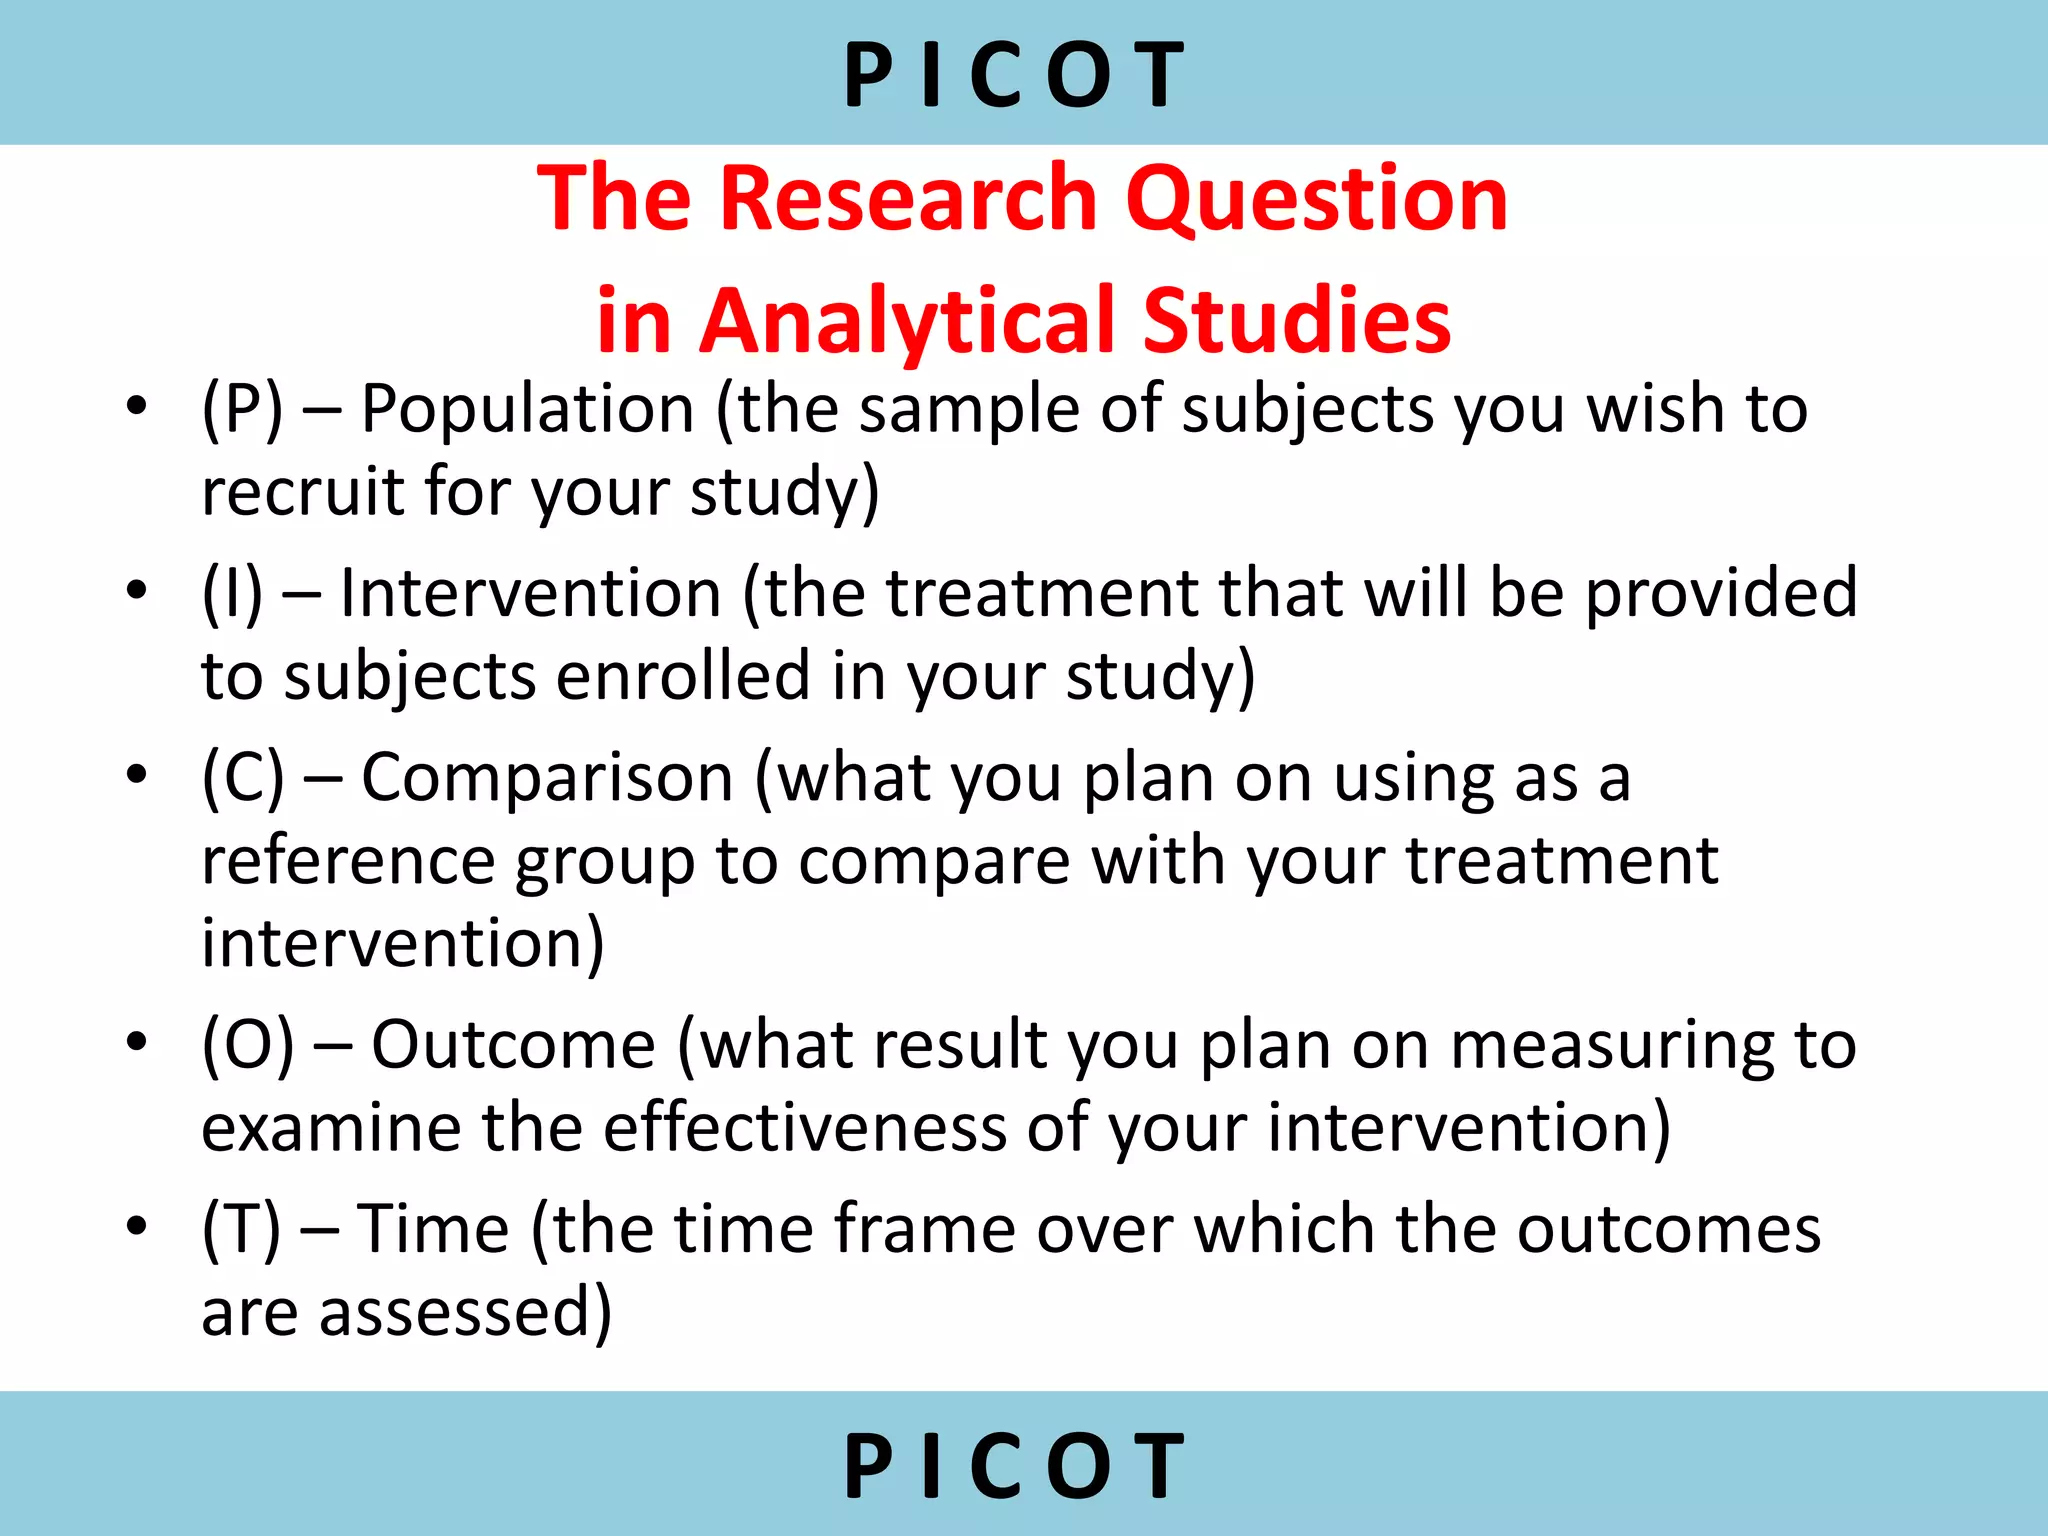
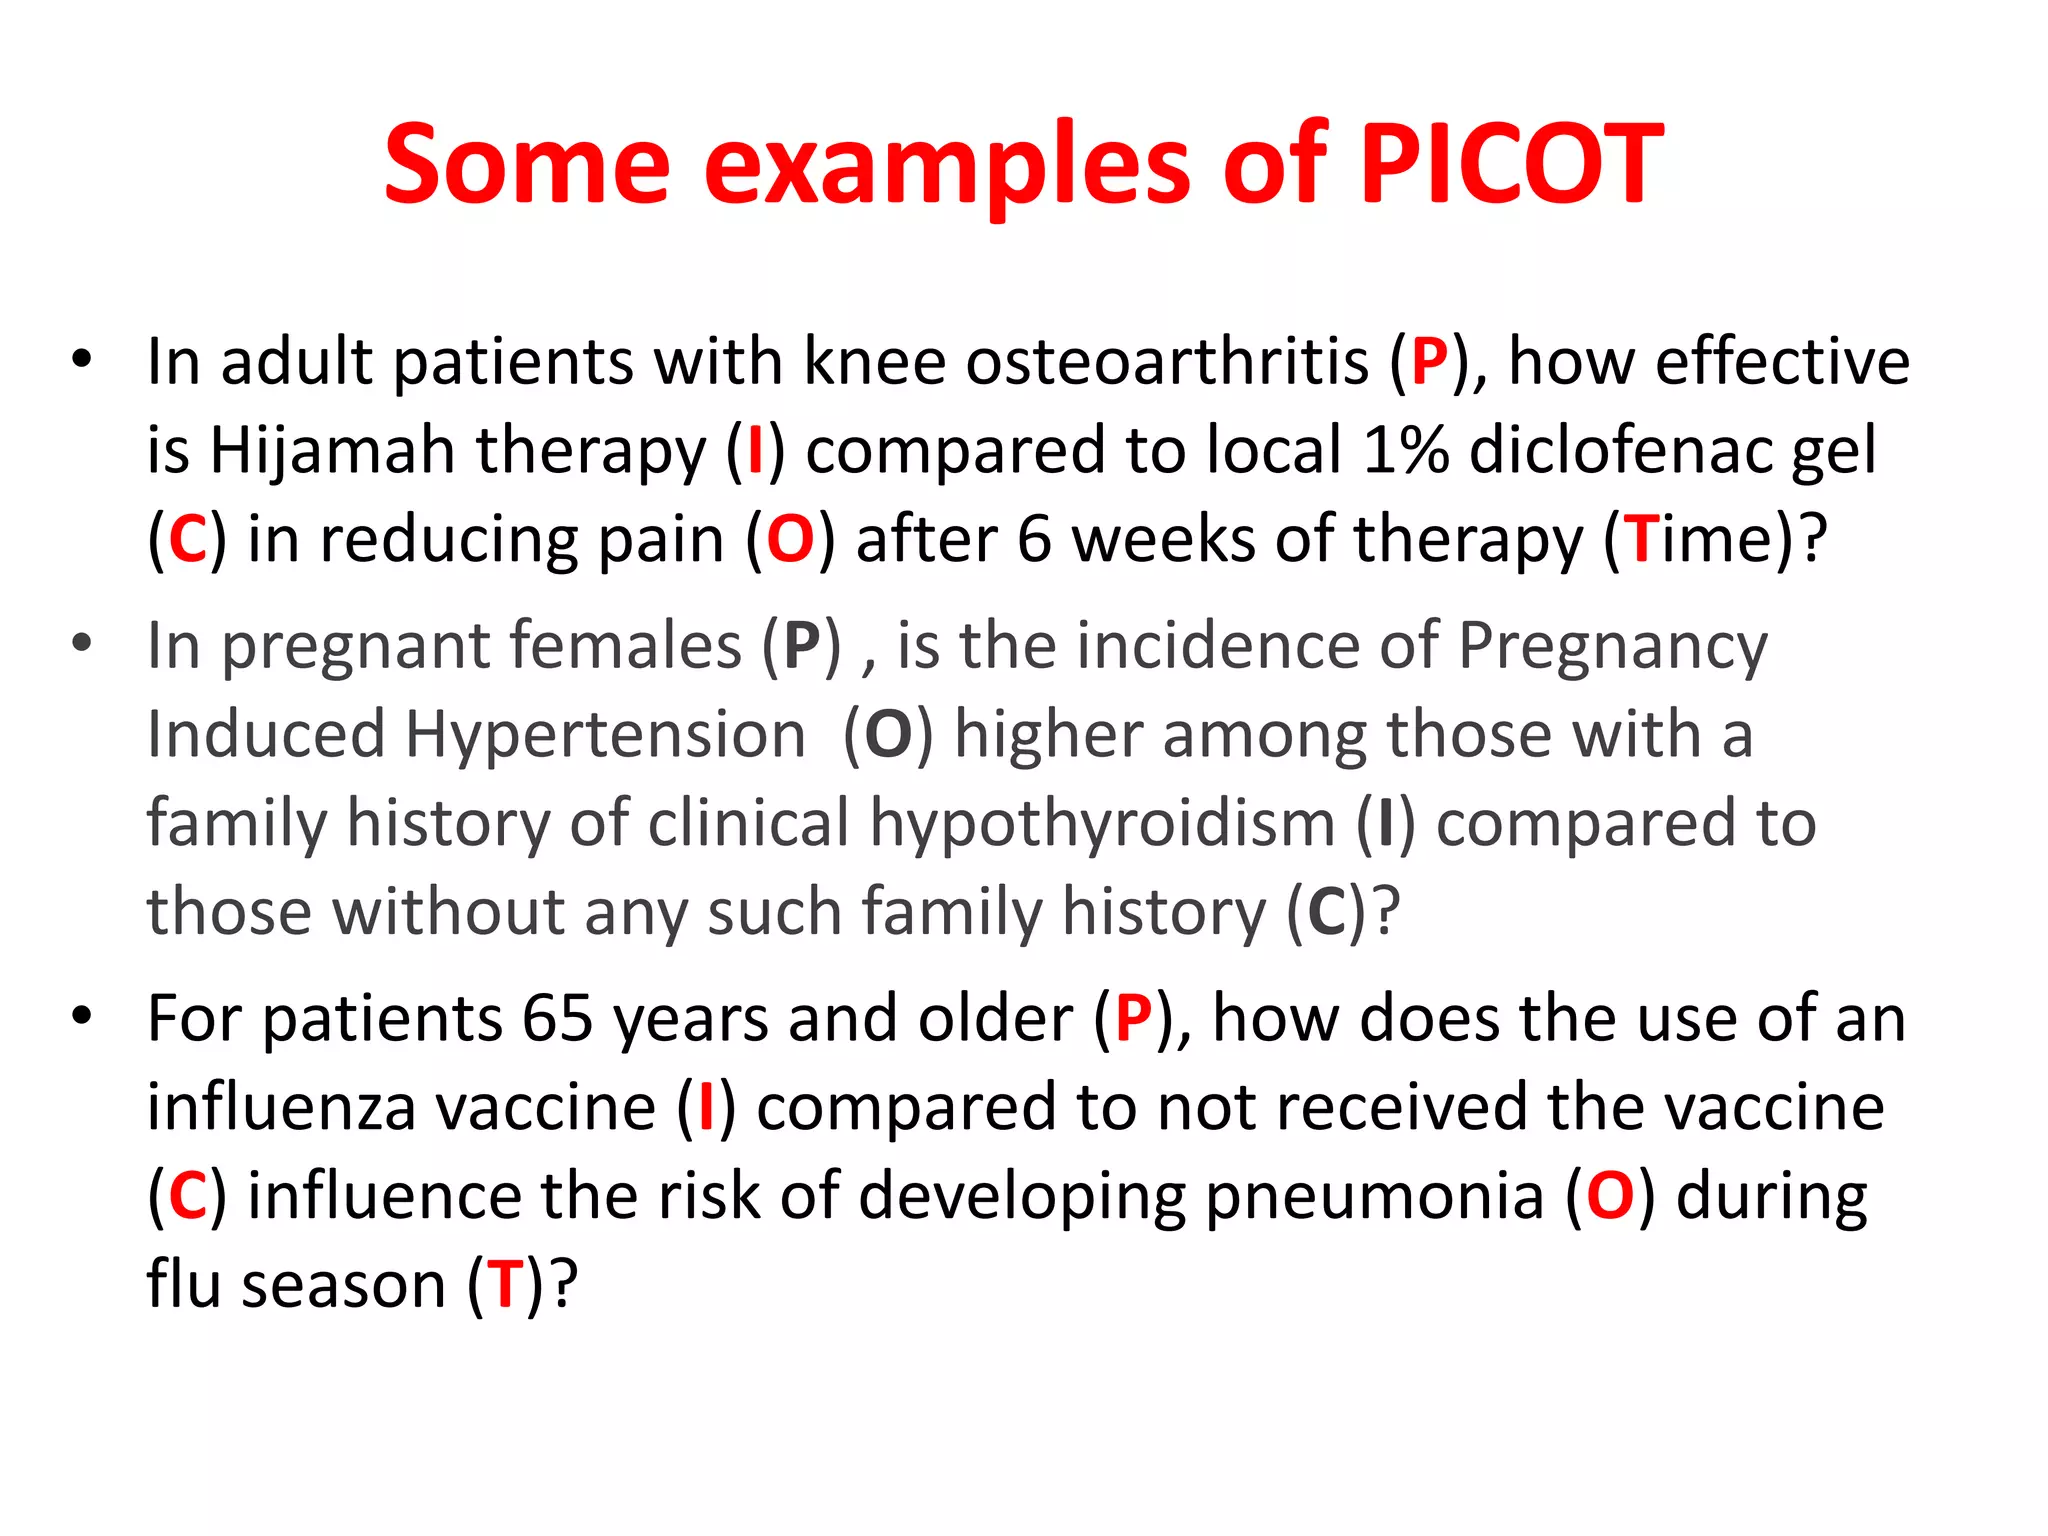
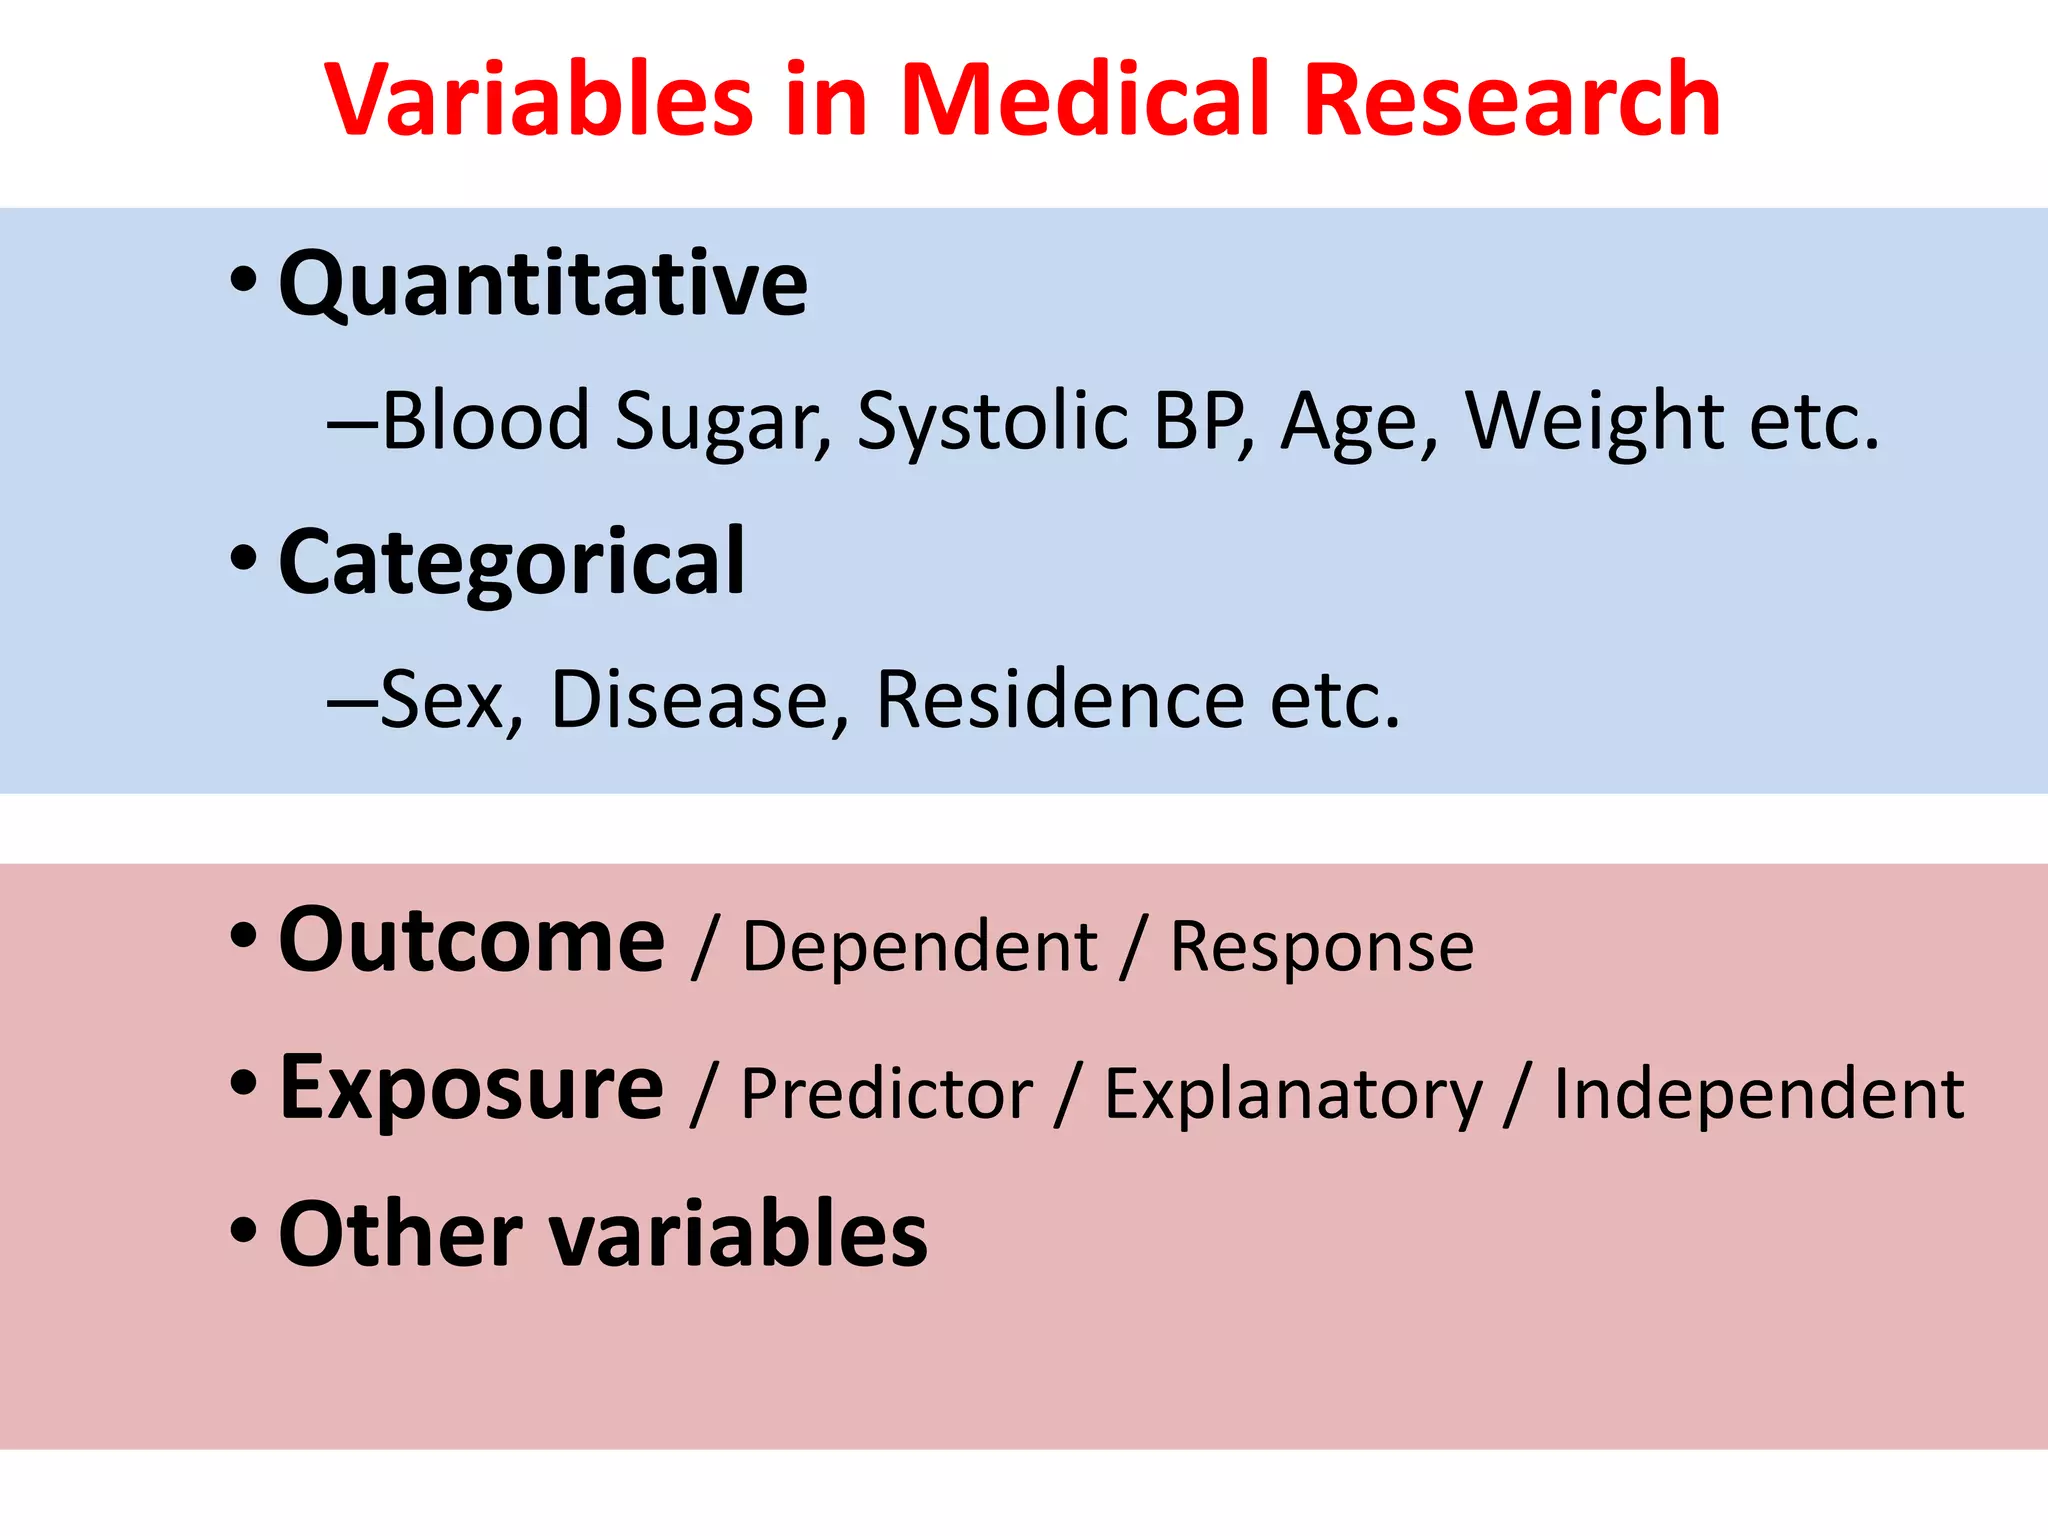
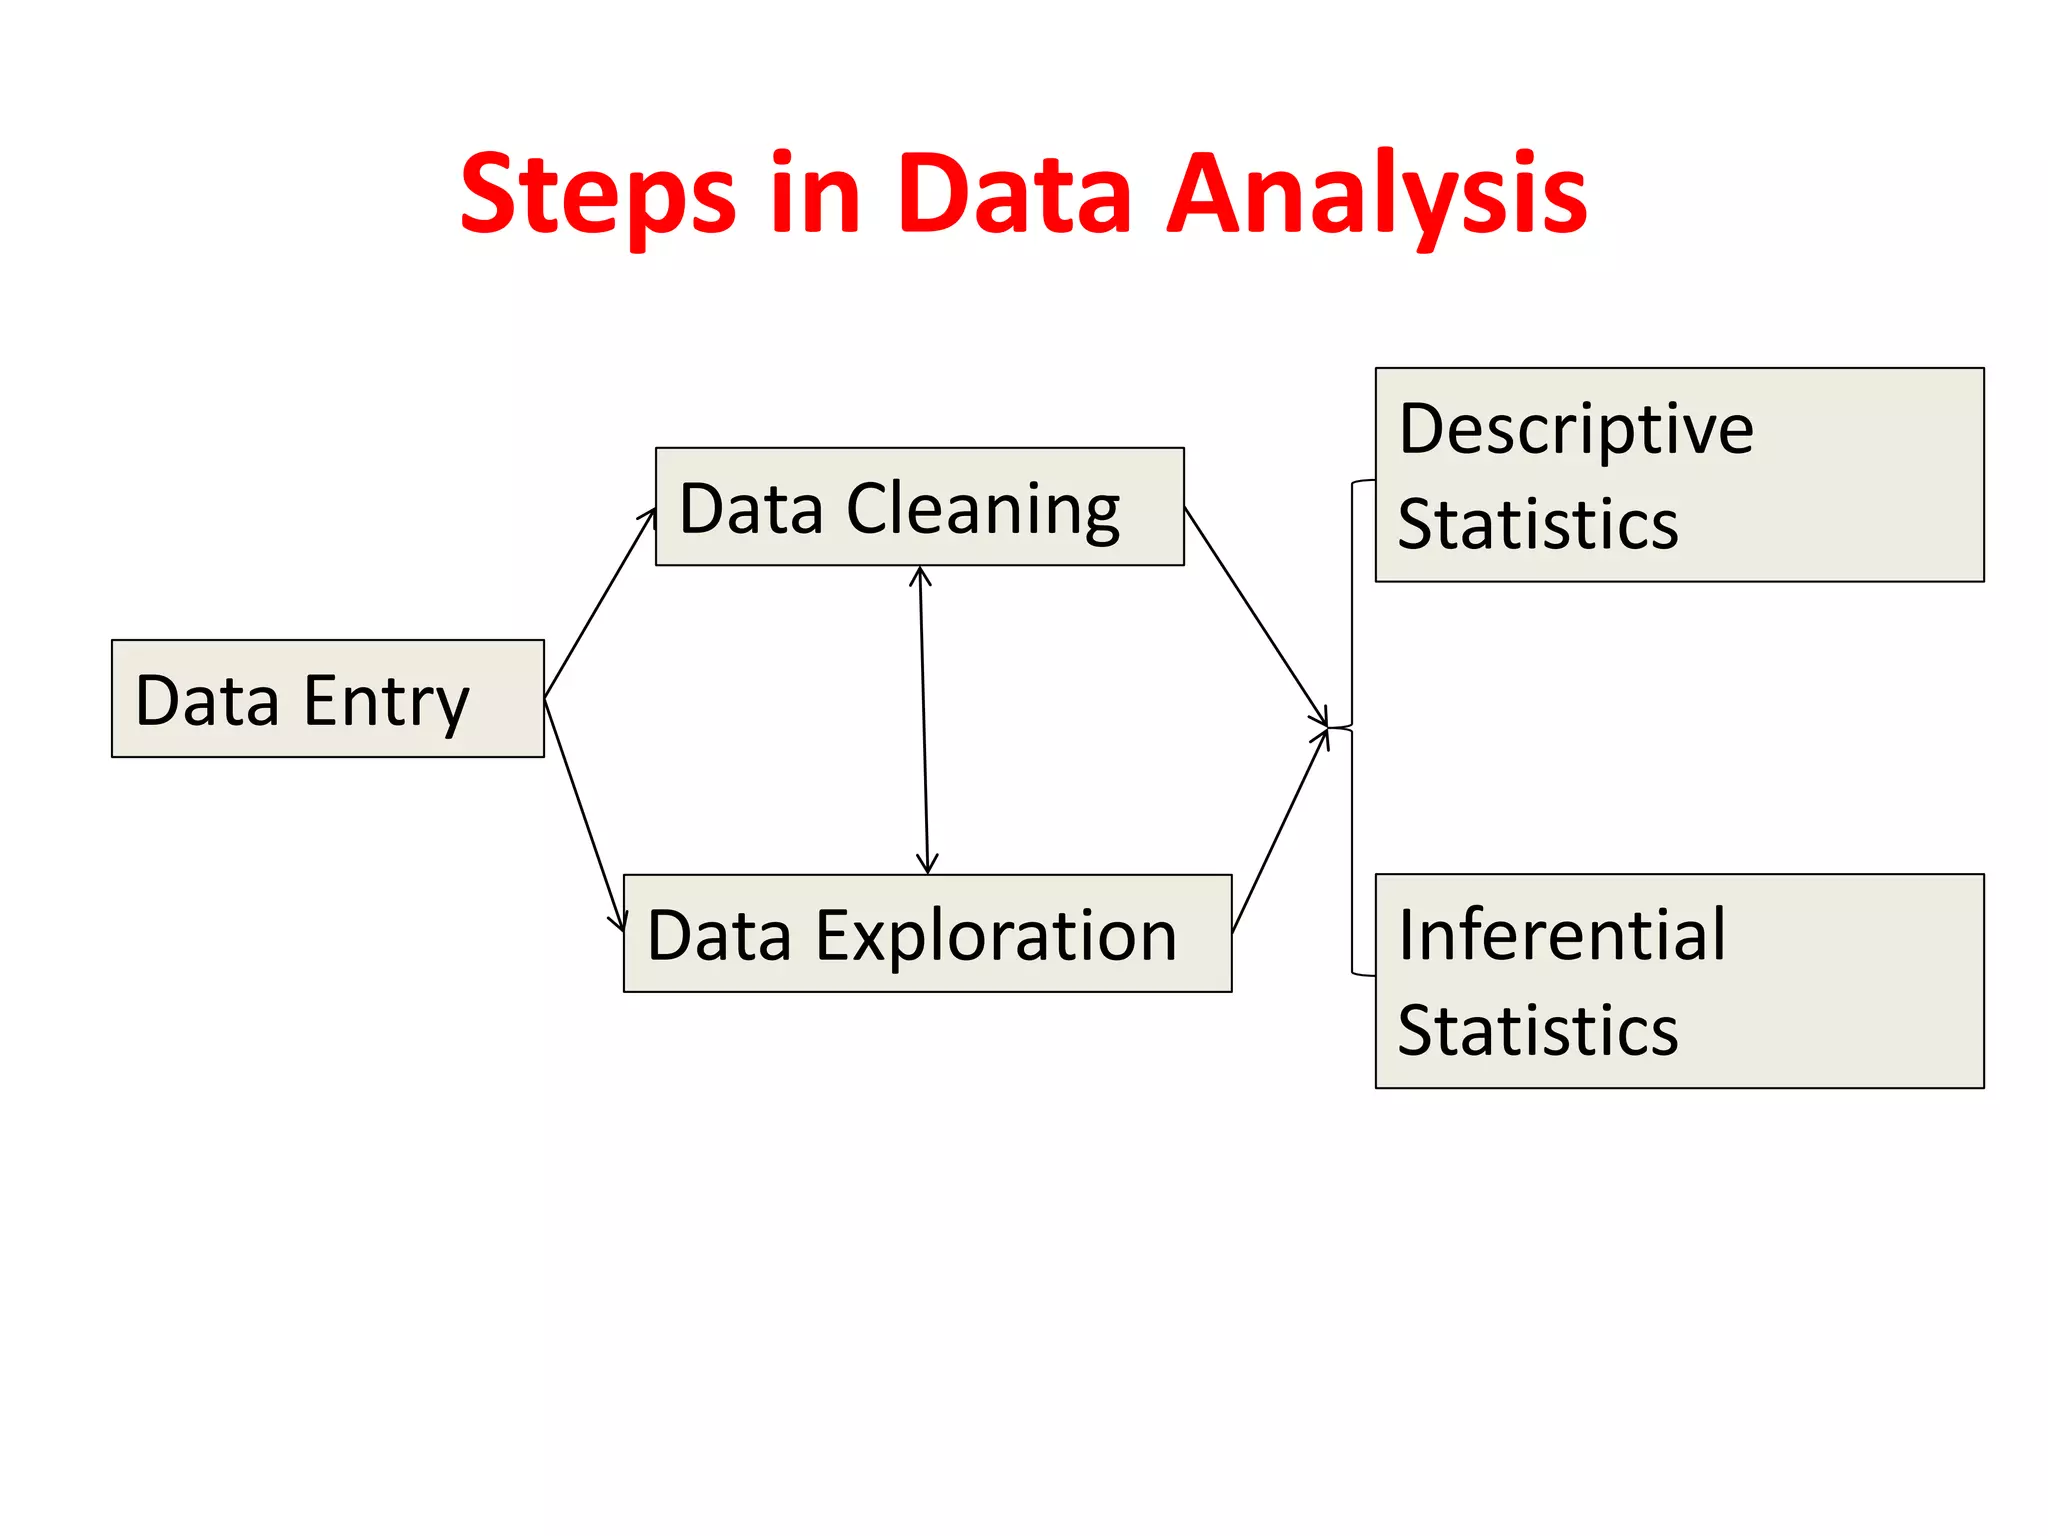
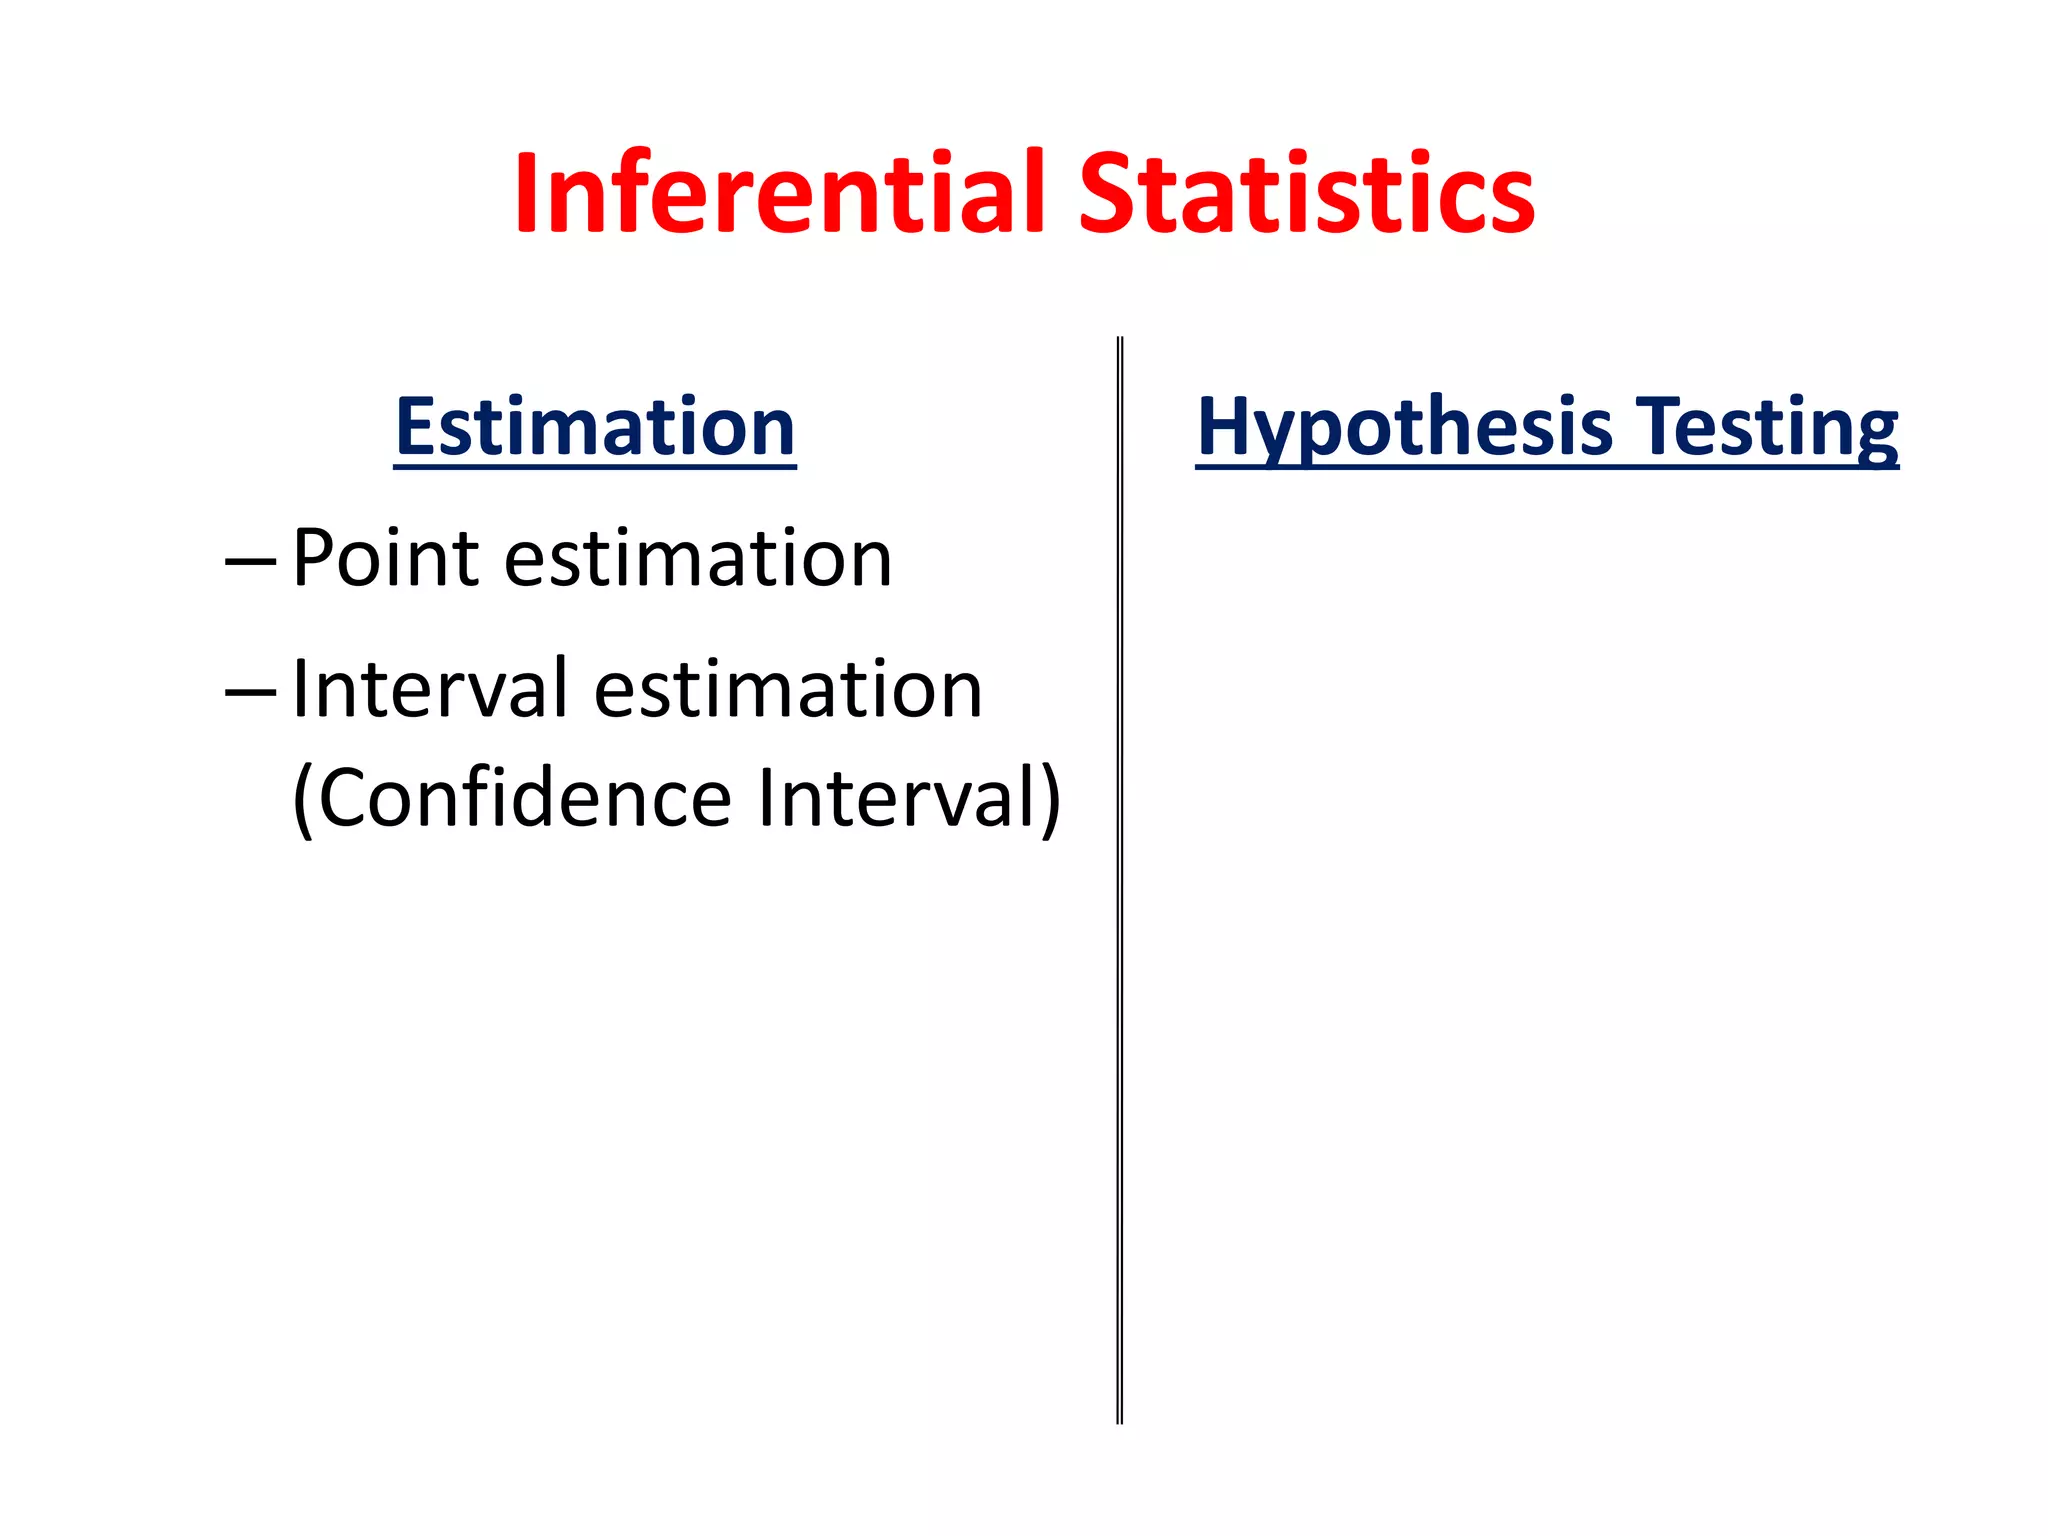
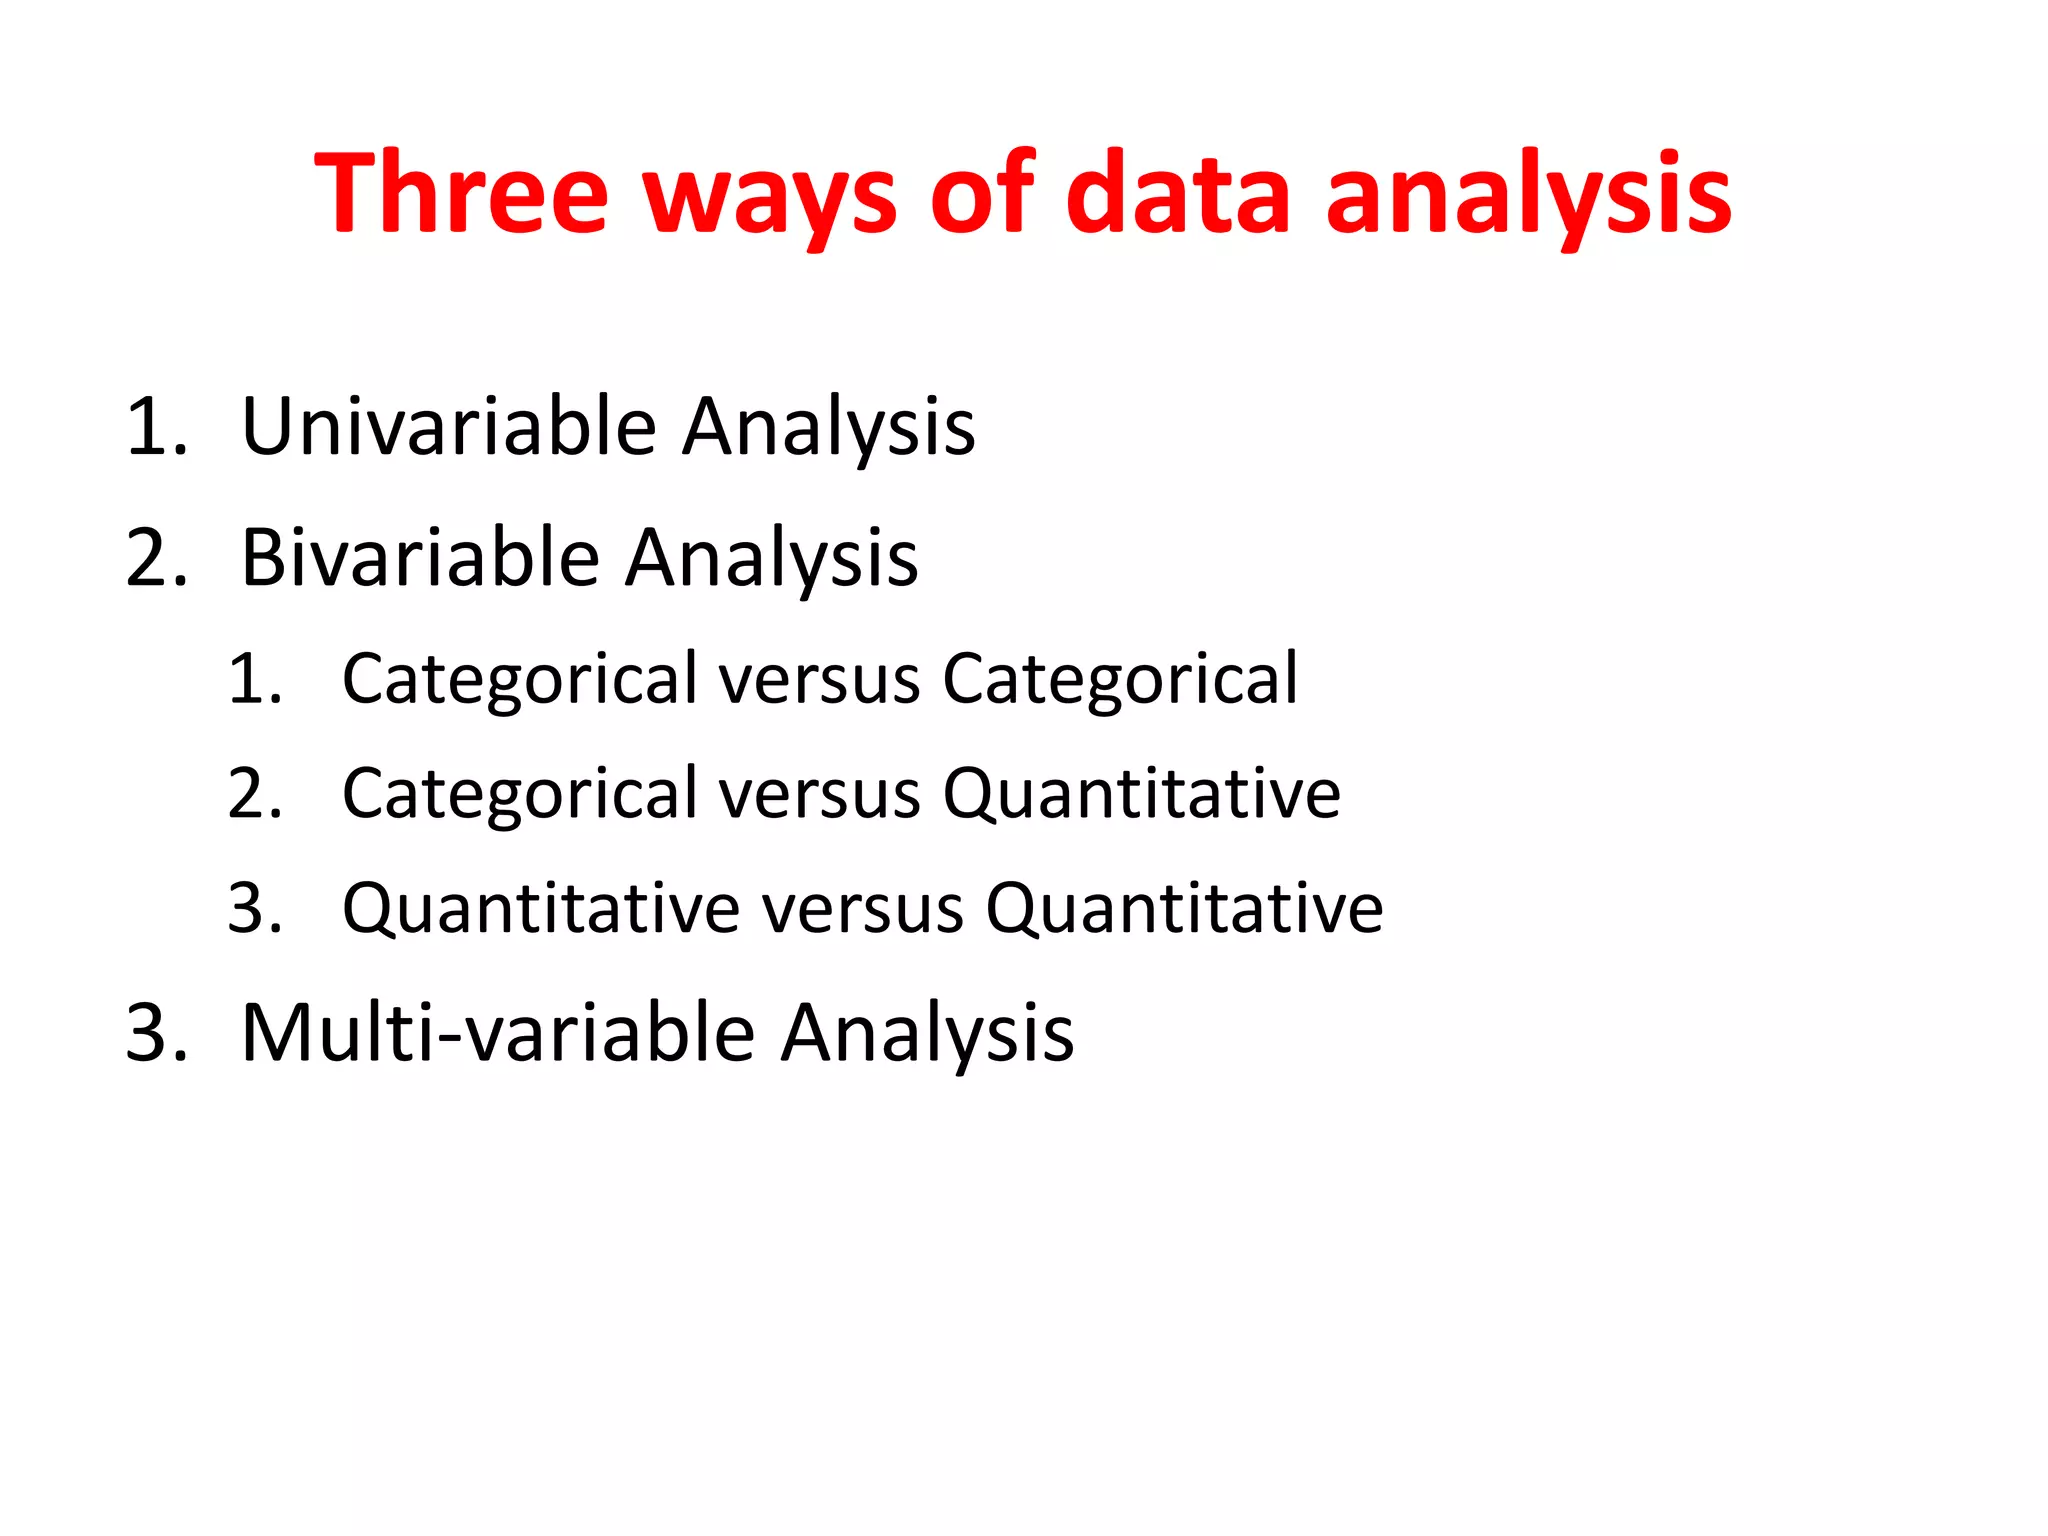
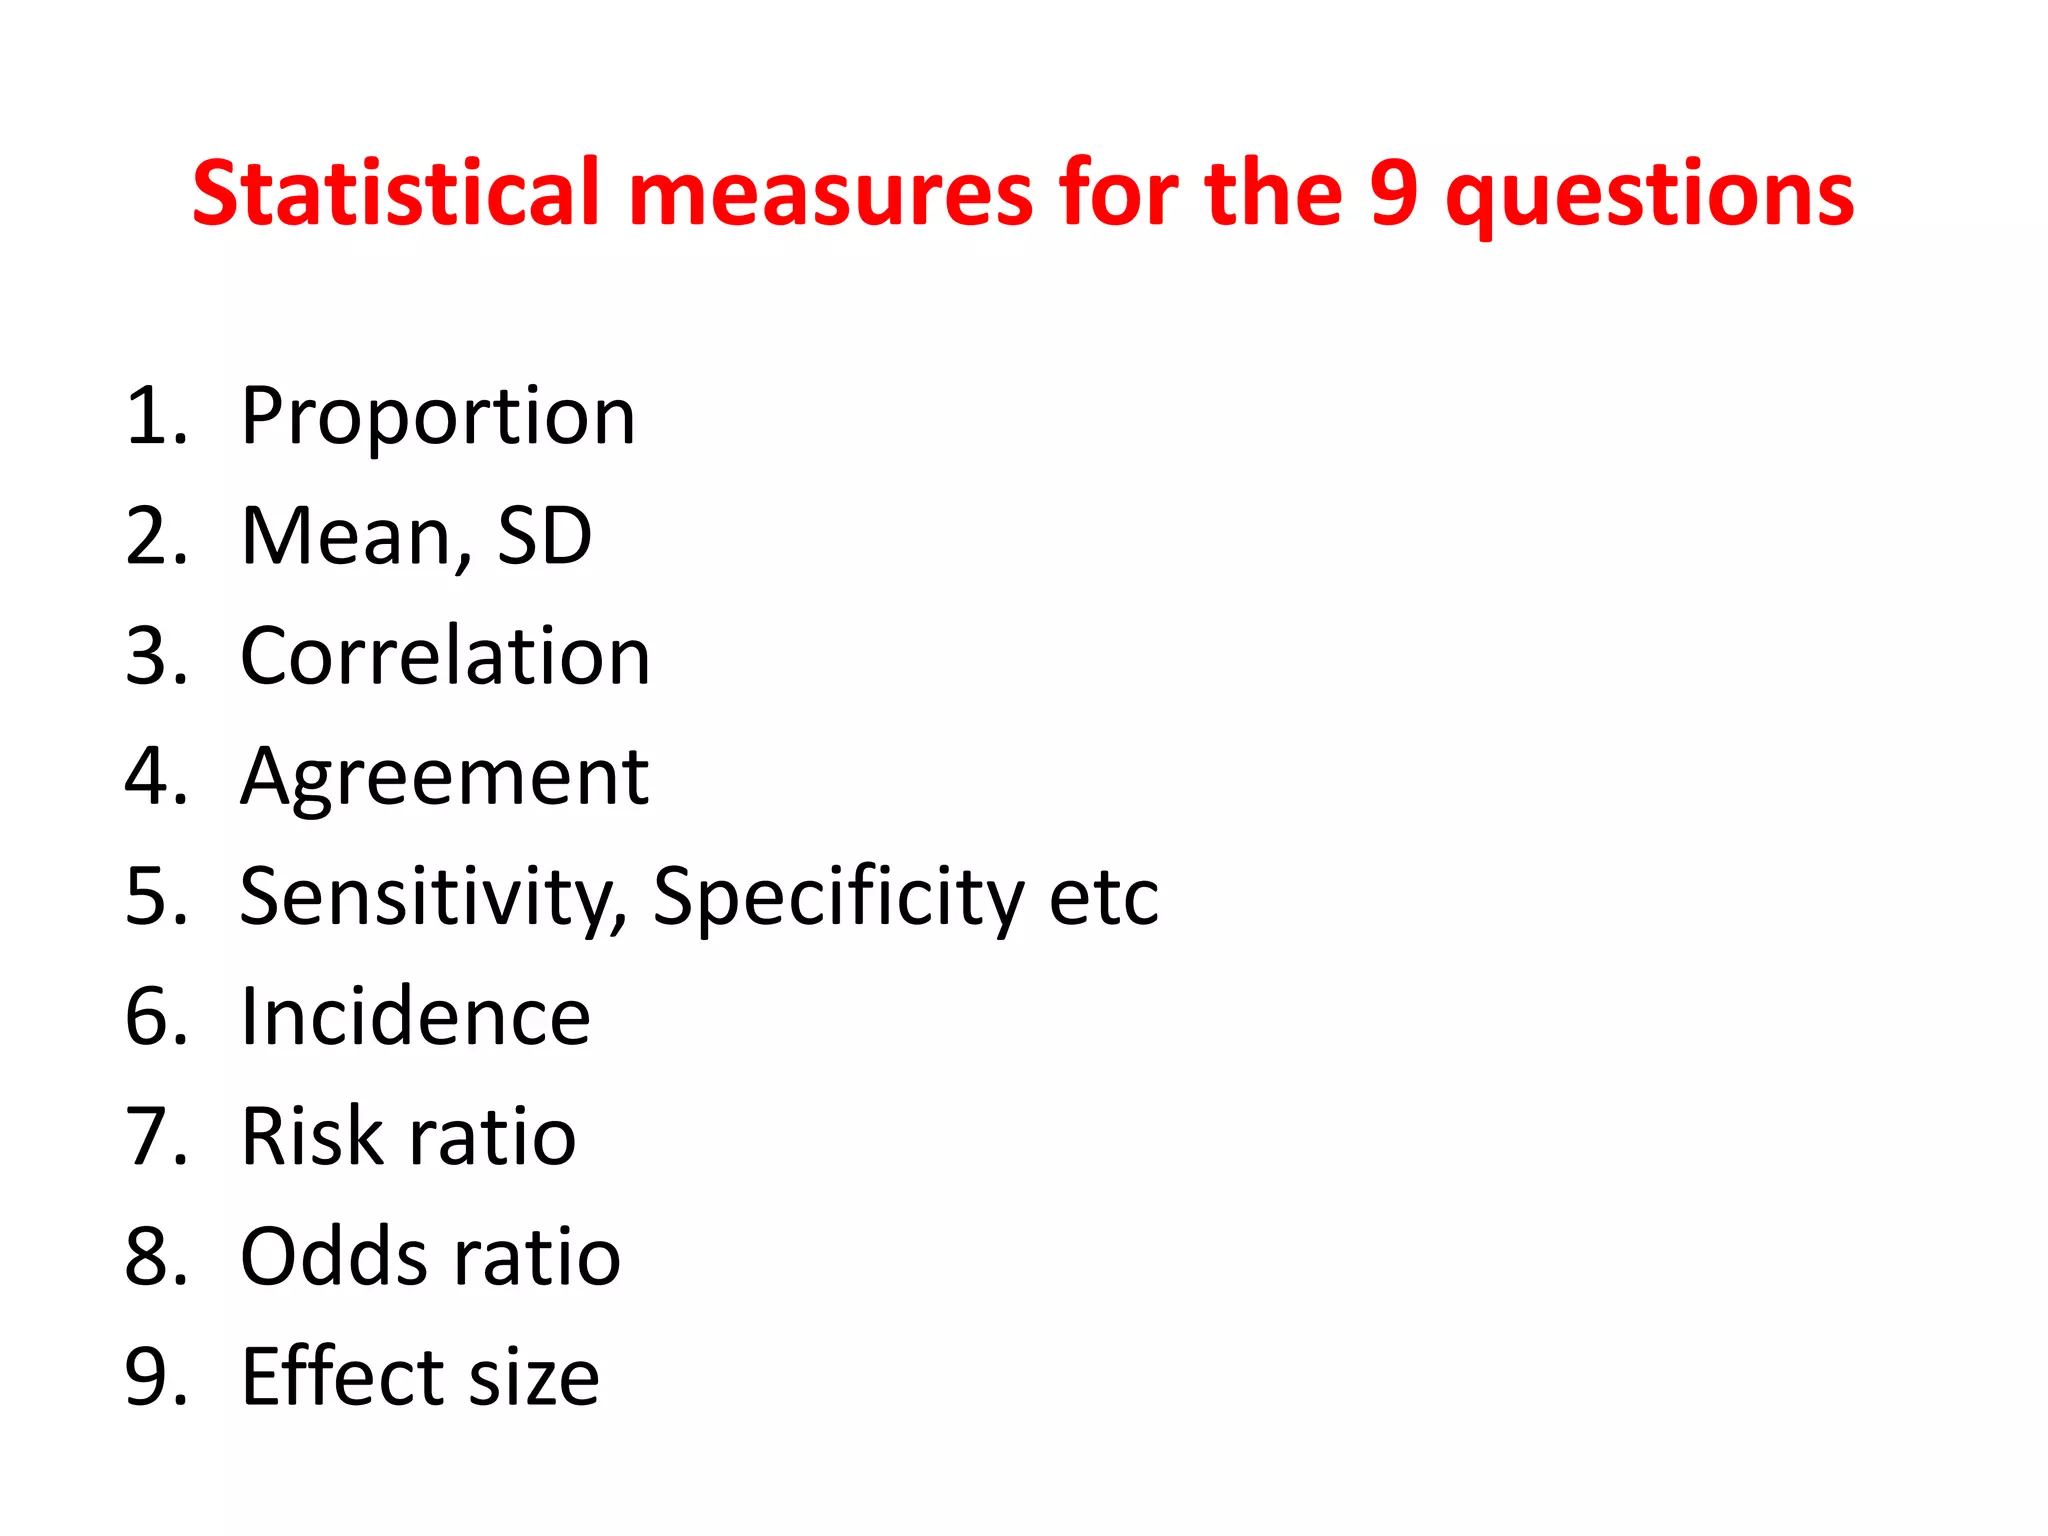
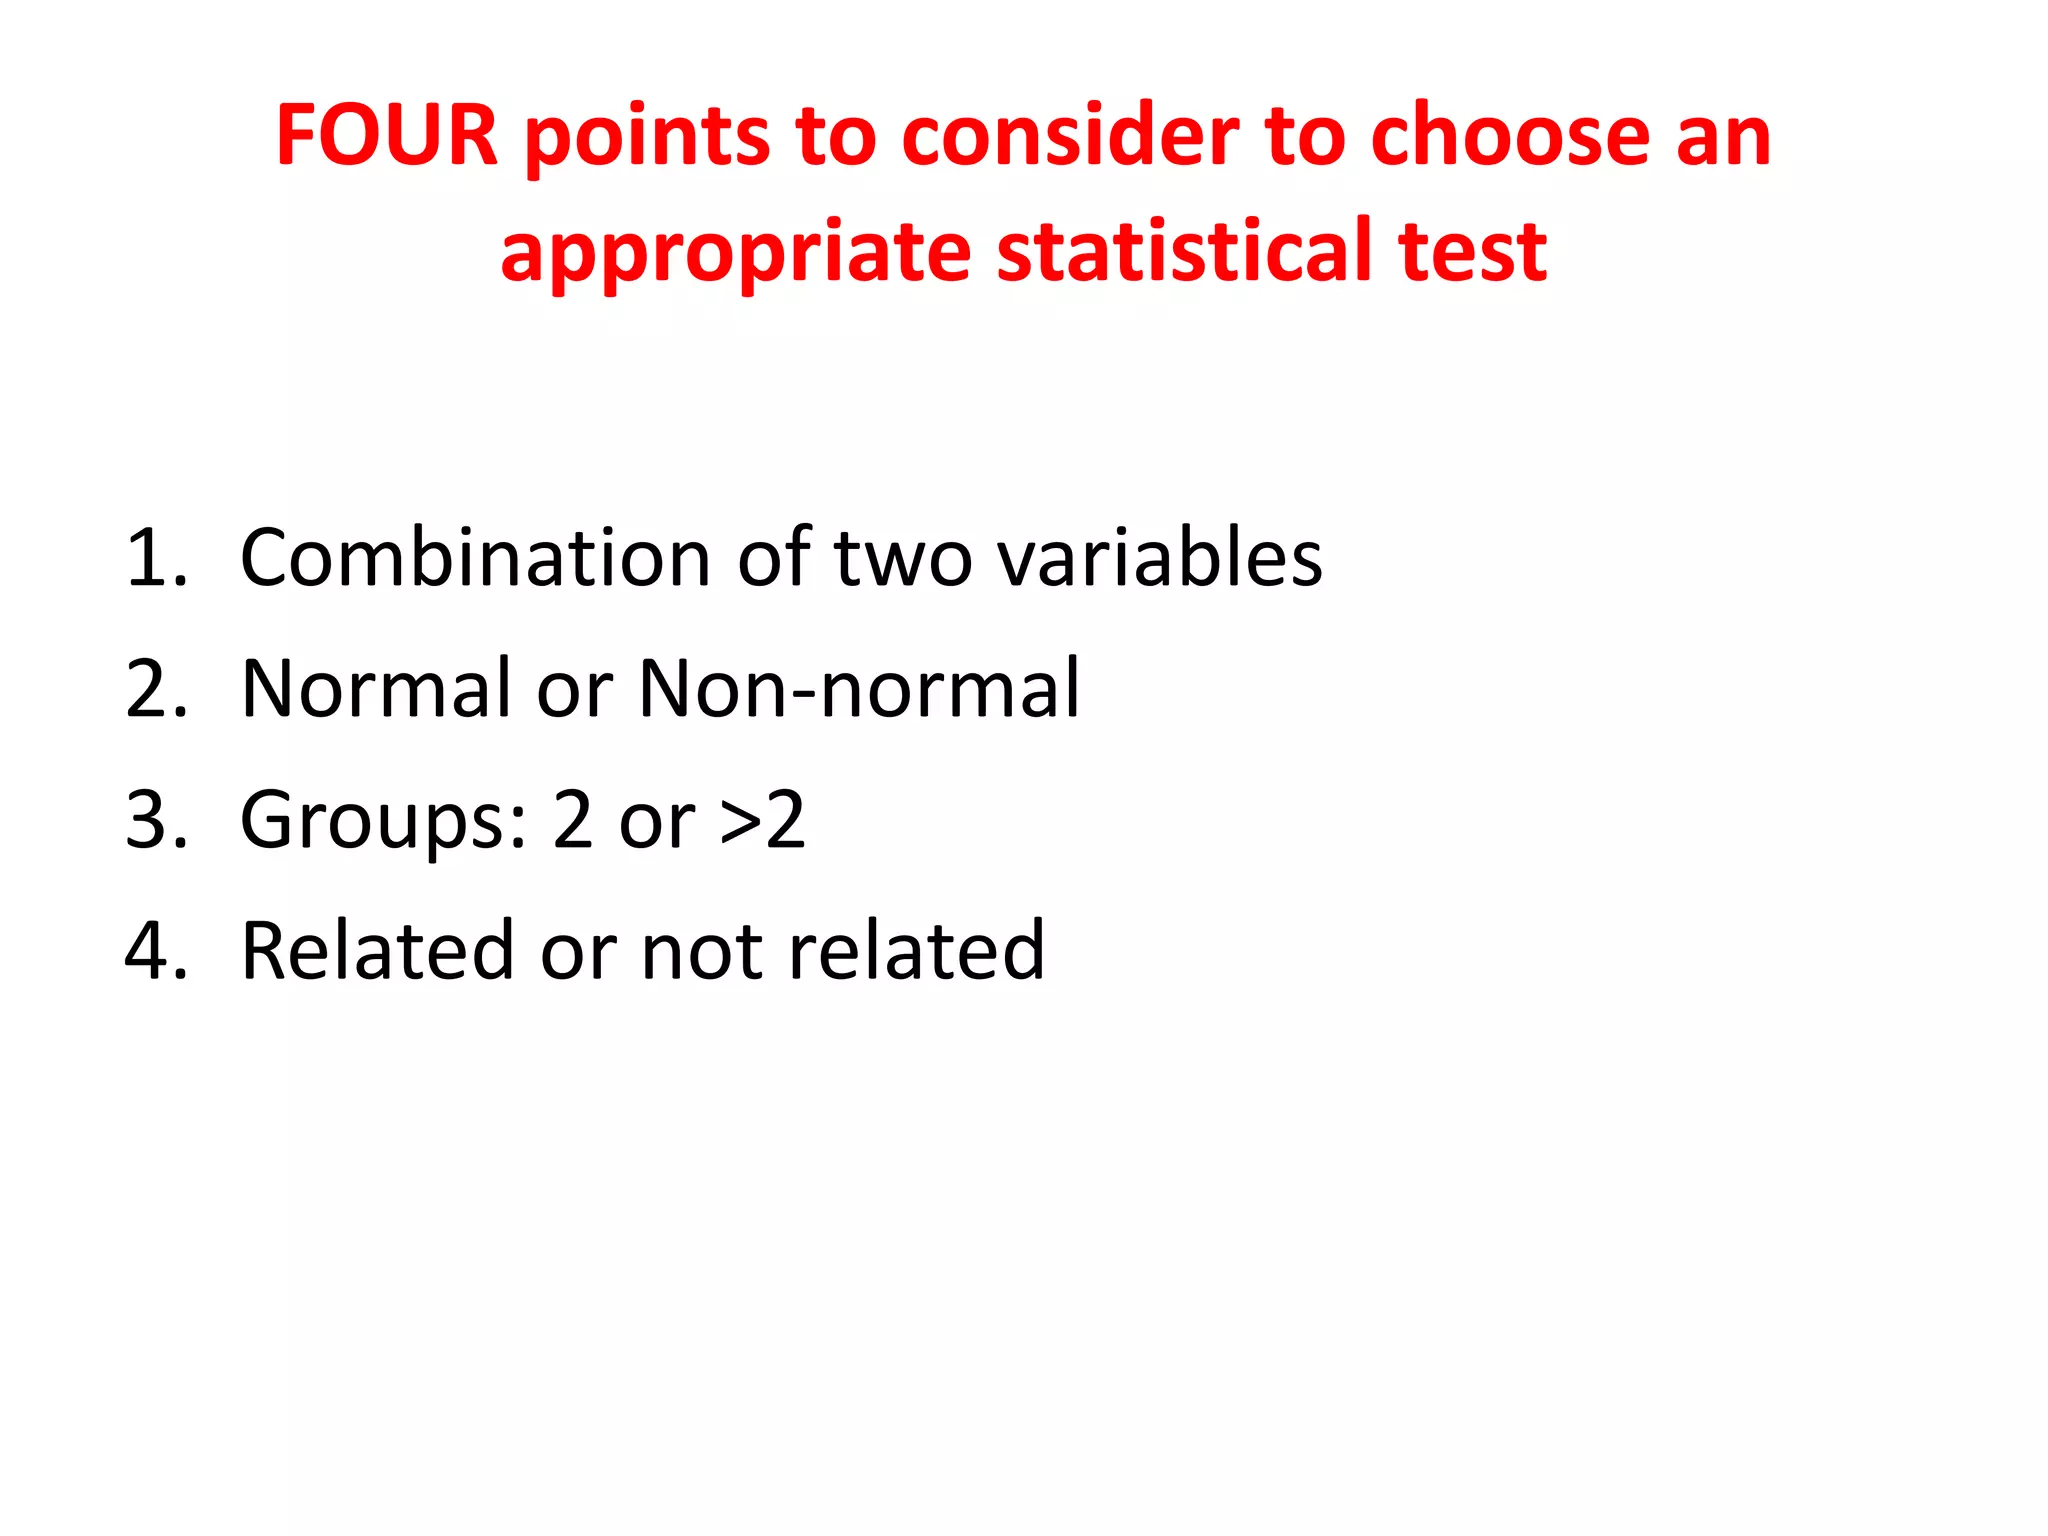
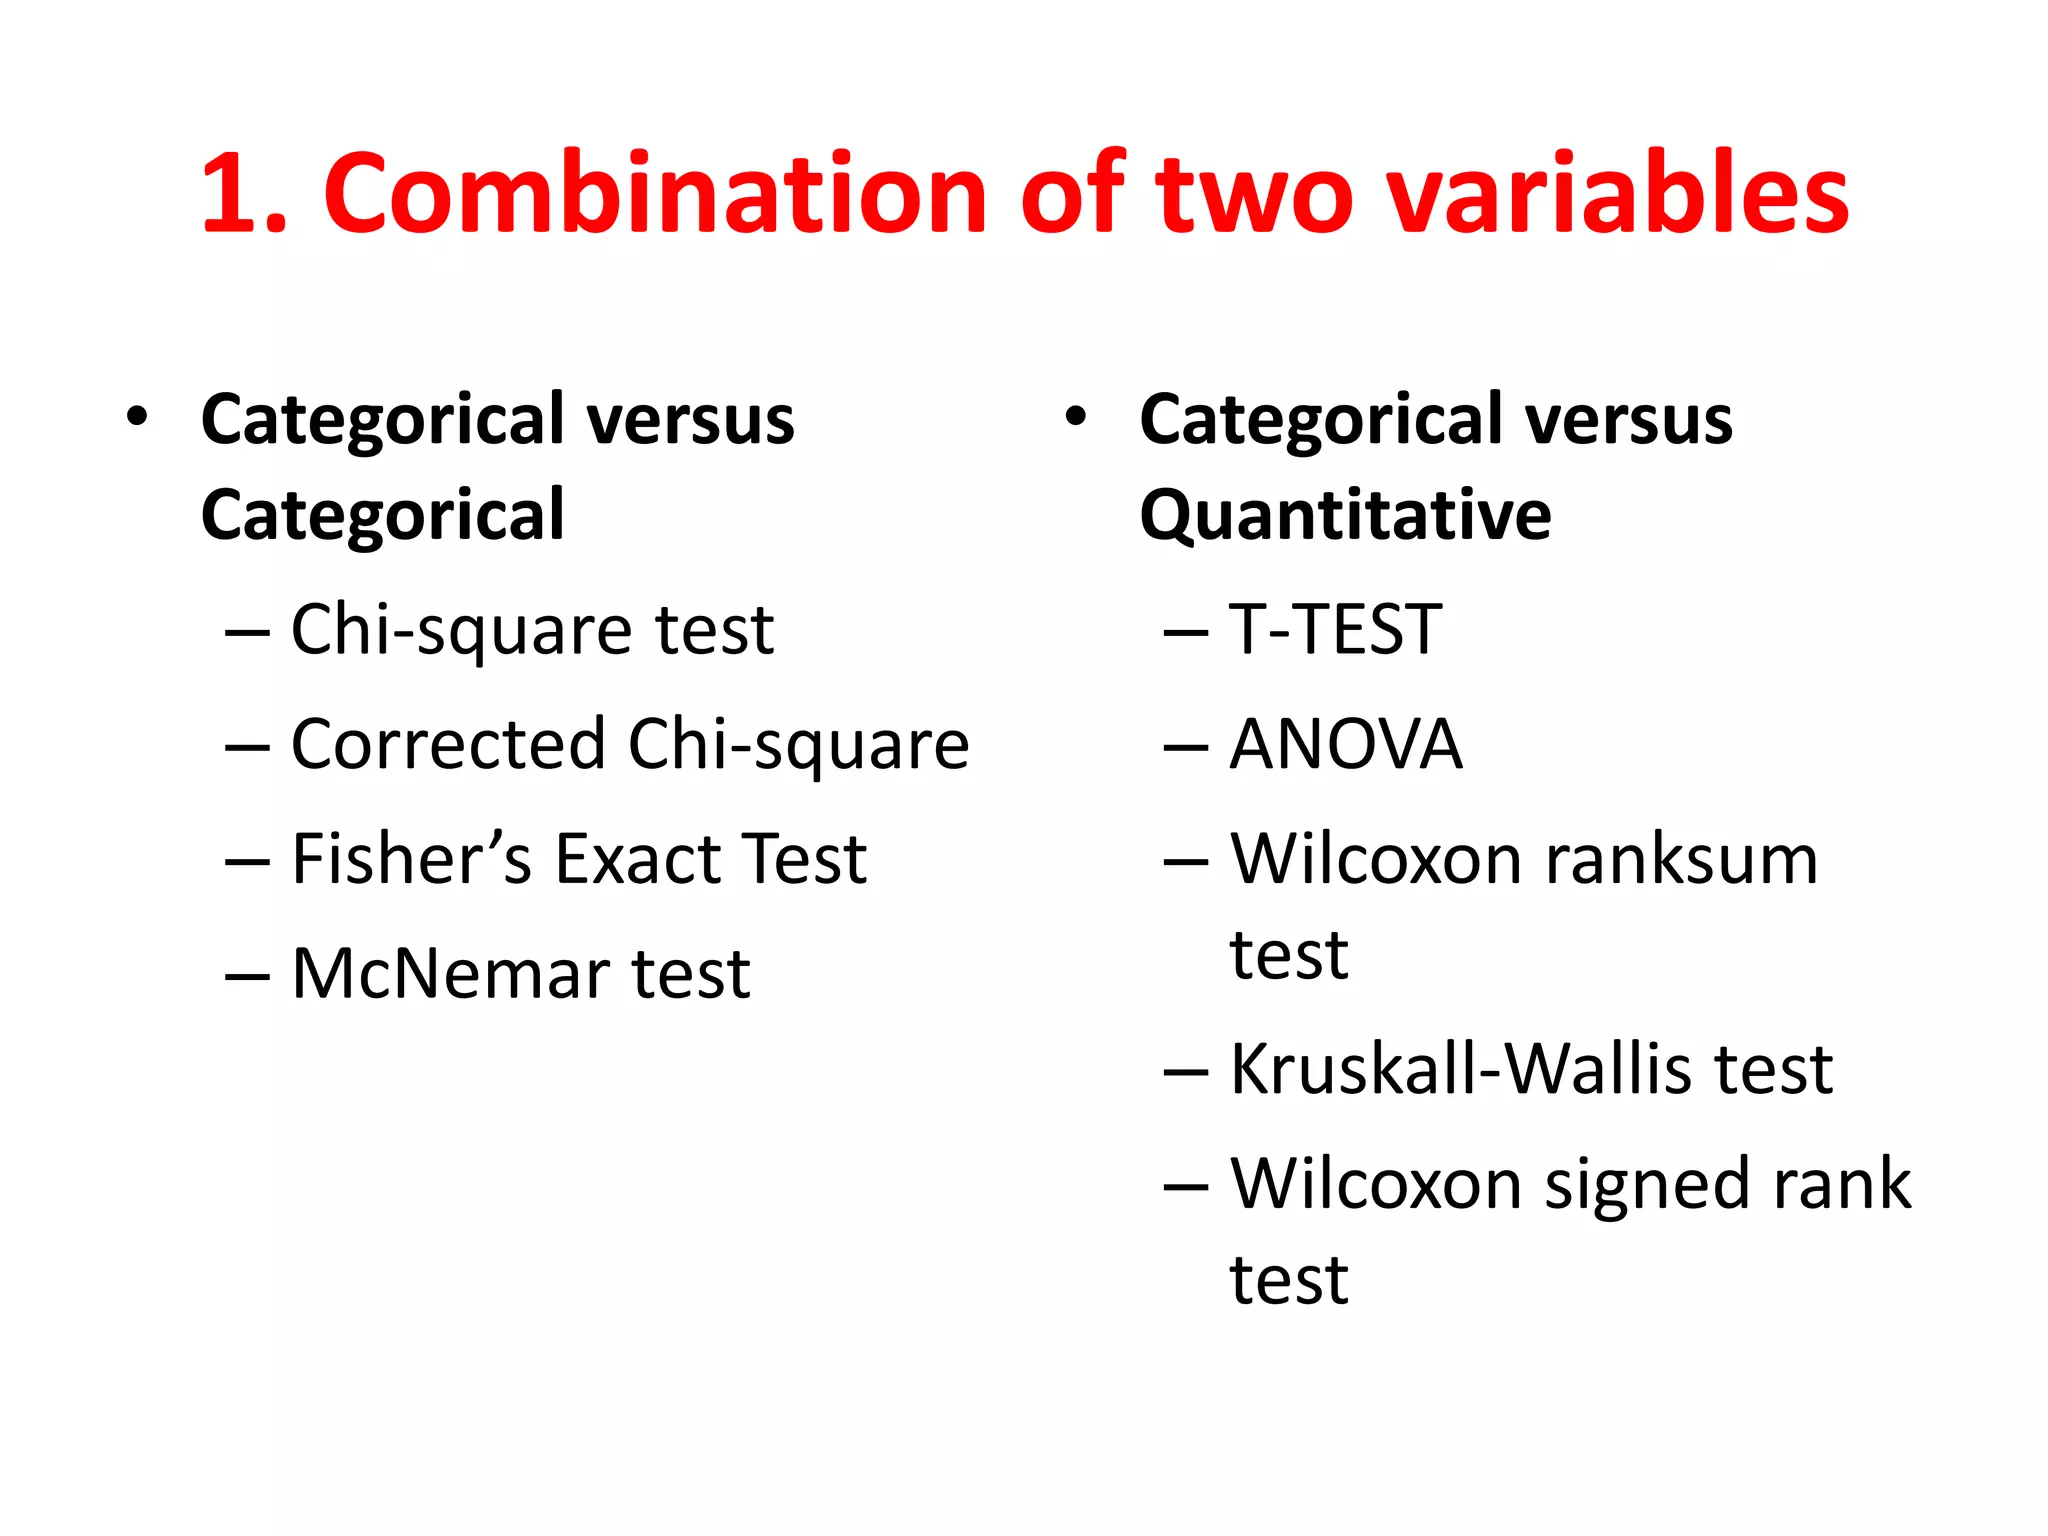
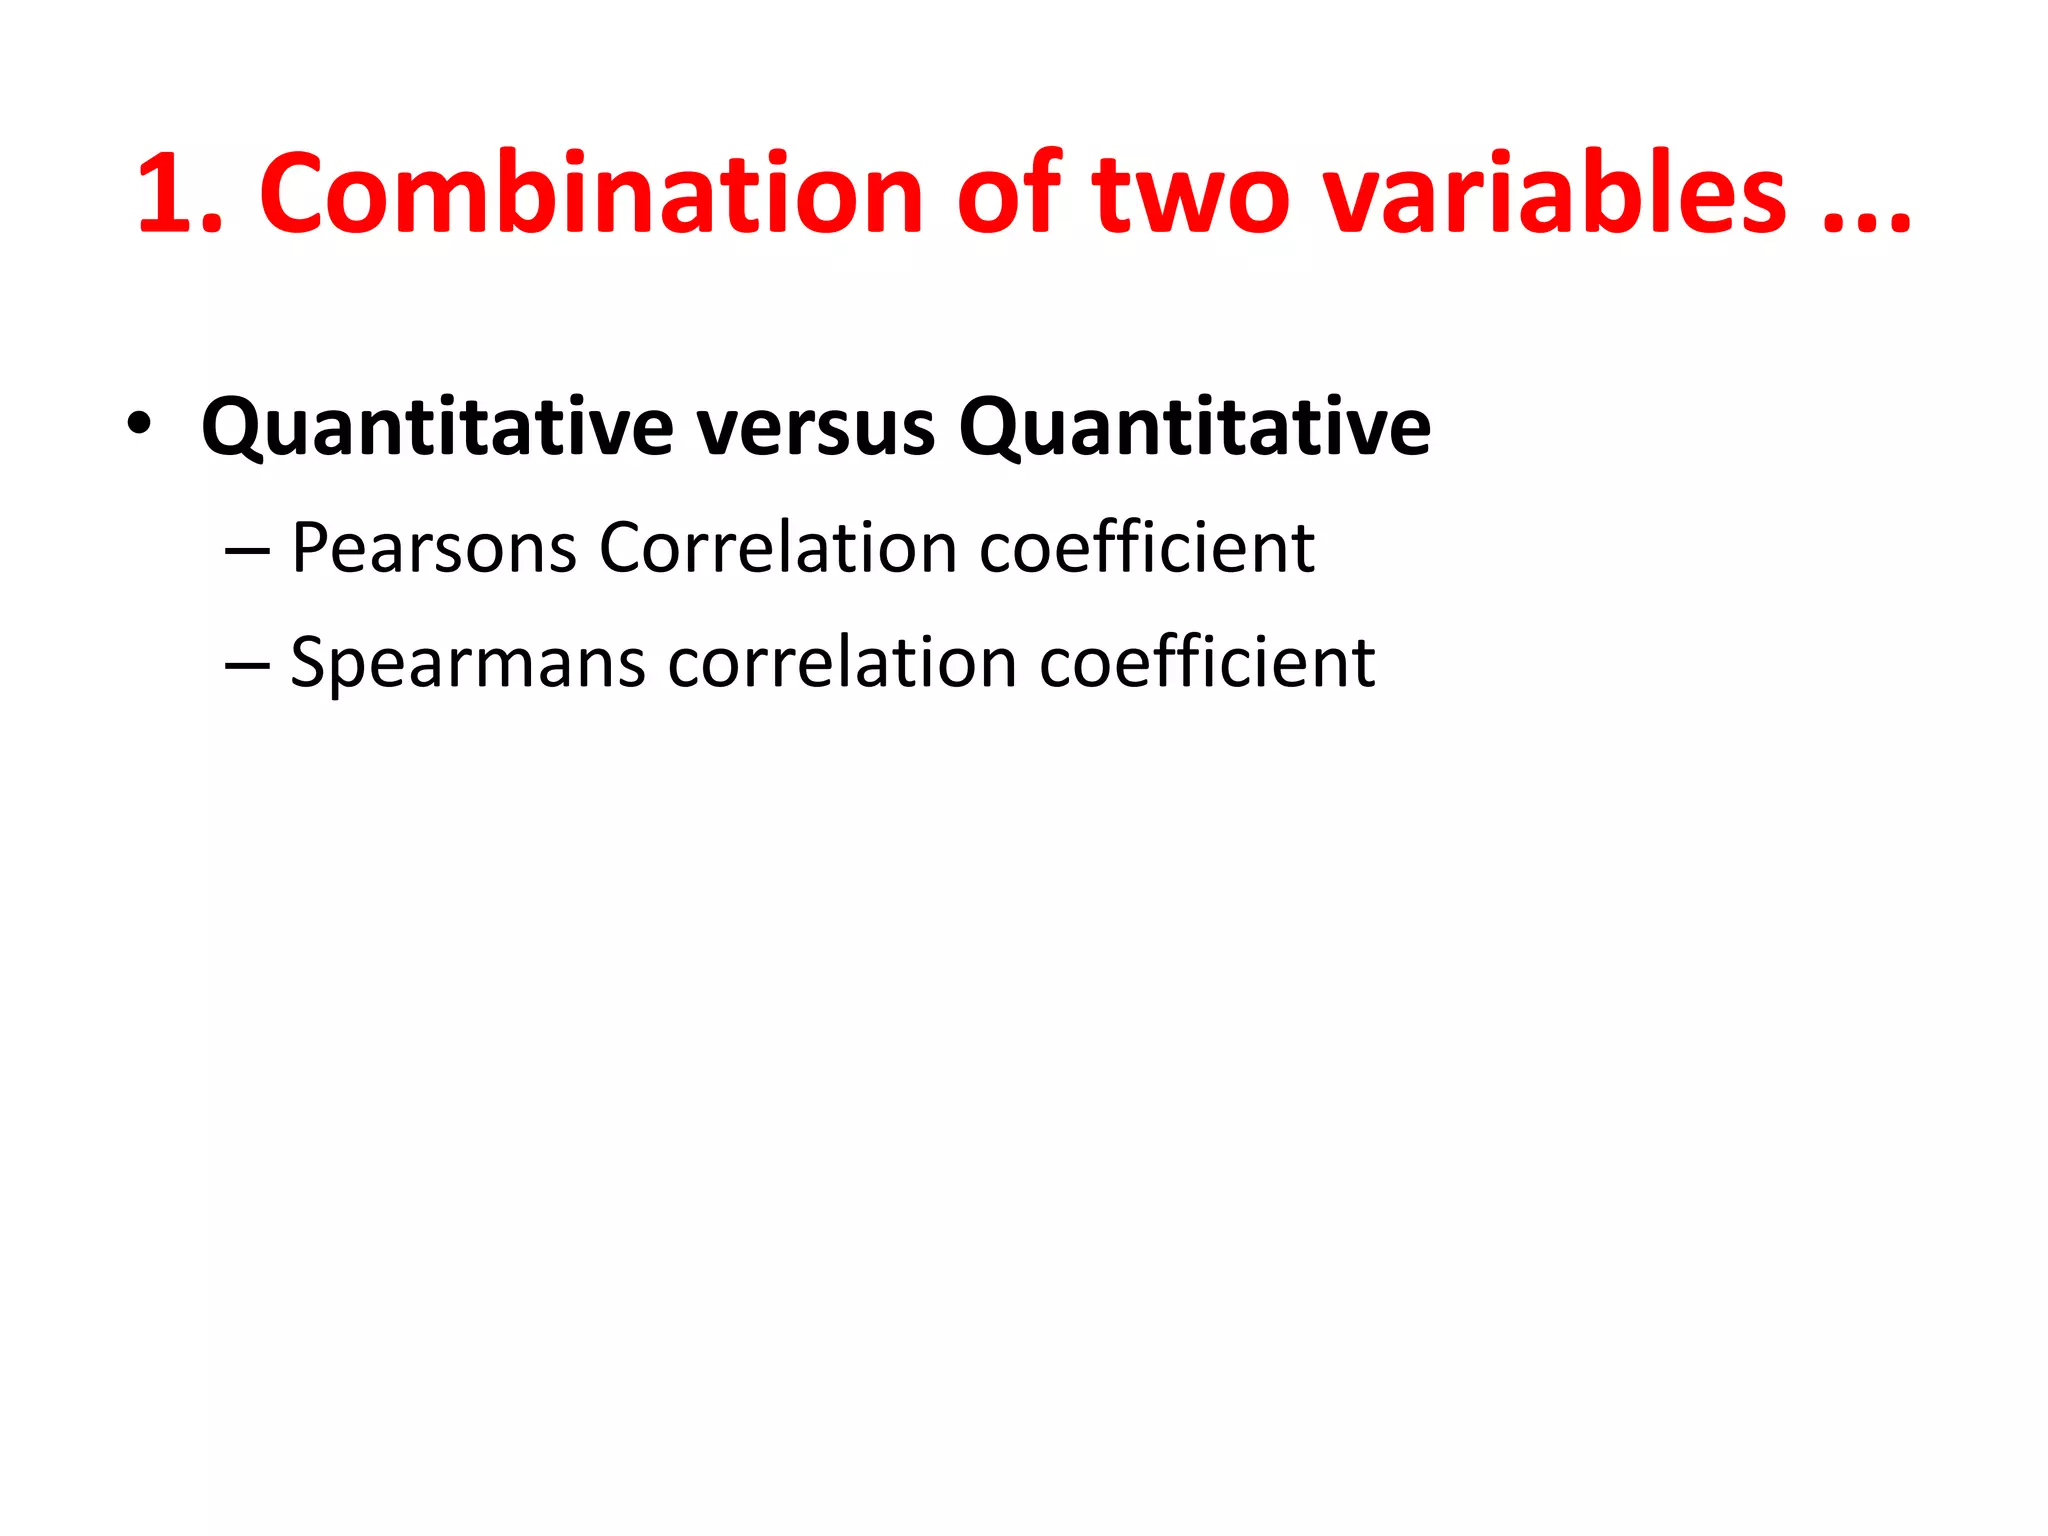
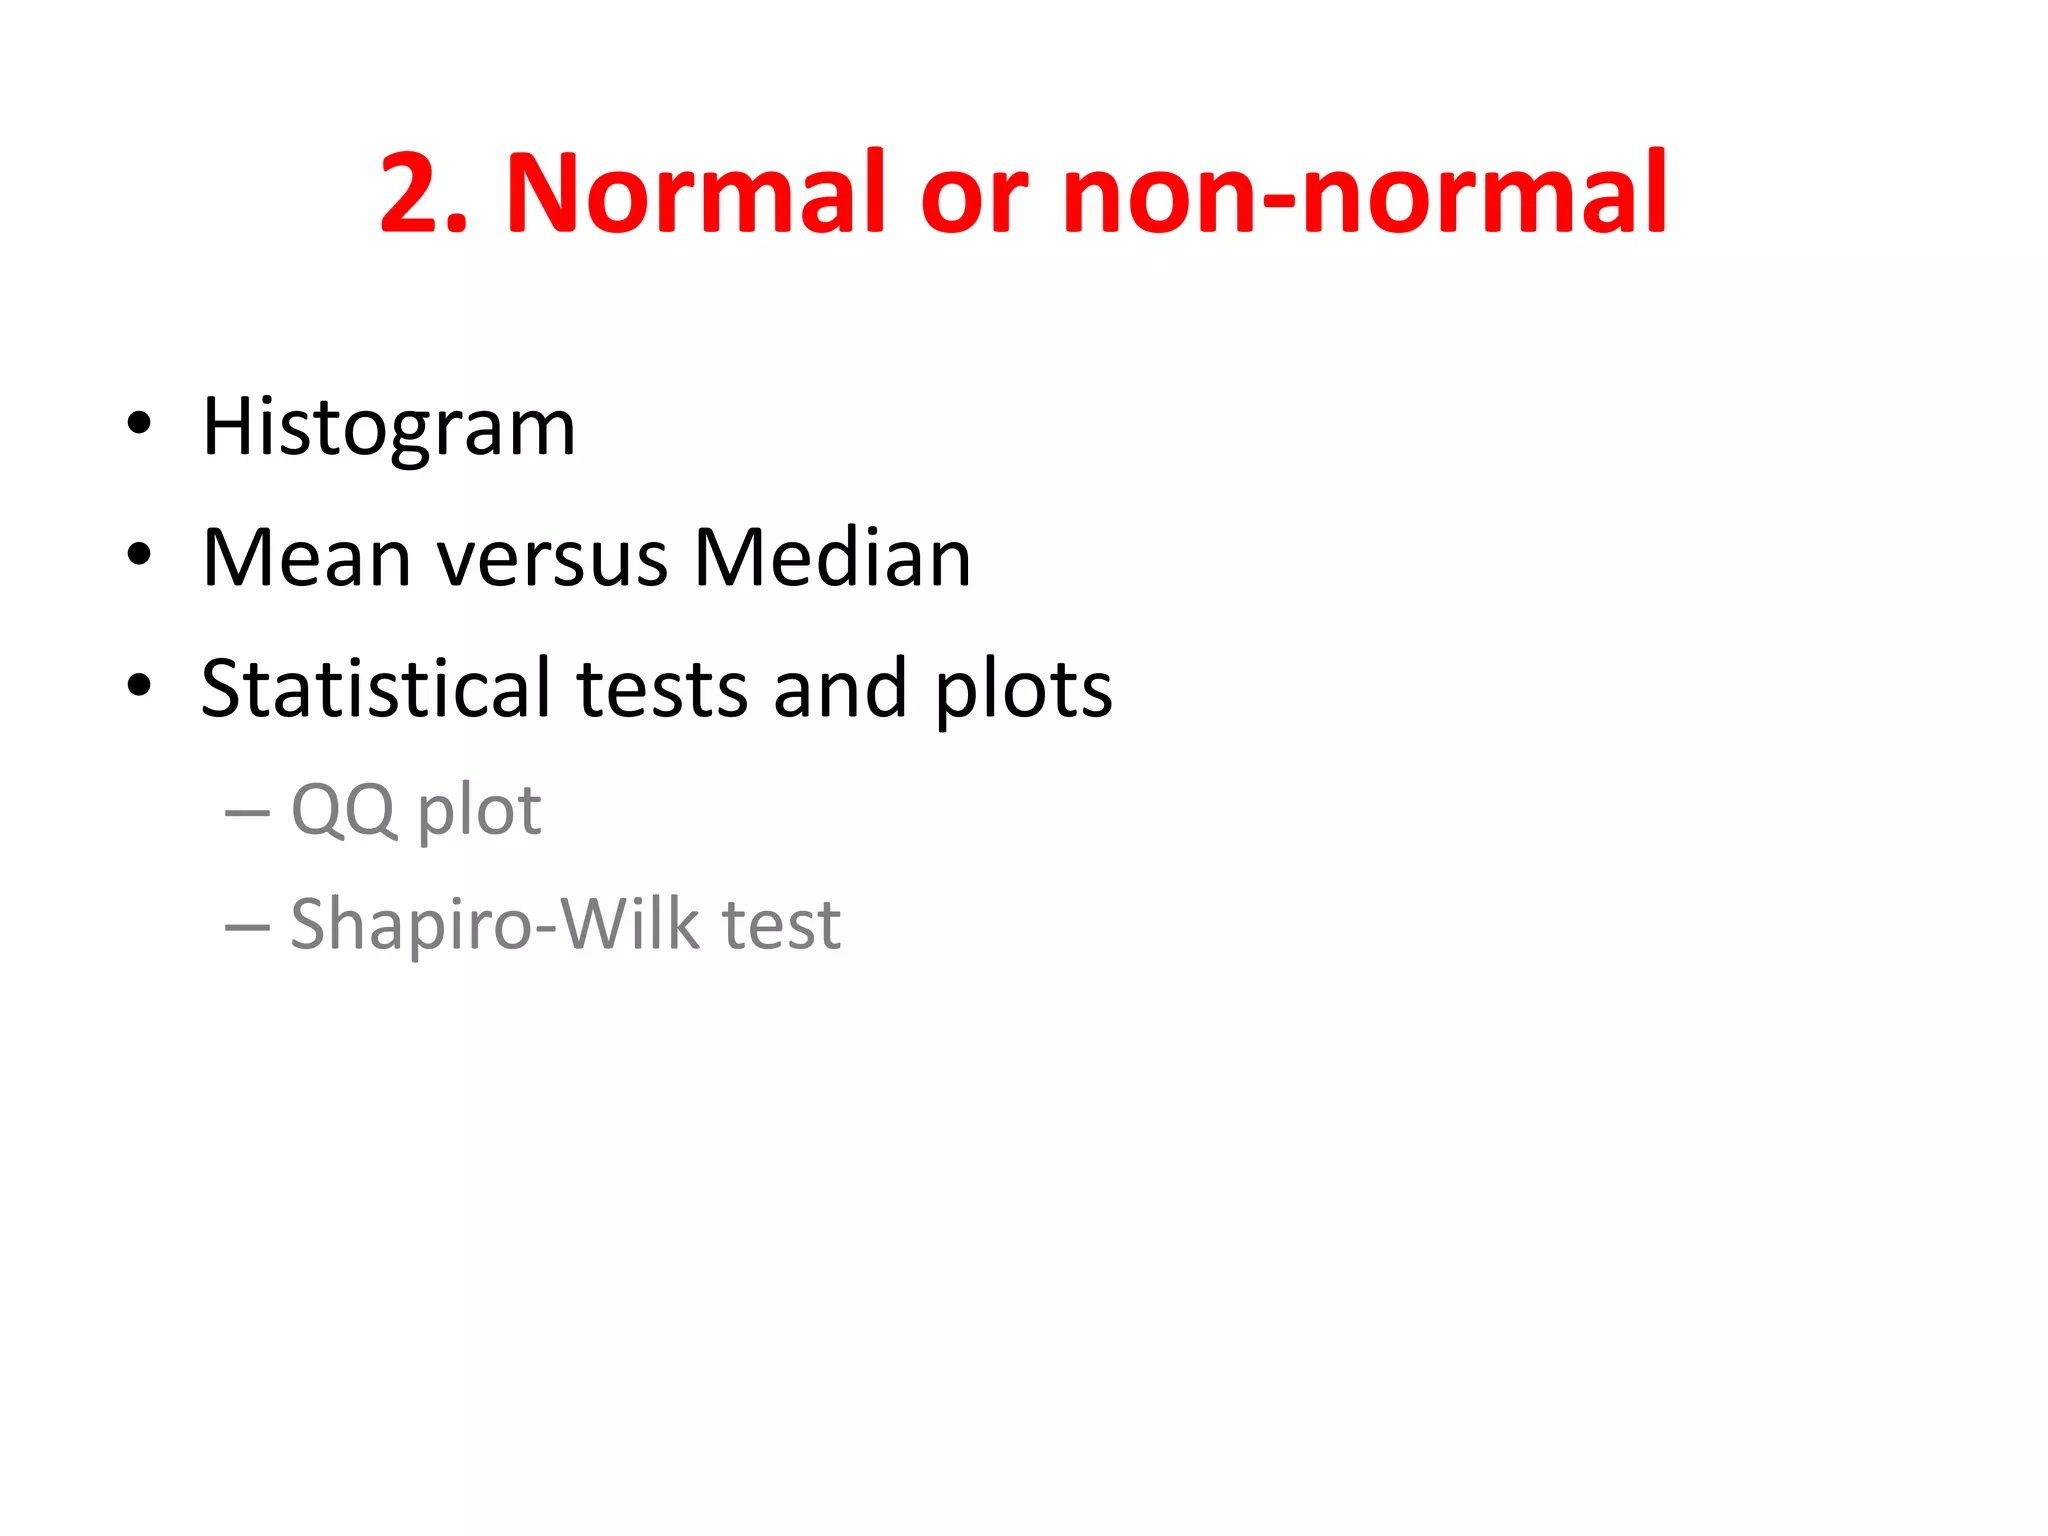
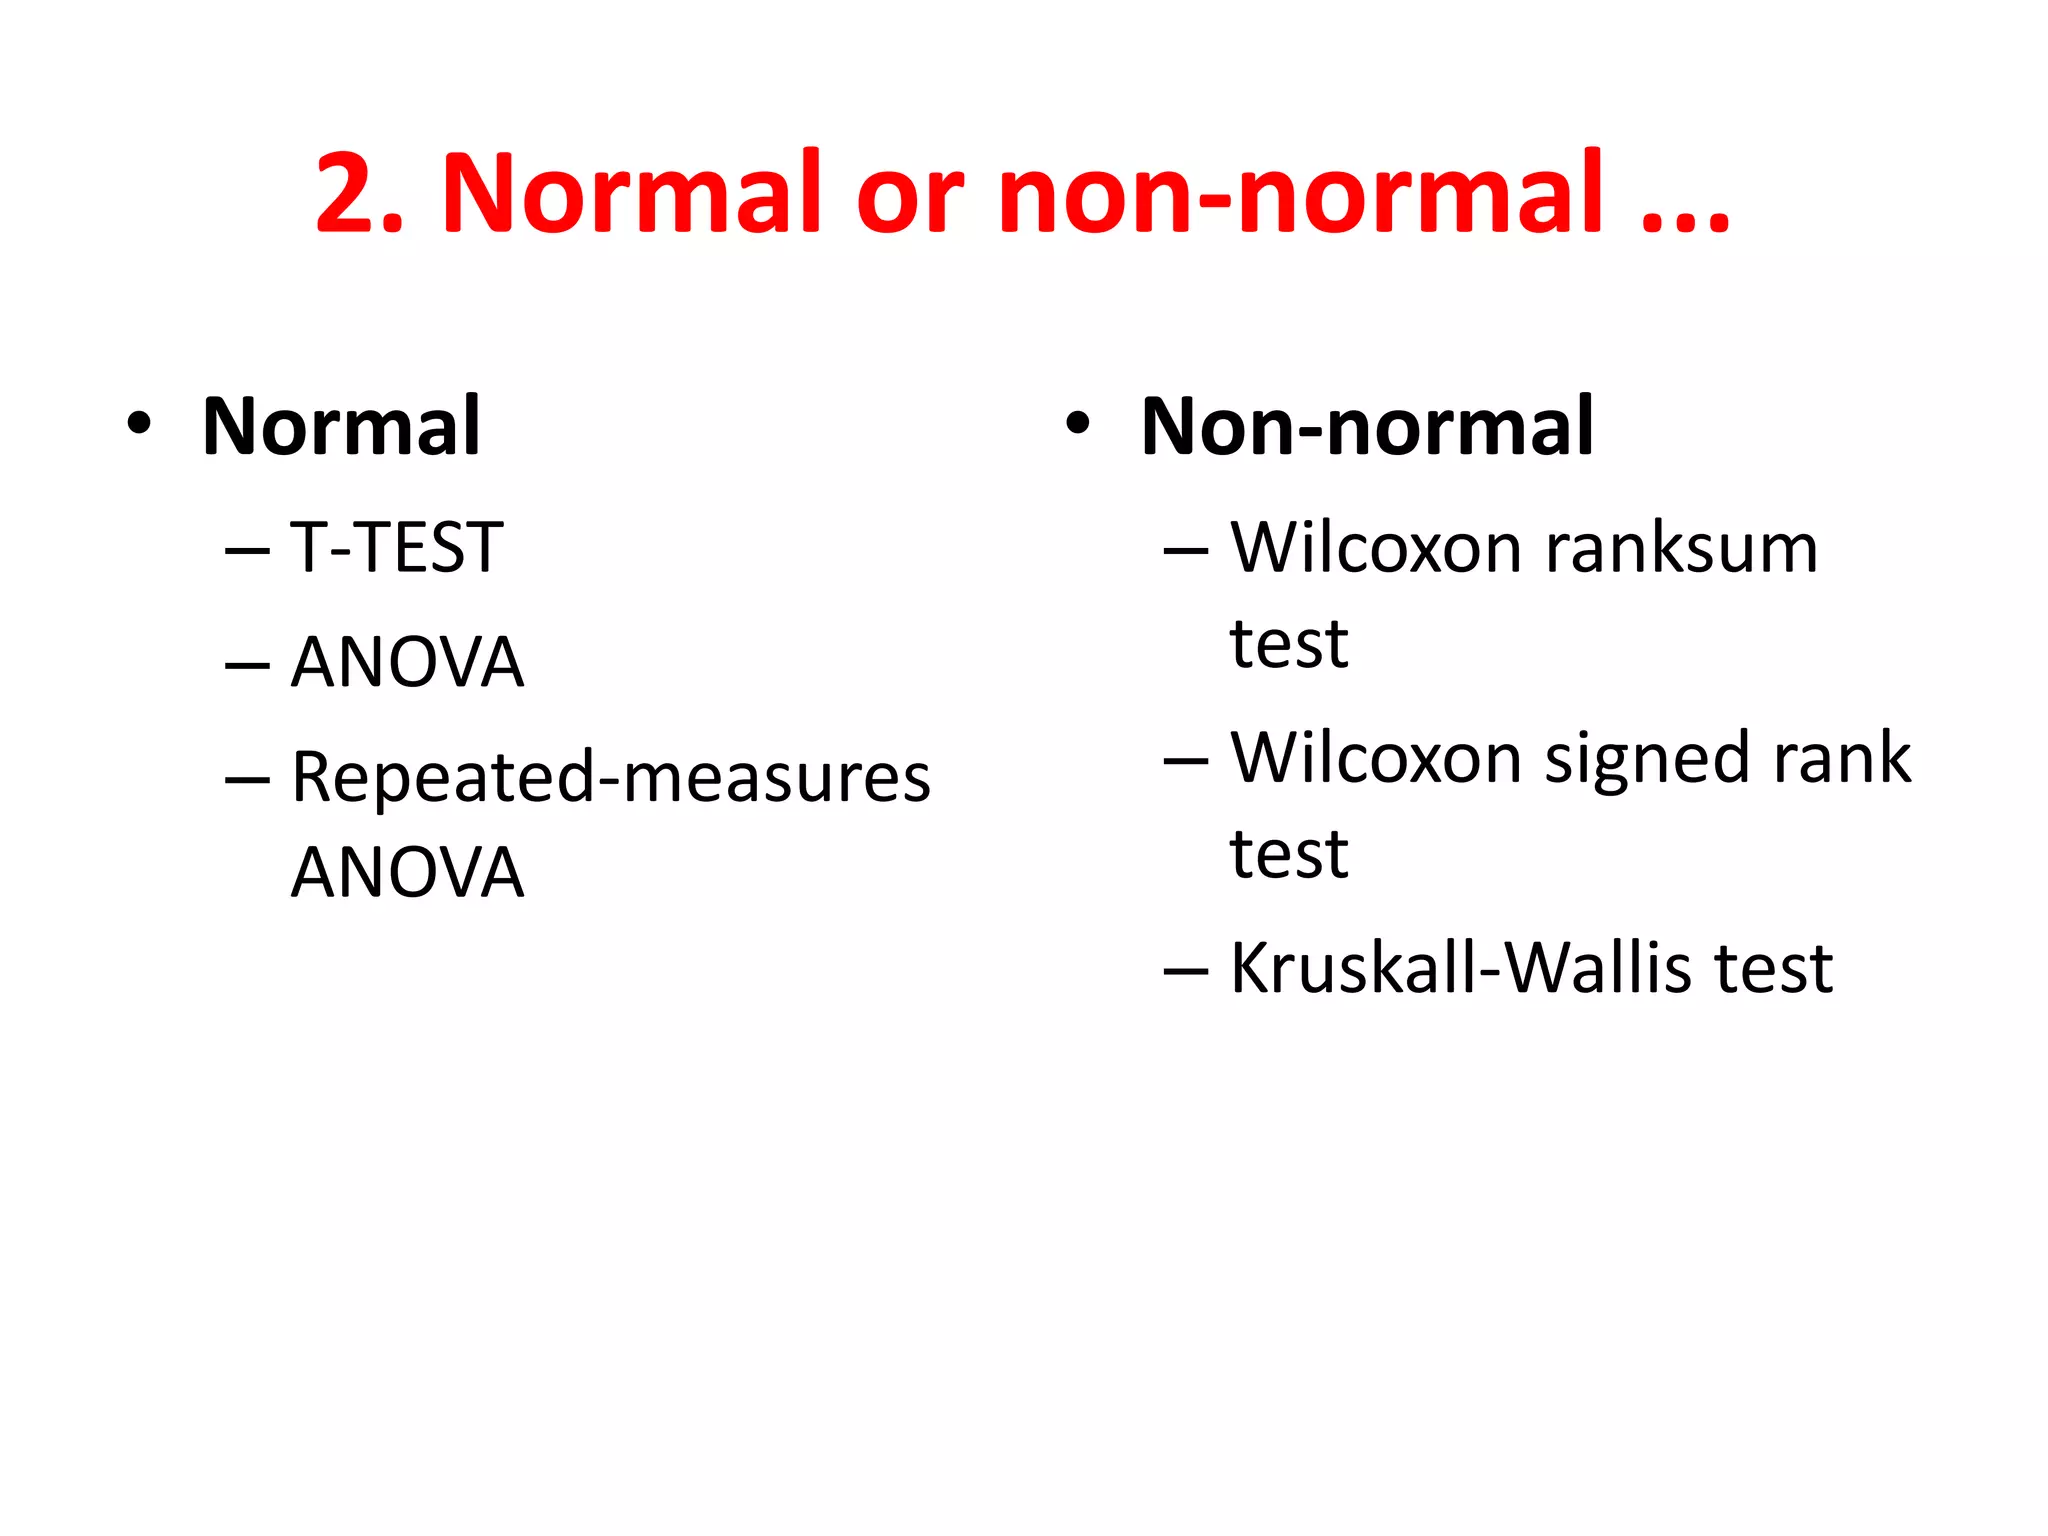
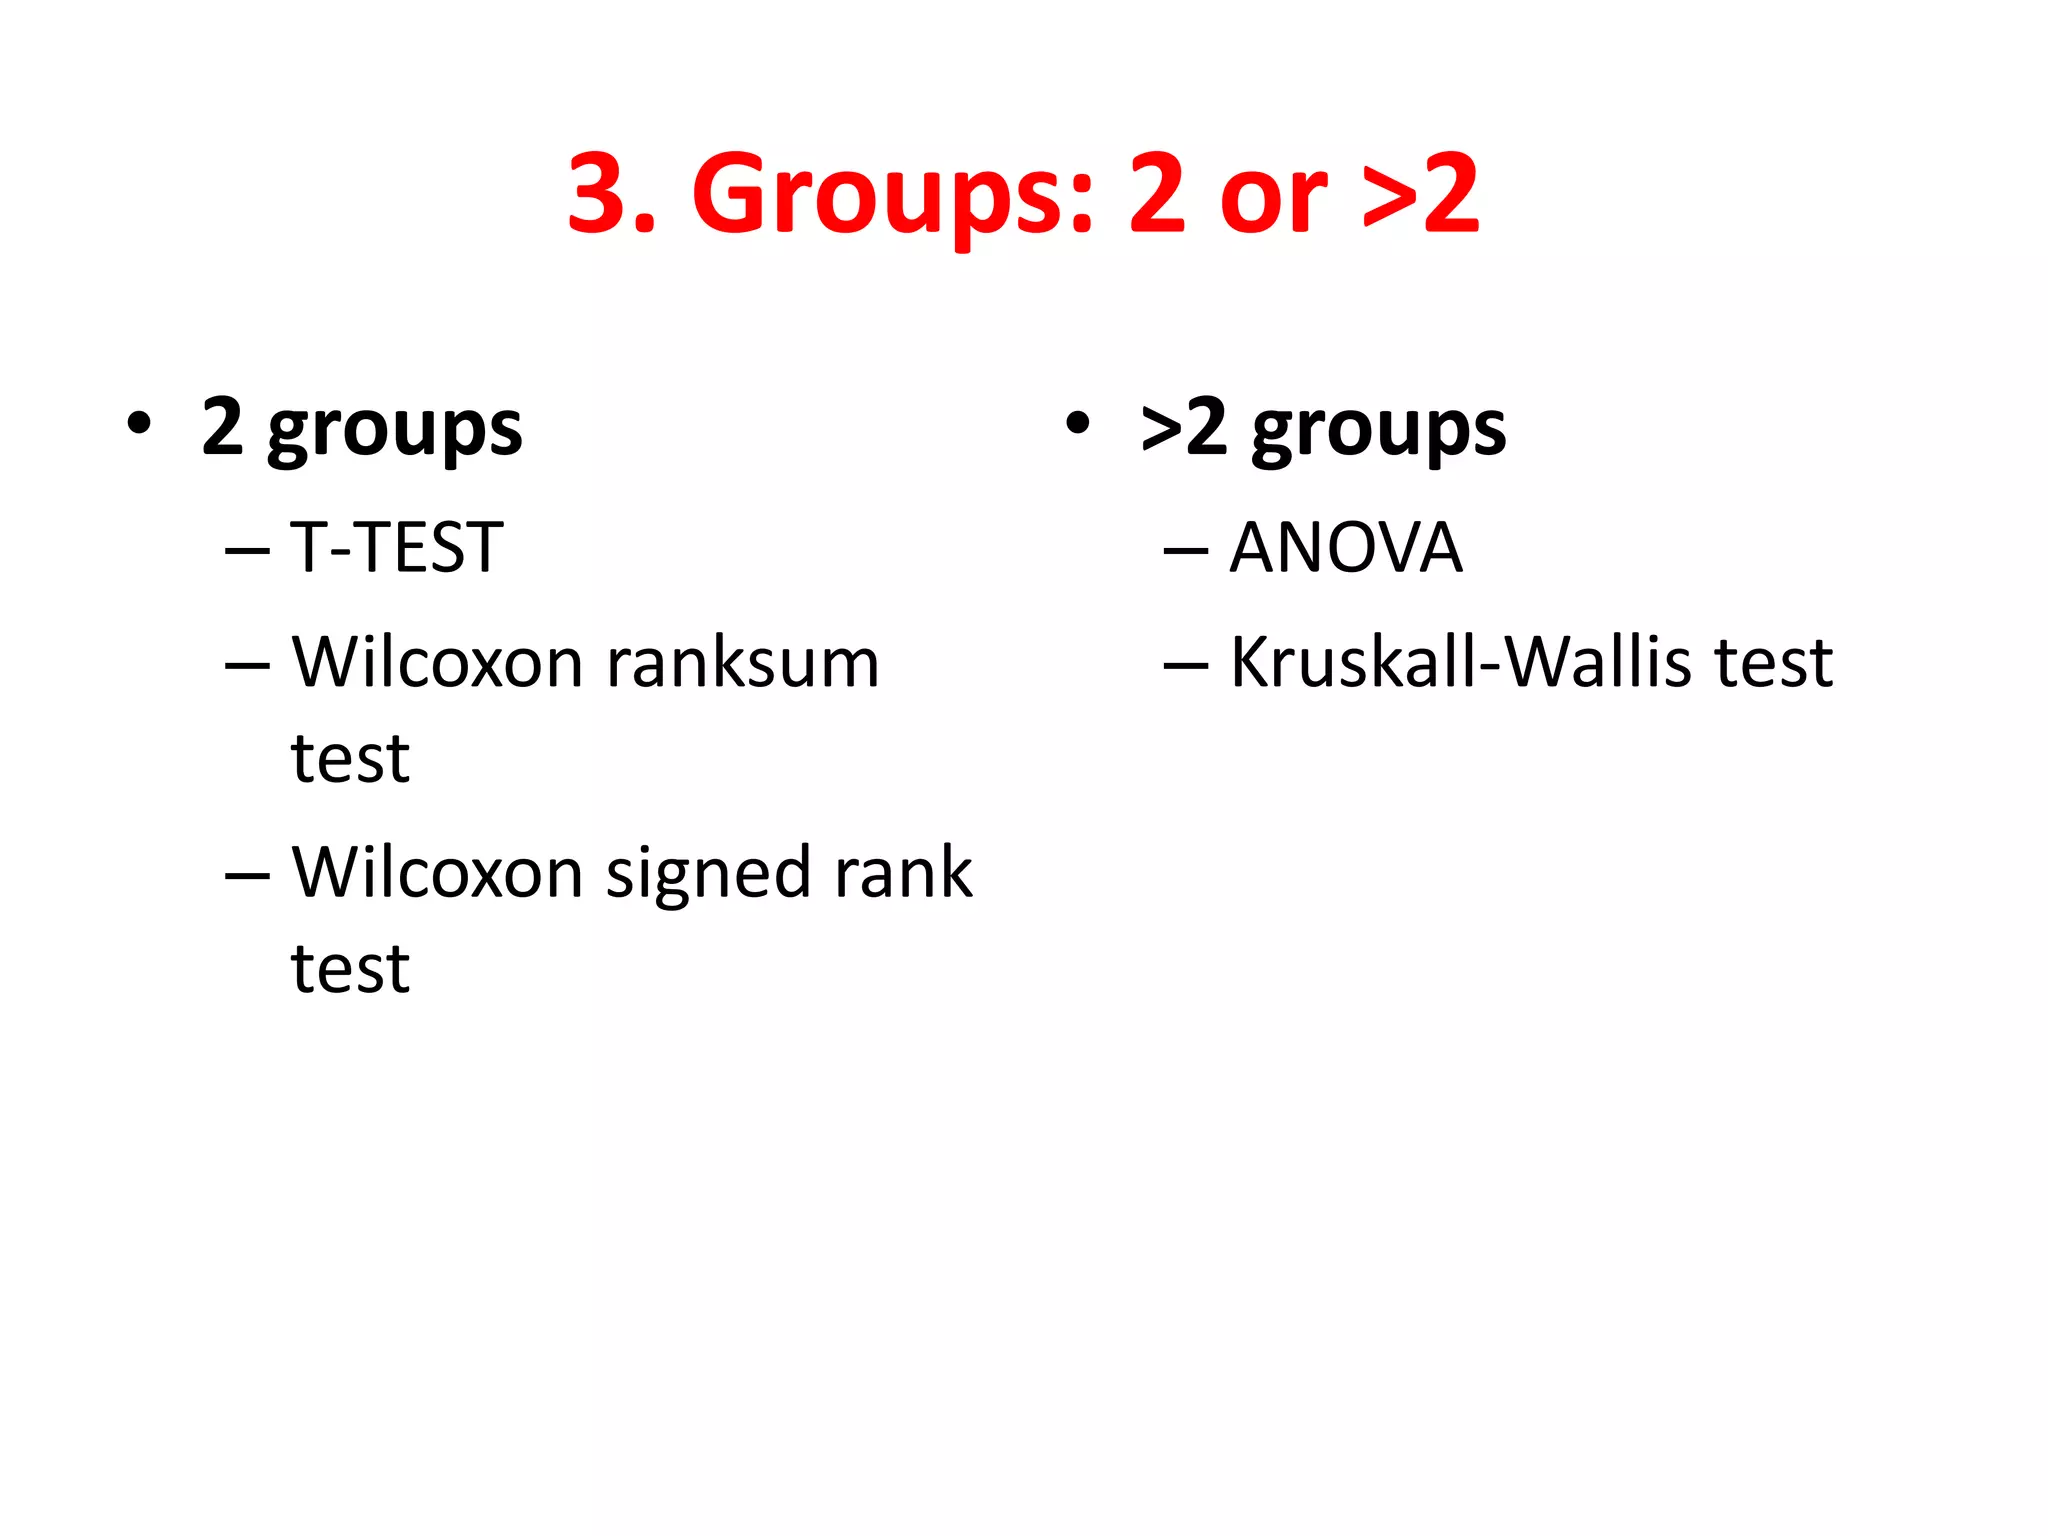
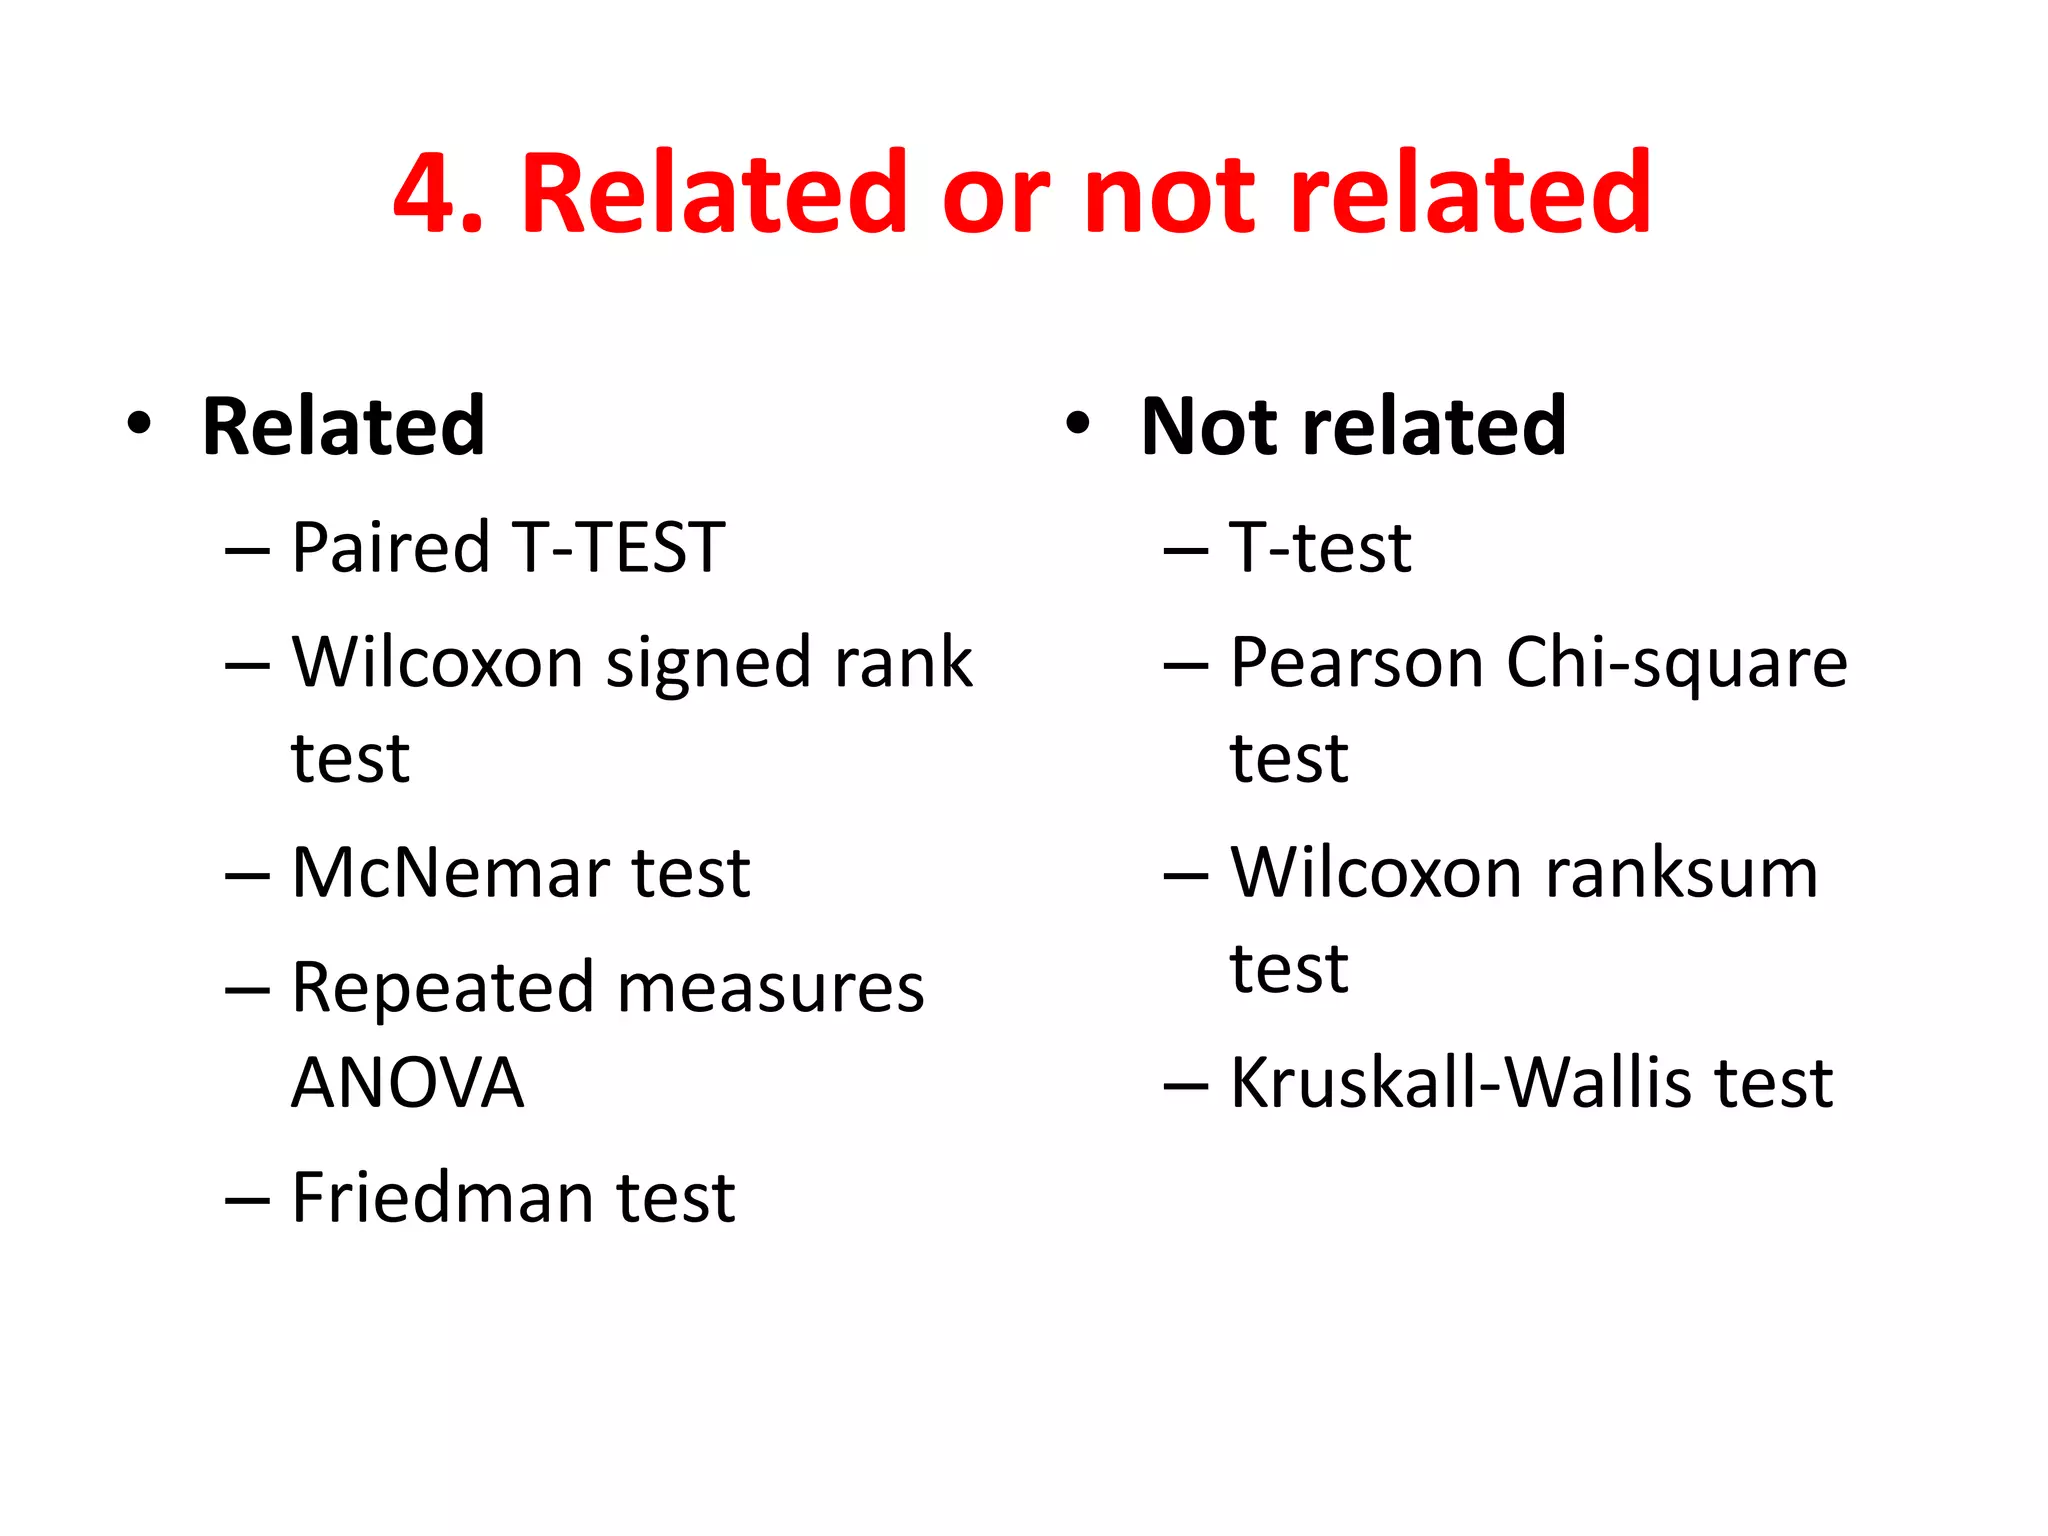
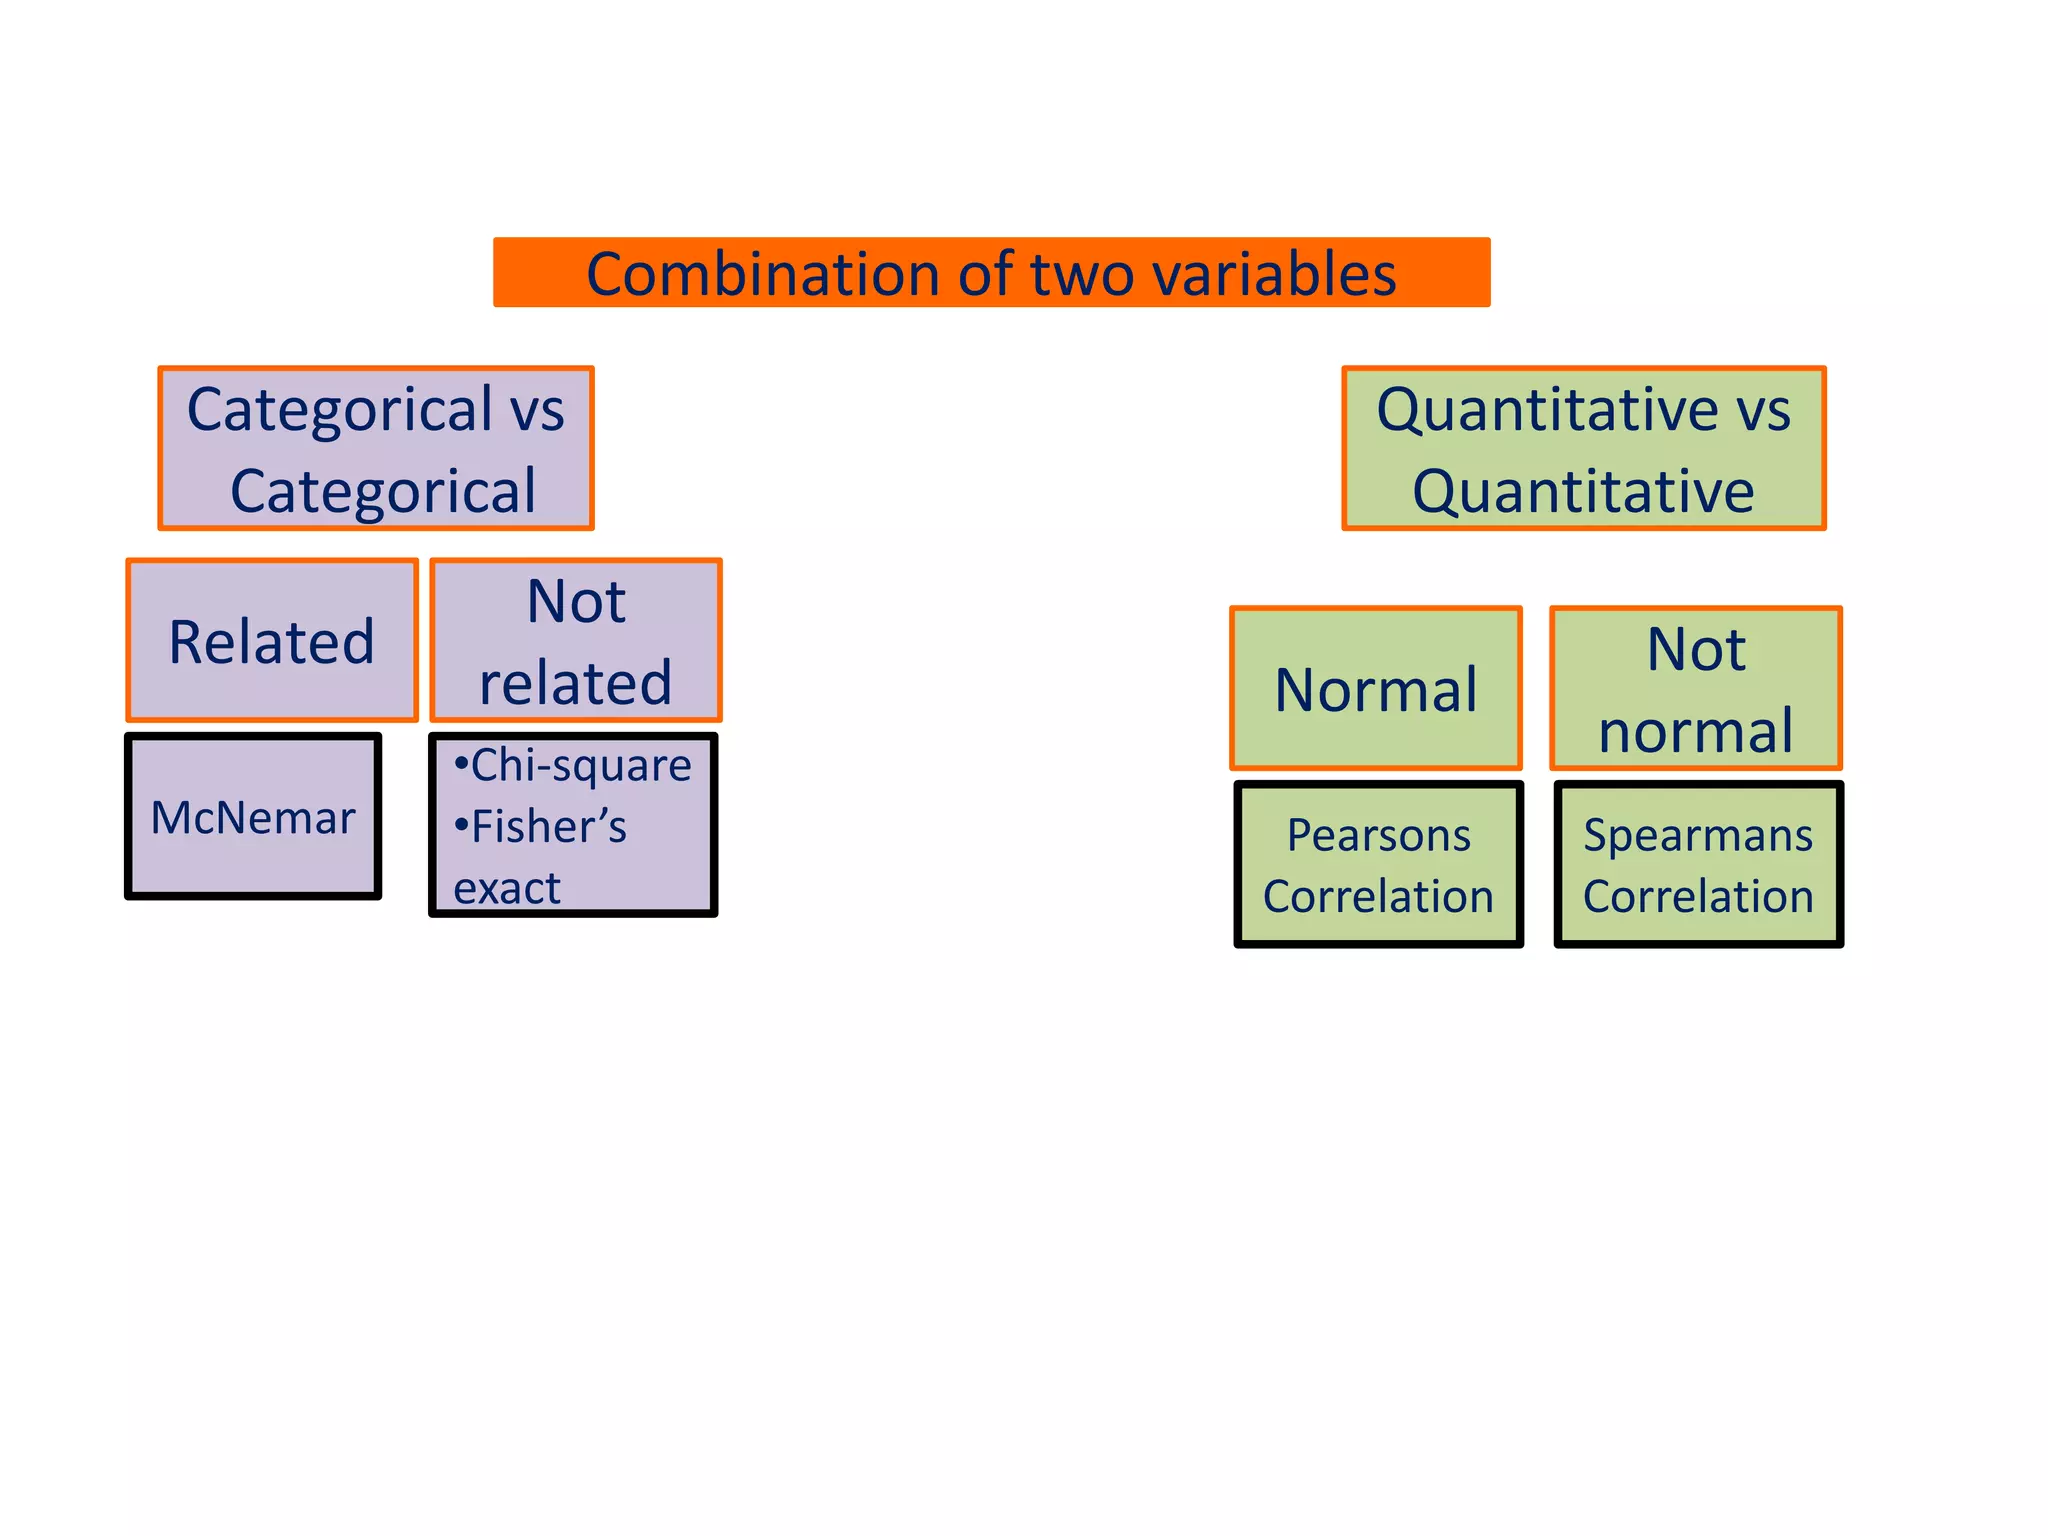
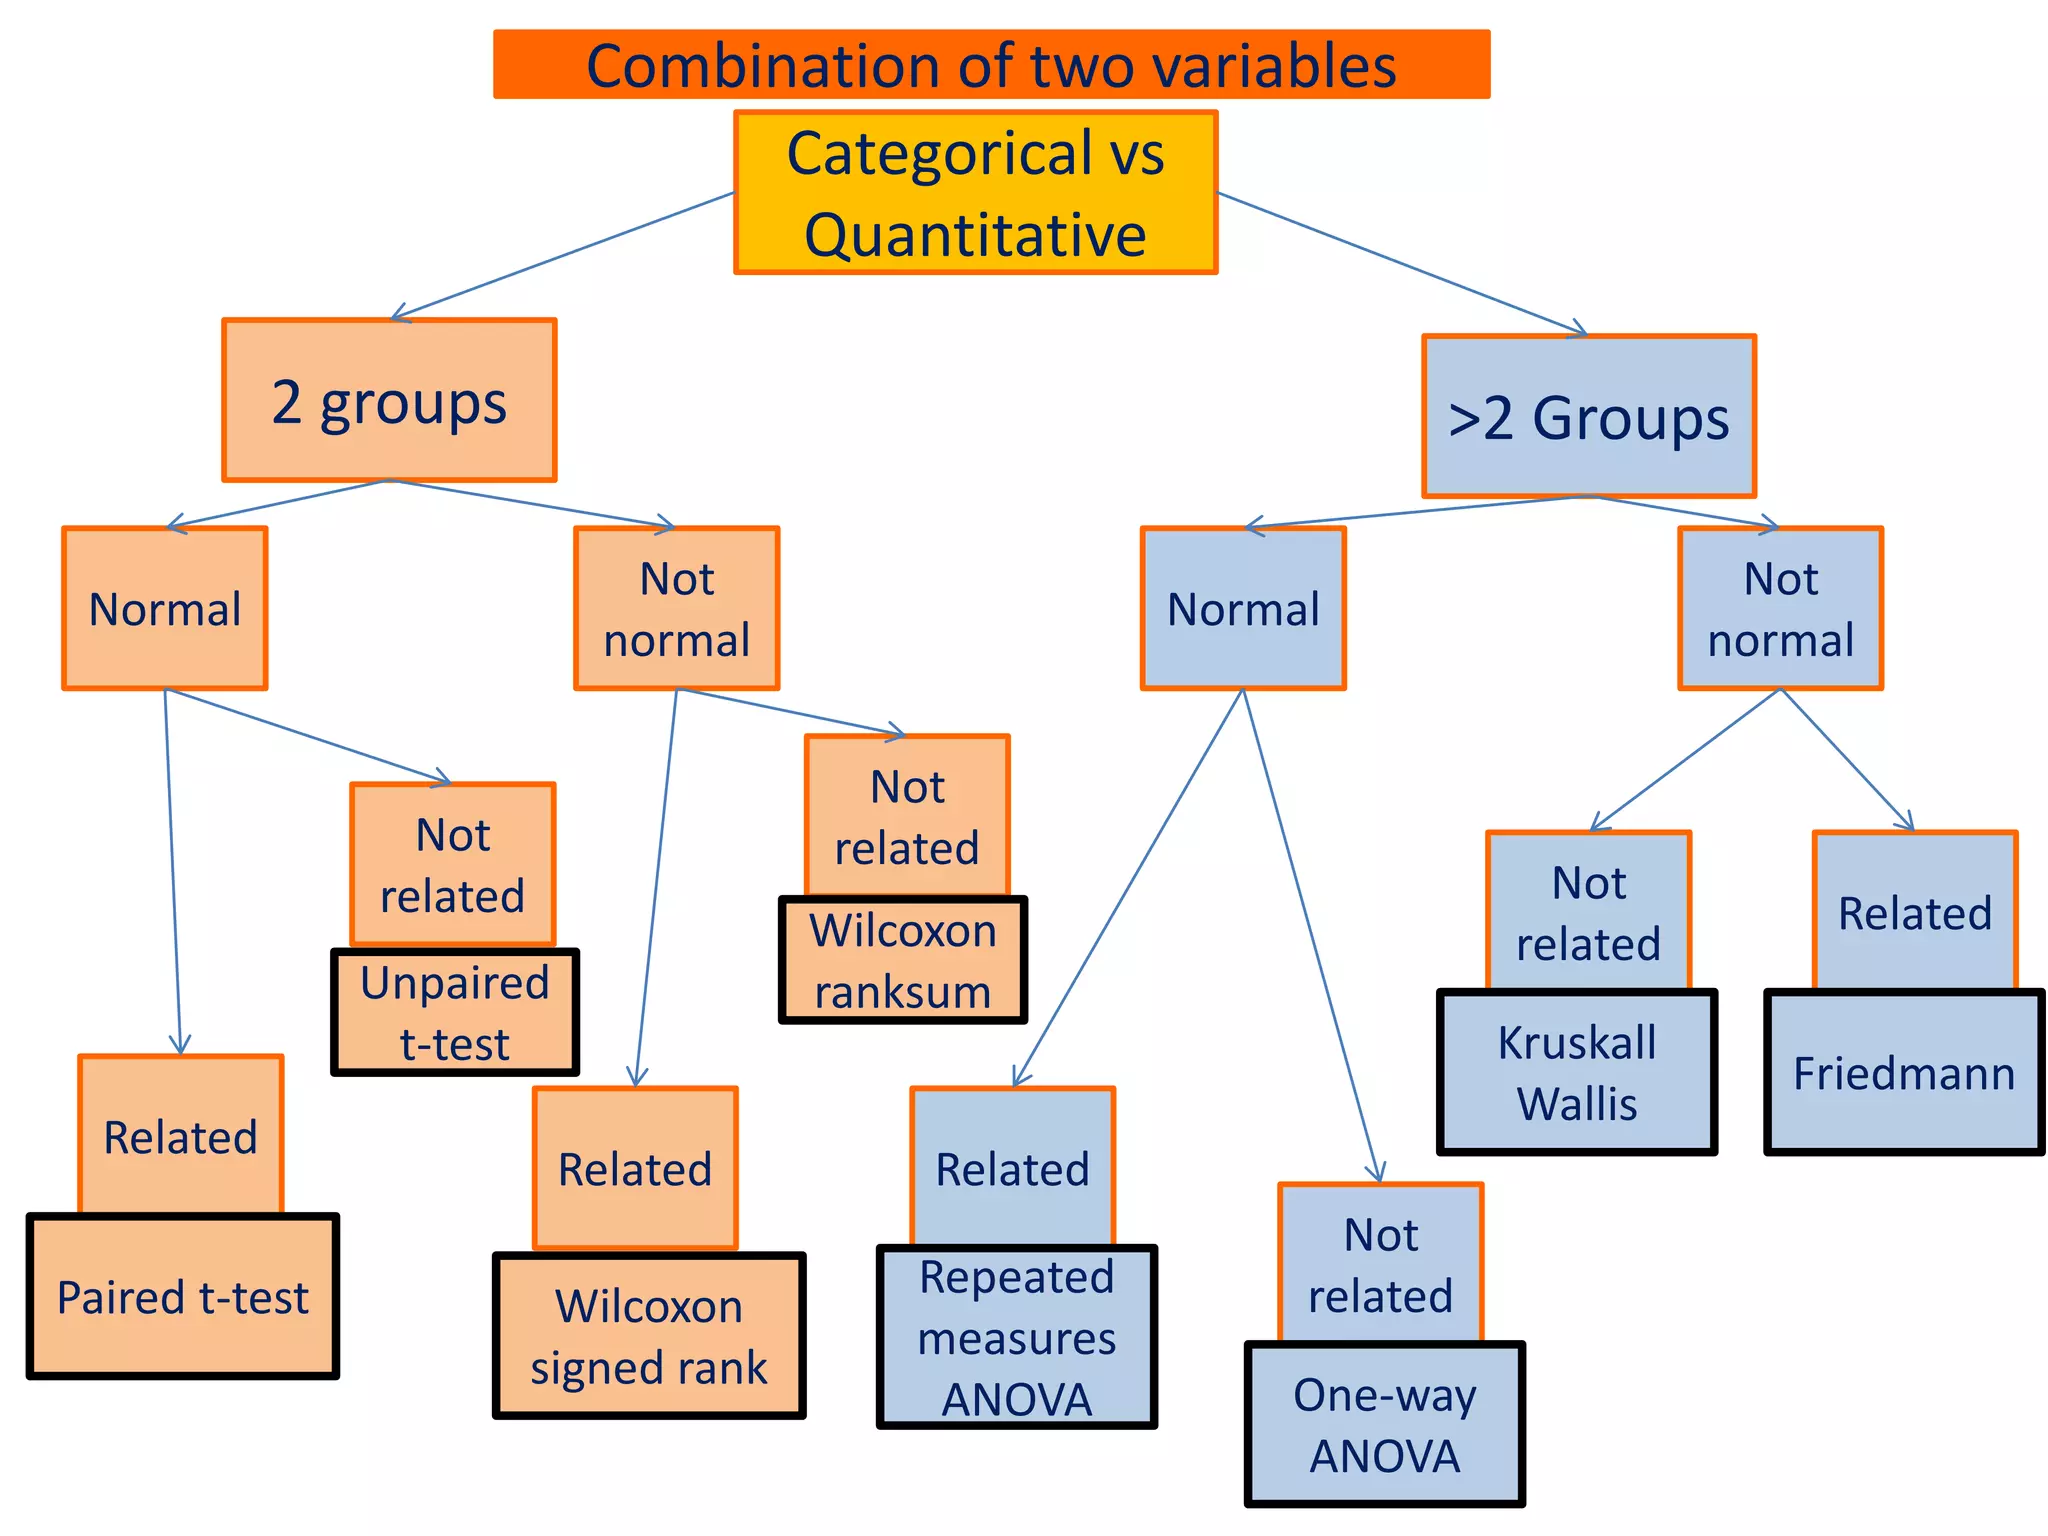
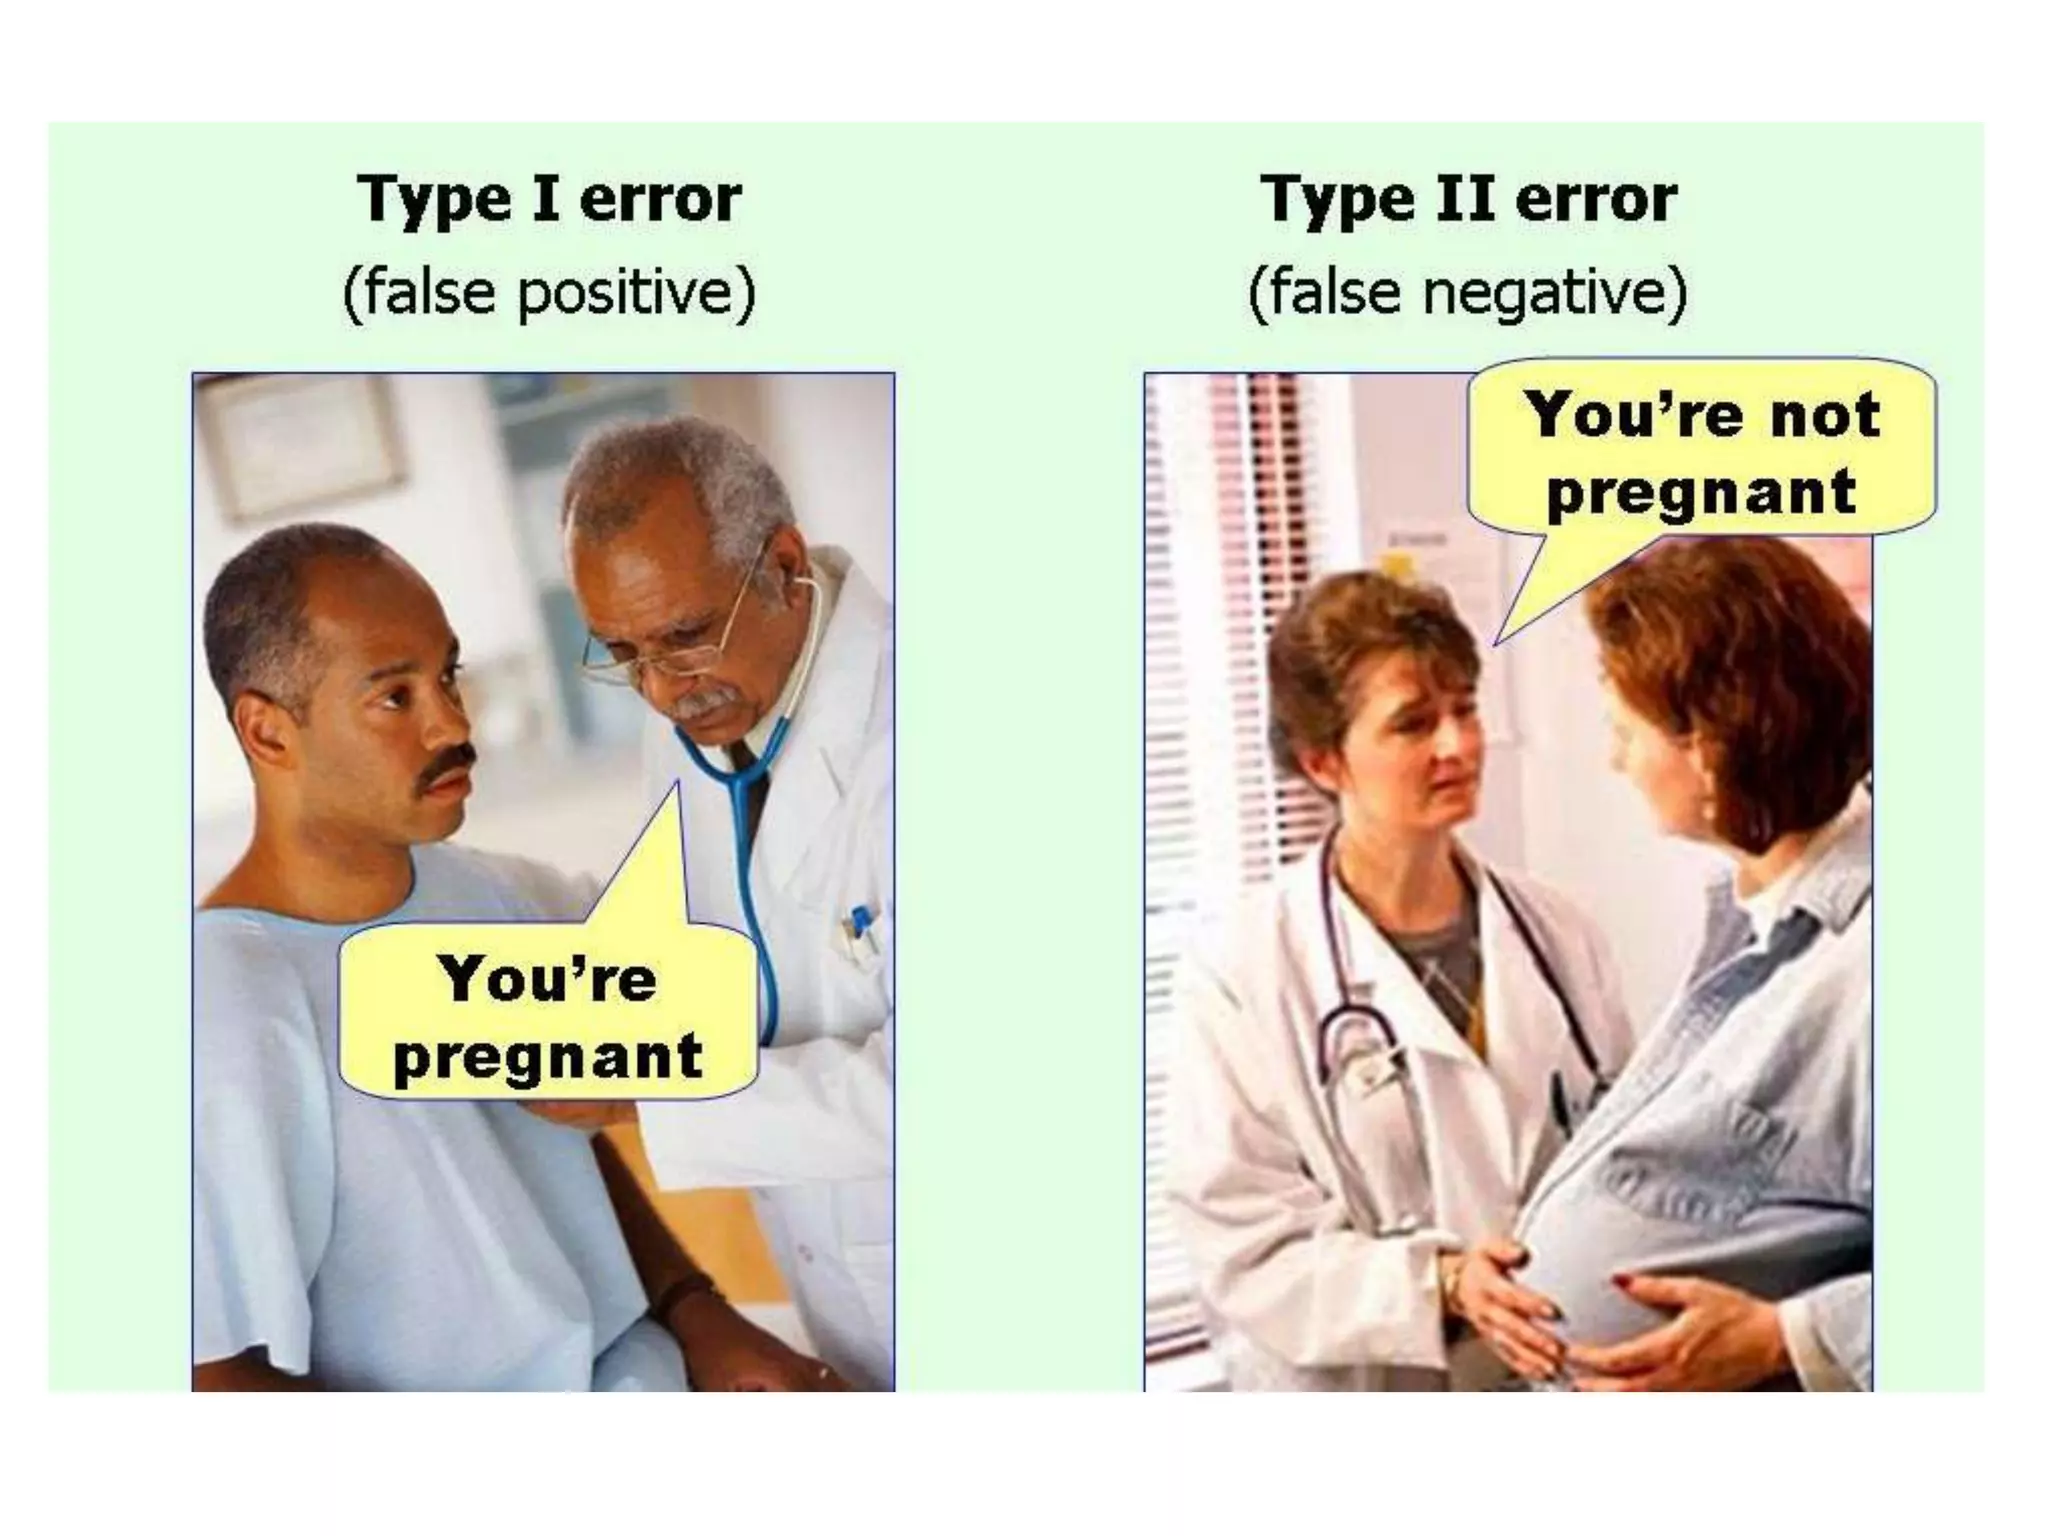
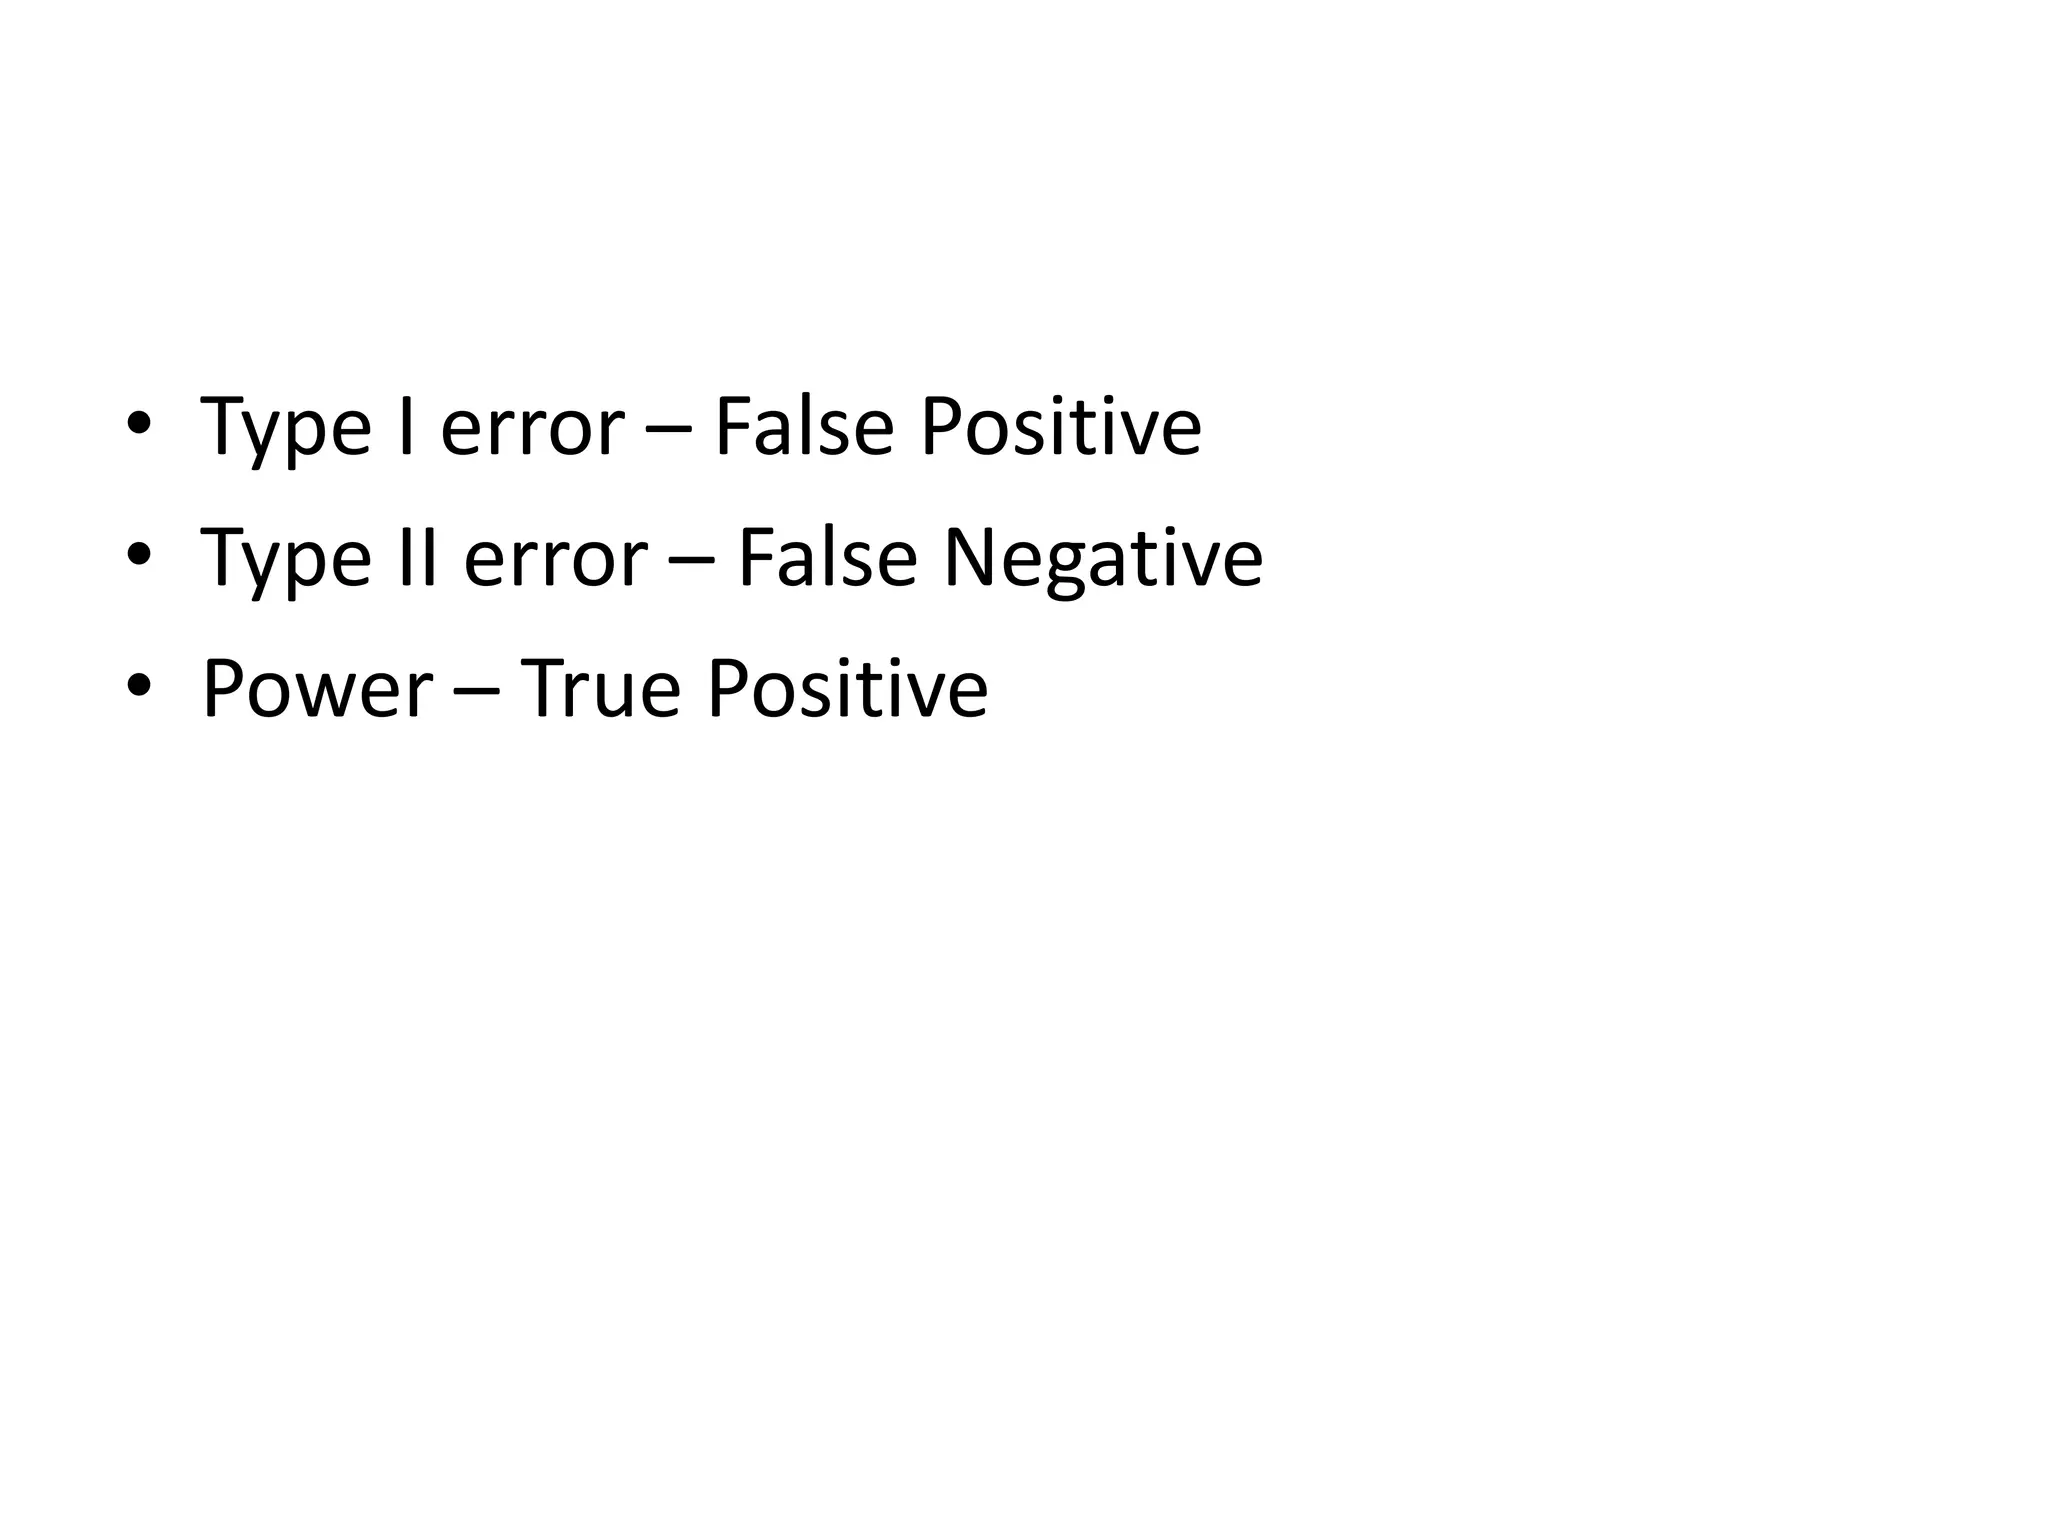
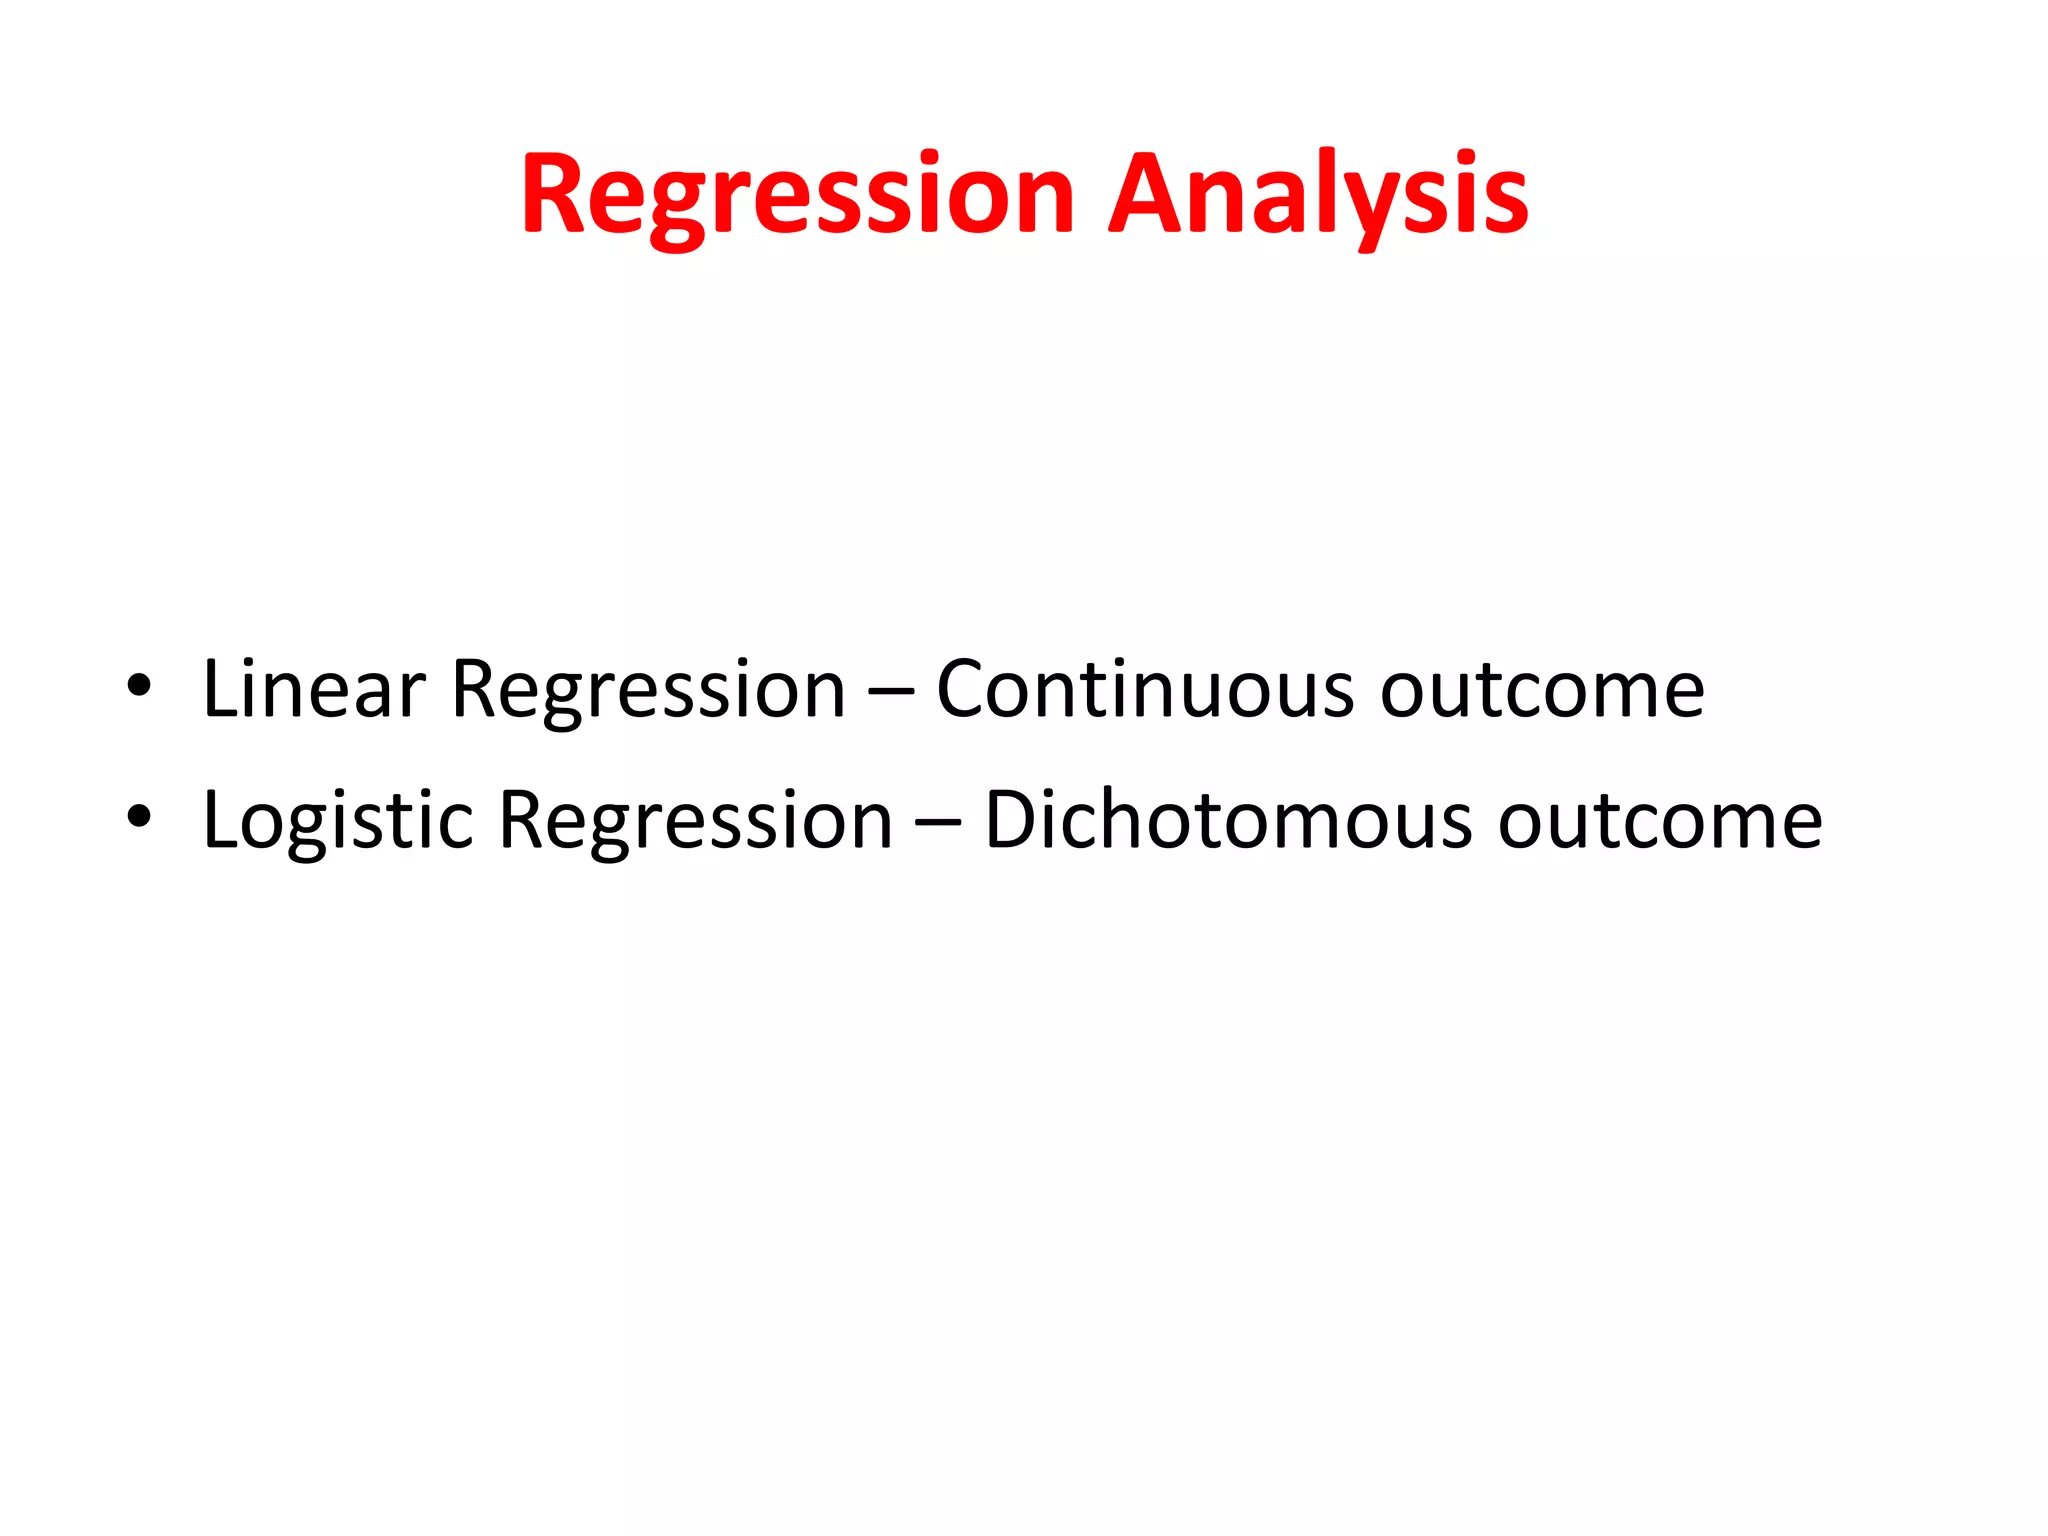
Introduction to Biostatistics
Dr. Inaamul Haq
Assistant Professor, Department of Community Medicine
Government Medical College, Srinagar
MD, Community Medicine (JNMC, AMU, Aligarh)
Advanced Program in Clinical Research and Management (CliniIndia)
Certificate in Research Methods(PHFI)
Basic and Advanced Epidemiology and Biostatistics(PGISPH)
MECOR1
The Physiology of Research
STUDY
POPULATION
Research Question
???
SAMPLE
Select
Inference
The four possible explanations of an
observed association
1. Systematic Error (Bias)
2. Confounding
3. Random Error
4. True Association
Association does not guarantee causation
The 9 Research Questions
1. What is the prevalence of a condition?.
2. What is the average (Mean) of a characteristic?
3. What is the strength of correlation between two
quantitative parameters?
4. What is the agreement between methods?
5. What are the diagnostic characteristics of a candidate
test (categorical/quantitative) with reference to a “Gold
Standard”?
6. What is the incidence of an outcome?
7. What are the predictors of an outcome?
8. What are the risk factors associated with an outcome?
9. Evaluation of a candidate intervention against a control
(standard of care)?
The Research Question
in Analytical Studies
• (P) – Population (the sample of subjects you wish to
recruit for your study)
• (I) – Intervention (the treatment that will be provided
to subjects enrolled in your study)
• (C) – Comparison (what you plan on using as a
reference group to compare with your treatment
intervention)
• (O) – Outcome (what result you plan on measuring to
examine the effectiveness of your intervention)
• (T) – Time (the time frame over which the outcomes
are assessed)
P I C O T
P I C O T
Some examples of PICOT
• In adult patients with knee osteoarthritis (P), how effective
is Hijamah therapy (I) compared to local 1% diclofenac gel
(C) in reducing pain (O) after 6 weeks of therapy (Time)?
• In pregnant females (P) , is the incidence of Pregnancy
Induced Hypertension (O) higher among those with a
family history of clinical hypothyroidism (I) compared to
those without any such family history (C)?
• For patients 65 years and older (P), how does the use of an
influenza vaccine (I) compared to not received the vaccine
(C) influence the risk of developing pneumonia (O) during
flu season (T)?
Variables in Medical Research
•Quantitative
–Blood Sugar, Systolic BP, Age, Weight etc.
•Categorical
–Sex, Disease, Residence etc.
• Outcome / Dependent / Response
• Exposure / Predictor / Explanatory / Independent
• Other variables
Steps in Data Analysis
Data Entry
Data Cleaning
Data Exploration
Descriptive
Statistics
Inferential
Statistics
Data Entry
Spreadsheetfromhell
spreadsheetfromheaven
Data Cleaning and Data Exploration
• Frequency tables
• Histograms
• Cross-tabulations
• Scatterplots
Descriptive Statistics
• Tables
– Frequency tables
– Cross-tabulations/Contingency tables
• Graphs
– Univariable graphs – Simple Bar Charts
– Relational graphs – Stacked Bars, Scatterplots, Boxplots
• Numbers
– Continuous variables, Normal distribution
• Mean and SD
– Continuous variables, Not normally distributed
• Transformation – Mean and SD
– Continuous variables, Not normally distributed / Discrete
measurements
• Five-number summary (Min, 1st quartile, Median, 3rd quartile, Max)
Maximum
Minimum
Median
1st Quartile
3rd Quartile
Inferential Statistics
Estimation
–Point estimation
–Interval estimation
(Confidence Interval)
Hypothesis Testing
Three ways of data analysis
1. Univariable Analysis
2. Bivariable Analysis
1. Categorical versus Categorical
2. Categorical versus Quantitative
3. Quantitative versus Quantitative
3. Multi-variable Analysis
Statistical measures for the 9 questions
1. Proportion
2. Mean, SD
3. Correlation
4. Agreement
5. Sensitivity, Specificity etc
6. Incidence
7. Risk ratio
8. Odds ratio
9. Effect size
FOUR points to consider to choose an
appropriate statistical test
1. Combination of two variables
2. Normal or Non-normal
3. Groups: 2 or >2
4. Related or not related
1. Combination of two variables
• Categorical versus
Categorical
– Chi-square test
– Corrected Chi-square
– Fisher’s Exact Test
– McNemar test
• Categorical versus
Quantitative
– T-TEST
– ANOVA
– Wilcoxon ranksum
test
– Kruskall-Wallis test
– Wilcoxon signed rank
test
1. Combination of two variables ...
• Quantitative versus Quantitative
– Pearsons Correlation coefficient
– Spearmans correlation coefficient
2. Normal or non-normal
• Histogram
• Mean versus Median
• Statistical tests and plots
– QQ plot
– Shapiro-Wilk test
2. Normal or non-normal ...
• Normal
– T-TEST
– ANOVA
– Repeated-measures
ANOVA
• Non-normal
– Wilcoxon ranksum
test
– Wilcoxon signed rank
test
– Kruskall-Wallis test
3. Groups: 2 or >2
• 2 groups
– T-TEST
– Wilcoxon ranksum
test
– Wilcoxon signed rank
test
• >2 groups
– ANOVA
– Kruskall-Wallis test
4. Related or not related
• Related
– Paired T-TEST
– Wilcoxon signed rank
test
– McNemar test
– Repeated measures
ANOVA
– Friedman test
• Not related
– T-test
– Pearson Chi-square
test
– Wilcoxon ranksum
test
– Kruskall-Wallis test
Combination of two variables
Categorical vs
Categorical
Quantitative vs
Quantitative
Related
Not
related
McNemar
•Chi-square
•Fisher’s
exact
Pearsons
Correlation
Spearmans
Correlation
Normal
Not
normal
Combination of two variables
Categorical vs
Quantitative
Normal
Not
normal
2 groups >2 Groups
Related
Not
related
Related
Not
related
Normal
Not
normal
Related
Not
related
Related
Not
related
Paired t-test
Unpaired
t-test
Wilcoxon
signed rank
Wilcoxon
ranksum
Repeated
measures
ANOVA One-way
ANOVA
Friedmann
Kruskall
Wallis
• Type I error – False Positive
• Type II error – False Negative
• Power – True Positive
The p-value
• The P value, or calculated probability, is the
probability of finding the observed, or more
extreme, results when the null hypothesis
(H 0) of a study question is true
Random Error
Regression Analysis
• Linear Regression – Continuous outcome
• Logistic Regression – Dichotomous outcome
https://drive.google.com/file/d/1zWty8vNTL0B7
5oOar6oghpSnzdcn-qxf/view?usp=sharing
THANK YOU

Introduction to biostatistics

  • 1.
    Introduction to Biostatistics Dr.Inaamul Haq Assistant Professor, Department of Community Medicine Government Medical College, Srinagar MD, Community Medicine (JNMC, AMU, Aligarh) Advanced Program in Clinical Research and Management (CliniIndia) Certificate in Research Methods(PHFI) Basic and Advanced Epidemiology and Biostatistics(PGISPH) MECOR1
  • 2.
    The Physiology ofResearch STUDY POPULATION Research Question ??? SAMPLE Select Inference
  • 3.
    The four possibleexplanations of an observed association 1. Systematic Error (Bias) 2. Confounding 3. Random Error 4. True Association Association does not guarantee causation
  • 4.
    The 9 ResearchQuestions 1. What is the prevalence of a condition?. 2. What is the average (Mean) of a characteristic? 3. What is the strength of correlation between two quantitative parameters? 4. What is the agreement between methods? 5. What are the diagnostic characteristics of a candidate test (categorical/quantitative) with reference to a “Gold Standard”? 6. What is the incidence of an outcome? 7. What are the predictors of an outcome? 8. What are the risk factors associated with an outcome? 9. Evaluation of a candidate intervention against a control (standard of care)?
  • 5.
    The Research Question inAnalytical Studies • (P) – Population (the sample of subjects you wish to recruit for your study) • (I) – Intervention (the treatment that will be provided to subjects enrolled in your study) • (C) – Comparison (what you plan on using as a reference group to compare with your treatment intervention) • (O) – Outcome (what result you plan on measuring to examine the effectiveness of your intervention) • (T) – Time (the time frame over which the outcomes are assessed) P I C O T P I C O T
  • 6.
    Some examples ofPICOT • In adult patients with knee osteoarthritis (P), how effective is Hijamah therapy (I) compared to local 1% diclofenac gel (C) in reducing pain (O) after 6 weeks of therapy (Time)? • In pregnant females (P) , is the incidence of Pregnancy Induced Hypertension (O) higher among those with a family history of clinical hypothyroidism (I) compared to those without any such family history (C)? • For patients 65 years and older (P), how does the use of an influenza vaccine (I) compared to not received the vaccine (C) influence the risk of developing pneumonia (O) during flu season (T)?
  • 7.
    Variables in MedicalResearch •Quantitative –Blood Sugar, Systolic BP, Age, Weight etc. •Categorical –Sex, Disease, Residence etc. • Outcome / Dependent / Response • Exposure / Predictor / Explanatory / Independent • Other variables
  • 8.
    Steps in DataAnalysis Data Entry Data Cleaning Data Exploration Descriptive Statistics Inferential Statistics
  • 9.
  • 10.
  • 11.
  • 12.
    Data Cleaning andData Exploration • Frequency tables • Histograms • Cross-tabulations • Scatterplots
  • 17.
    Descriptive Statistics • Tables –Frequency tables – Cross-tabulations/Contingency tables • Graphs – Univariable graphs – Simple Bar Charts – Relational graphs – Stacked Bars, Scatterplots, Boxplots • Numbers – Continuous variables, Normal distribution • Mean and SD – Continuous variables, Not normally distributed • Transformation – Mean and SD – Continuous variables, Not normally distributed / Discrete measurements • Five-number summary (Min, 1st quartile, Median, 3rd quartile, Max)
  • 18.
  • 19.
    Inferential Statistics Estimation –Point estimation –Intervalestimation (Confidence Interval) Hypothesis Testing
  • 20.
    Three ways ofdata analysis 1. Univariable Analysis 2. Bivariable Analysis 1. Categorical versus Categorical 2. Categorical versus Quantitative 3. Quantitative versus Quantitative 3. Multi-variable Analysis
  • 21.
    Statistical measures forthe 9 questions 1. Proportion 2. Mean, SD 3. Correlation 4. Agreement 5. Sensitivity, Specificity etc 6. Incidence 7. Risk ratio 8. Odds ratio 9. Effect size
  • 22.
    FOUR points toconsider to choose an appropriate statistical test 1. Combination of two variables 2. Normal or Non-normal 3. Groups: 2 or >2 4. Related or not related
  • 23.
    1. Combination oftwo variables • Categorical versus Categorical – Chi-square test – Corrected Chi-square – Fisher’s Exact Test – McNemar test • Categorical versus Quantitative – T-TEST – ANOVA – Wilcoxon ranksum test – Kruskall-Wallis test – Wilcoxon signed rank test
  • 24.
    1. Combination oftwo variables ... • Quantitative versus Quantitative – Pearsons Correlation coefficient – Spearmans correlation coefficient
  • 25.
    2. Normal ornon-normal • Histogram • Mean versus Median • Statistical tests and plots – QQ plot – Shapiro-Wilk test
  • 27.
    2. Normal ornon-normal ... • Normal – T-TEST – ANOVA – Repeated-measures ANOVA • Non-normal – Wilcoxon ranksum test – Wilcoxon signed rank test – Kruskall-Wallis test
  • 28.
    3. Groups: 2or >2 • 2 groups – T-TEST – Wilcoxon ranksum test – Wilcoxon signed rank test • >2 groups – ANOVA – Kruskall-Wallis test
  • 29.
    4. Related ornot related • Related – Paired T-TEST – Wilcoxon signed rank test – McNemar test – Repeated measures ANOVA – Friedman test • Not related – T-test – Pearson Chi-square test – Wilcoxon ranksum test – Kruskall-Wallis test
  • 30.
    Combination of twovariables Categorical vs Categorical Quantitative vs Quantitative Related Not related McNemar •Chi-square •Fisher’s exact Pearsons Correlation Spearmans Correlation Normal Not normal
  • 31.
    Combination of twovariables Categorical vs Quantitative Normal Not normal 2 groups >2 Groups Related Not related Related Not related Normal Not normal Related Not related Related Not related Paired t-test Unpaired t-test Wilcoxon signed rank Wilcoxon ranksum Repeated measures ANOVA One-way ANOVA Friedmann Kruskall Wallis
  • 33.
    • Type Ierror – False Positive • Type II error – False Negative • Power – True Positive
  • 34.
    The p-value • TheP value, or calculated probability, is the probability of finding the observed, or more extreme, results when the null hypothesis (H 0) of a study question is true Random Error
  • 35.
    Regression Analysis • LinearRegression – Continuous outcome • Logistic Regression – Dichotomous outcome
  • 36.
  • 37.