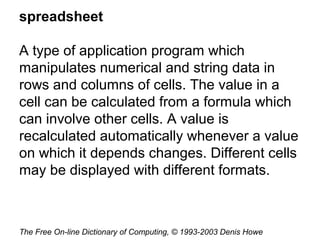
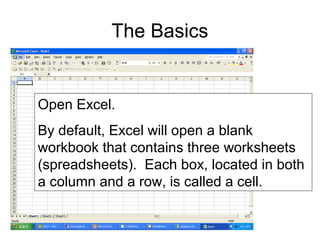
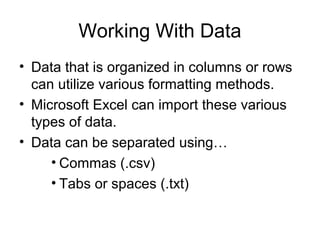
Microsoft Excel is a spreadsheet application that allows users to organize and calculate data across rows and columns in a workbook. It can import various data types and formats them for analysis. Excel uses formulas and functions to perform calculations on cell values. Common functions include SUM to add values and AVERAGE to calculate means. Charts and graphs can visually represent spreadsheet data. Workbooks may contain multiple worksheets to organize different data sets.
Basic Excel training: the training discussed the main components of excel, numeric functions and how to run arithmetic calculations in excel, date functions, text functions, boolean functions, pivot tables, and charts.
If you're a new user, Microsoft Excel can be pretty intimidating. This guide will help you learn 14 essential terms to get you started becoming literate in Excel.
The site present the assignment to the students in well- structured manner including all the information in the simplest form, so that students need not spend extra time and effort in completion of the assignment and along with these they can also gain all the content engraved in the brain.
This lesson aims to know more about Microsoft excel like its definition, basic skills, excel formulas and function, and also tips on how to improve Microsoft excel skills.
This power point can be used to teach children ages 7-12 about some basic functions of the Excel program. This power point helps explain columns, rows, creating graphs & analyzing data. This is a fun power point that can be used as a teaching aid that can allow kids to get excited!
En esta unidad curricular el estudiante tendrá la oportunidad de reforzar los conceptos físicos que utilizan herramientas matemáticas, para fundamentar el
prediseño de estructuras y el dimensionamiento de espacios, a través de procedimientos sencillos y prácticos, que le permitan desarrollar y fortalecer las
destrezas que se requieren para el abordaje inicial de las unidades curriculares que implican cálculo.
Preparing member insurance communications is time-consuming, labor-intensive and prone to compliance risk. With increasingly strict regulations to deliver more accurate and timely benefit information, you need to be able to move with precision.
From start to finish, we simplify member communication development processes to ensure greater accuracy, compliance and timeliness of your content.
Faced with reviewing and updating thousands of paper-based health insurance notifications each month, Express Scripts needed a simplified way to improve turnaround times while increasing efficiency. Learn how this Fortune 25 Health Insurance Plan organization significantly improved productivity & risk management with their document processing.
This tool has 500 pages of different expansion joint types, technical information, guidelines and inspiration on use of expansion joints. It helps everyone in touch with expansion joints in their daily work.
Las innovaciones educativas y las pedagogías informáticasClaudio Rama
Conferencia realizada en el congreso de Virtual Educa Las Américas 2013, Virtual Educa; OEA; Secretaria General Iberoamericana. San Juan, Puerto Rico, diciembre 2013
Handout used by the Westerville Public Library for the Introduction to Excel 2007 class. Provides basic information about creating a spreadsheet using Microsoft Excel 2007.
3. Workbook
1. A booklet containing problems and exercises that
a student may work directly on the pages.
2. A manual containing operating instructions, as for
an appliance or machine.
3. A book in which a record is kept of work proposed
or accomplished.
Worksheet
1. A sheet of paper with multiple columns; used by
an accountant to assemble figures for financial
statements.
2. A piece of paper recording work planned or done
on a project.
http://www.dictionary.com
4. The Basics
Open Excel.
By default, Excel will open a blank
workbook that contains three worksheets
(spreadsheets). Each box, located in both
a column and a row, is called a cell.
5. The Title Bar is located at the very top of the screen. On the Title bar,
Microsoft Excel displays the name of the workbook you are currently using. At
the top of your screen, you should see "Microsoft Excel - Book1" or a similar
name.
The Menu Bar is directly below the Title bar and displays the menu. The menu
begins with the word File and continues with the following: Edit, View, Insert,
Format, Tools, Data, Window, and Help. You use the menu to give instructions
to the software. Point with your mouse to a menu option and click the left mouse
button. A drop-down menu will appear. You can now use the left and right arrow
keys on your keyboard to move left and right across the Menu bar options. You
can use the up and down arrow keys to move up and down the drop-down
menu. To select an option, highlight the item on the drop-down menu and press
Enter.
7. Microsoft Excel consists of worksheets. Each worksheet contains columns
and rows. The columns are lettered A to IV; the rows are numbered 1 to
65536. The combination of column and row coordinates make up a
cell address. For example, the cell located in the upper left corner of the
worksheet is cell A1, meaning column A, row 1. Cell E10 is located under
column E on row 10. You enter your data into the cells on the worksheet.
8. Cells can be
formatted to help
handle various
types of data.
Right click on a
single cell, or a
group of cells, and
select “Format
Cells” from the
drop down menu.
CELLS
9. Brief descriptions
of format types
can be seen at
the bottom of the
dialog box. Take
a moment to look
through the
various formatting
options. Click
cancel when
you’re done.
10. Type a number into
cell 1A, right click on
the cell, and select
“Format Cells.” Note
that a sample format
is shown on the top
right of the dialog
box. You can adjust
the number of
decimal places and
any preceding
symbols.
13. Working With Data
• Data that is organized in columns or rows
can utilize various formatting methods.
• Microsoft Excel can import these various
types of data.
• Data can be separated using…
• Commas (.csv)
• Tabs or spaces (.txt)
22. Right click on the
new worksheet, then
select paste from
the drop down
menu.
23. The “Fill” Feature
You can quickly fill in several types of
data series by selecting cells and
dragging the fill handle or by using the
Series command (point to Fill on the
Edit menu, and then click Series).
24. Highlight the data you
want to graphically
represent. Then click
the chart wizard icon on
your toolbar
Charts and Graphs
26. Notice that the Chart toolbar appears when
you insert a chart. You can edit the charts
properties at any time.
27. Formulas and Functions
• Formulas are equations that perform
calculations on values in your worksheet. A
formula starts with an equal sign (=). For
example, the following formula multiplies 2 by 3
and then adds 5 to the result. =5+2*3
• Functions are predefined formulas that perform
calculations by using specific values, called
arguments, in a particular order, or structure.
Functions can be used to perform simple or
complex calculations.
28. Looking at cell I19, we
can see that there are
no special functions
associated with the
data. Using a simple
function can help make
regular updates to the
data easier.
29. In this case, you can
simply click on the
Autosum button while
cell I19 is selected, and
Excel will identify the
which cells to include
when calculating a total
revenue figure for
FY2005. Hit enter to
lock the sum in. Notice
that the function reads:
=SUM(I12:I18)
30. The same can be done using a
formula, instead of a function.
=I12+I13+I14+I15+I16+I17+I18
This long expression helps to
show why functions are handy
tools.
31. A variety of functions are
available. In cell L21, I can
use the average function to
determine a yearly average
for forecasted revenue.
fx=AVERAGE(I19:K19) or
fx=AVERAGE(I19, J19,
K19) or fx=(I19+J19+K19)/3
32. Click on the small
down arrow next to
the function symbol
(the epsilon). Select
“More Functions.”
33. One more thing about formulas
and functions:
You can utilize data from other
worksheets in order to populate
cells. The figure in cell c16 is
the sum of I19 through k19 on
worksheet sample5yr4cast.
=SUM(sample5yr4cast!I19:K19)
35. To see all
printing options,
make sure you
select print from
the file menu.
Clicking on the
printer icon on
your toolbar will
allow to print
directly to your
default printer
with default
options.