Downloaded 161 times
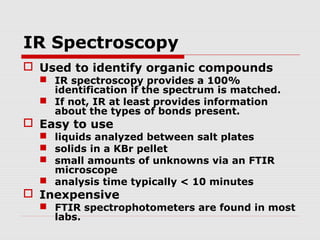
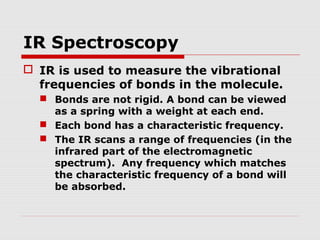


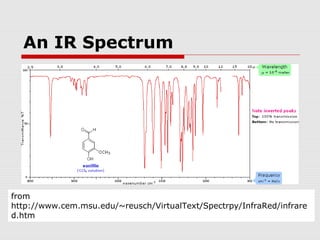


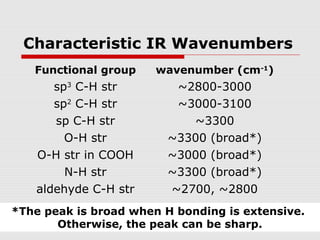
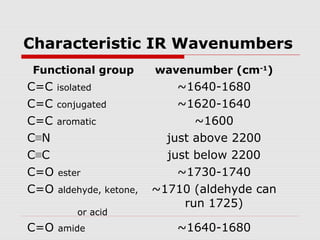
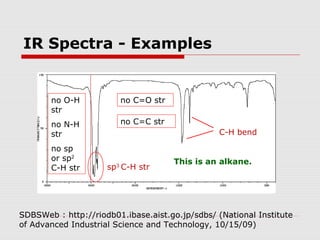
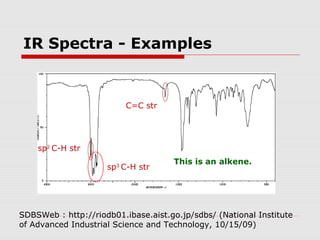
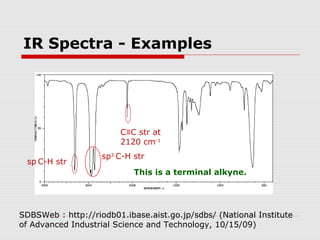
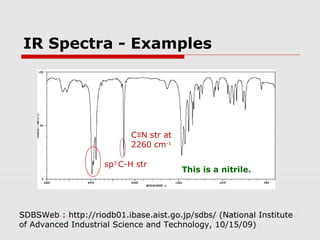
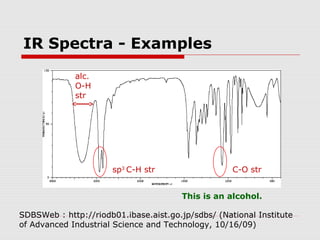
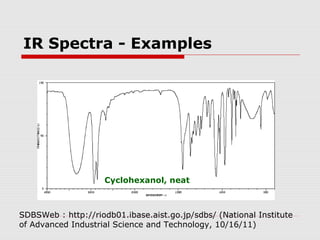
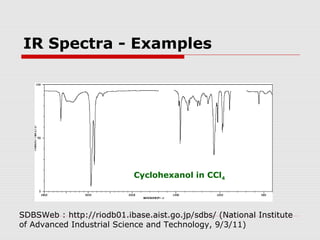
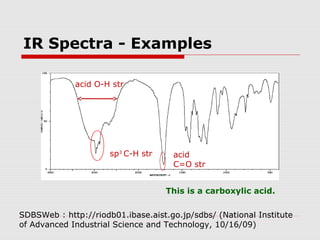
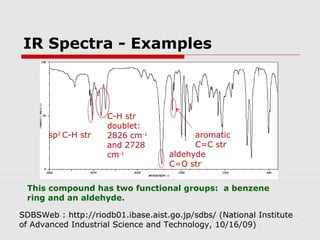
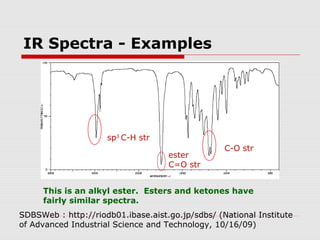
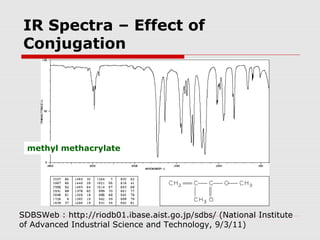
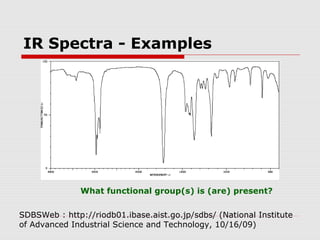

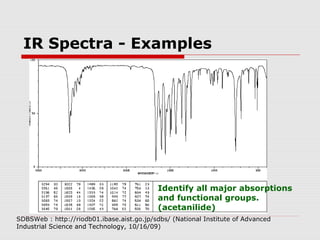


Infrared spectroscopy can be used to identify organic compounds by analyzing their infrared absorption spectra. IR spectroscopy measures the vibrational frequencies of bonds in a molecule. Each type of bond absorbs infrared radiation at characteristic frequencies that appear as peaks in the IR spectrum. The presence or absence of peaks corresponding to common functional groups like C=O, O-H, N-H, etc. allows the identification of bonds and functional groups in an unknown sample.