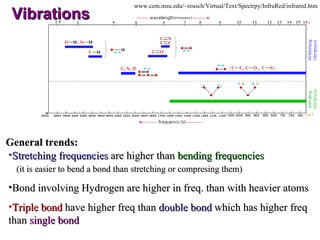
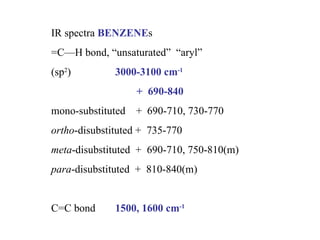
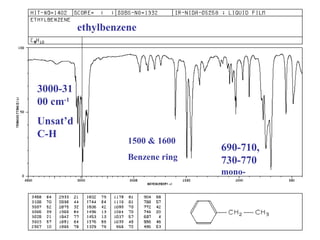
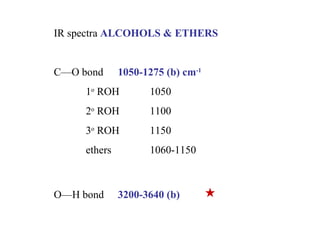
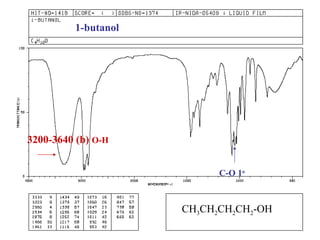
Infrared spectroscopy involves measuring the absorption or emission of electromagnetic radiation by molecules as they undergo transitions between different energy states. Infrared spectroscopy analyzes the infrared region of the electromagnetic spectrum, where molecules absorb radiation based on the vibrational and rotational motions of their bonds. The positions and intensities of absorption bands in an infrared spectrum provide information about the types of bonds in a molecule and can be used to determine its structure.
Infrared spectroscopy deals with the infrared region of the electromagnetic spectrum, that is light with a longer wavelength and lower frequency than visible light. Infrared Spectroscopy is an analysis of infrared light interacting with a molecule.
The IR spectroscopy can be analyzed in three ways: by measuring absorption, emission, and reflection. The major use of this technique is in organic and inorganic chemistry to determine functional groups of molecules. A basic IR spectrum is essentially a graph of infrared light absorbed on the vertical axis vs. frequency or wavelength on the horizontal axis.
X-ray photoelectron spectroscopy (XPS) or Electron spectroscopy for chemical analysis (ESCA) is used to investigate the chemistry at the surface of the samples. The basic mechanism behind an XPS instrument is that the photons of a specific energy are used to excite the electronic states of atoms at and just below the surface of the sample.
There are several areas suited to measurement by XPS:
1. Elemental composition
2. Empirical formula determination
3. Chemical state
4. Electronic state
5. Binding energy
6. Layer thickness in the upper portion of surfaces
XPS has many advantages, such as it is is good for identifying all but two elements, identifying the chemical state on surfaces, and is good with quantitative analysis. XPS is capable of detecting the difference in the chemical state between samples. XPS is also able to differentiate between oxidations states of molecules.
XPS has also some limitations, for instance, samples for XPS must be compatible with the ultra high vacuum environment. XPS is limited to measurements of elements having atomic numbers of 3 or greater, making it unable to detect hydrogen or helium. XPS spectra also take a long time to obtain. The use of a monochromator can also reduce the time per experiment.
Applications of IR (Infrared) Spectroscopy in Pharmaceutical Industrywonderingsoul114
Various applications of IR (Infrared) Spectroscopy in Pharmaceutical industries related to drug discovery and structural elucidation is outlined in this presentation. Various qualitative and quantitative analysis of drug products are also outlined.
Fourier transform infrared spectroscopy: advantage and disadvantage of conventional infrared spectroscopy, introduction to FTIR ,principle of FTIR, working, advantage, disadvantage and application of FTIR.
Raman Spectroscopy - Principle, Criteria, Instrumentation and ApplicationsPrabha Nagarajan
Basic principle of Raman scattering- Difference between Rayleigh and Raman Scattering- Major criteria for Raman active in compounds,-Stroke's lines and Anti-stoke lines- Difference and between IR and Raman spectroscopy- Wide applications of Raman spectroscopy.
CHECKOUT THIS NEW WEB BROWSER :
https://www.entireweb.com/?a=618b79ed612f3
In mass spectrometry, fragmentation is the dissociation of energetically unstable molecular ions formed from passing the molecules in the ionization chamber of a mass spectrometer. The fragments of a molecule cause a unique pattern in the mass spectrum.
La región del infrarrojo (IR) del espectro abarca la radiación con números de ondas comprendidos entre 12.800 y los 10 cm-1, que corresponde a longitudes de onda de 0,78, 1.000 μm. Tanto desde el punto de vista de las aplicaciones como de la instrumentación, es conveniente dividir el espectro IR en tres regiones denominadas infrarrojo cercano, medio y lejano. Las técnicas de las aplicaciones de los métodos basados en cada una de estas regiones difieren considerablemente.
Electromagnetic radiation consists of waves of the electromagnetic field, propagating through space, carrying electromagnetic radiant energy. It includes radio waves, microwaves, infrared, light, ultraviolet, X-rays, and gamma rays. All of these waves form part of the electromagnetic spectrum.EMR is released when excited atoms or molecules return to ground state and this process is called emisssion.
EMR has both electric (E) and magnetic (H) components that propagate at right angles to each other.
Infrared spectroscopy is technique to identify the functional group of the molecule.
In Infrared spectroscopy there are two main region finger print region and functional group region. Most of the molecules identifies In the finger print region due to that it is complex region.
Now we will see the
principle of IR spectroscopy:
IR spectroscopy is vibrational energy level changes when IR radiation passes through the material.
Introduction to Spectroscopy,
Introduction to UV, electronic transitions, terminology, chromophore, Auxochrome, Examples and Applications.
Introduction to IR, Fundamental vibrations, Types of Vibrations, Factors affecting the vibrational freaquencies, Group frequencies, examples and applications.
Ultraviolet spetroscopy by Dr. Monika Singh part-1 as per PCI syllabusMonika Singh
UV Visible spectroscopy as per PCI syllabus: Electronic transitions, chromophores, auxochromes, spectral shifts, solvent effect on absorption spectra, Beer and Lambert’s law, Derivation and deviations.
Muktapishti is a traditional Ayurvedic preparation made from Shoditha Mukta (Purified Pearl), is believed to help regulate thyroid function and reduce symptoms of hyperthyroidism due to its cooling and balancing properties. Clinical evidence on its efficacy remains limited, necessitating further research to validate its therapeutic benefits.
Title: Sense of Taste
Presenter: Dr. Faiza, Assistant Professor of Physiology
Qualifications:
MBBS (Best Graduate, AIMC Lahore)
FCPS Physiology
ICMT, CHPE, DHPE (STMU)
MPH (GC University, Faisalabad)
MBA (Virtual University of Pakistan)
Learning Objectives:
Describe the structure and function of taste buds.
Describe the relationship between the taste threshold and taste index of common substances.
Explain the chemical basis and signal transduction of taste perception for each type of primary taste sensation.
Recognize different abnormalities of taste perception and their causes.
Key Topics:
Significance of Taste Sensation:
Differentiation between pleasant and harmful food
Influence on behavior
Selection of food based on metabolic needs
Receptors of Taste:
Taste buds on the tongue
Influence of sense of smell, texture of food, and pain stimulation (e.g., by pepper)
Primary and Secondary Taste Sensations:
Primary taste sensations: Sweet, Sour, Salty, Bitter, Umami
Chemical basis and signal transduction mechanisms for each taste
Taste Threshold and Index:
Taste threshold values for Sweet (sucrose), Salty (NaCl), Sour (HCl), and Bitter (Quinine)
Taste index relationship: Inversely proportional to taste threshold
Taste Blindness:
Inability to taste certain substances, particularly thiourea compounds
Example: Phenylthiocarbamide
Structure and Function of Taste Buds:
Composition: Epithelial cells, Sustentacular/Supporting cells, Taste cells, Basal cells
Features: Taste pores, Taste hairs/microvilli, and Taste nerve fibers
Location of Taste Buds:
Found in papillae of the tongue (Fungiform, Circumvallate, Foliate)
Also present on the palate, tonsillar pillars, epiglottis, and proximal esophagus
Mechanism of Taste Stimulation:
Interaction of taste substances with receptors on microvilli
Signal transduction pathways for Umami, Sweet, Bitter, Sour, and Salty tastes
Taste Sensitivity and Adaptation:
Decrease in sensitivity with age
Rapid adaptation of taste sensation
Role of Saliva in Taste:
Dissolution of tastants to reach receptors
Washing away the stimulus
Taste Preferences and Aversions:
Mechanisms behind taste preference and aversion
Influence of receptors and neural pathways
Impact of Sensory Nerve Damage:
Degeneration of taste buds if the sensory nerve fiber is cut
Abnormalities of Taste Detection:
Conditions: Ageusia, Hypogeusia, Dysgeusia (parageusia)
Causes: Nerve damage, neurological disorders, infections, poor oral hygiene, adverse drug effects, deficiencies, aging, tobacco use, altered neurotransmitter levels
Neurotransmitters and Taste Threshold:
Effects of serotonin (5-HT) and norepinephrine (NE) on taste sensitivity
Supertasters:
25% of the population with heightened sensitivity to taste, especially bitterness
Increased number of fungiform papillae
Recomendações da OMS sobre cuidados maternos e neonatais para uma experiência pós-natal positiva.
Em consonância com os ODS – Objetivos do Desenvolvimento Sustentável e a Estratégia Global para a Saúde das Mulheres, Crianças e Adolescentes, e aplicando uma abordagem baseada nos direitos humanos, os esforços de cuidados pós-natais devem expandir-se para além da cobertura e da simples sobrevivência, de modo a incluir cuidados de qualidade.
Estas diretrizes visam melhorar a qualidade dos cuidados pós-natais essenciais e de rotina prestados às mulheres e aos recém-nascidos, com o objetivo final de melhorar a saúde e o bem-estar materno e neonatal.
Uma “experiência pós-natal positiva” é um resultado importante para todas as mulheres que dão à luz e para os seus recém-nascidos, estabelecendo as bases para a melhoria da saúde e do bem-estar a curto e longo prazo. Uma experiência pós-natal positiva é definida como aquela em que as mulheres, pessoas que gestam, os recém-nascidos, os casais, os pais, os cuidadores e as famílias recebem informação consistente, garantia e apoio de profissionais de saúde motivados; e onde um sistema de saúde flexível e com recursos reconheça as necessidades das mulheres e dos bebês e respeite o seu contexto cultural.
Estas diretrizes consolidadas apresentam algumas recomendações novas e já bem fundamentadas sobre cuidados pós-natais de rotina para mulheres e neonatos que recebem cuidados no pós-parto em unidades de saúde ou na comunidade, independentemente dos recursos disponíveis.
É fornecido um conjunto abrangente de recomendações para cuidados durante o período puerperal, com ênfase nos cuidados essenciais que todas as mulheres e recém-nascidos devem receber, e com a devida atenção à qualidade dos cuidados; isto é, a entrega e a experiência do cuidado recebido. Estas diretrizes atualizam e ampliam as recomendações da OMS de 2014 sobre cuidados pós-natais da mãe e do recém-nascido e complementam as atuais diretrizes da OMS sobre a gestão de complicações pós-natais.
O estabelecimento da amamentação e o manejo das principais intercorrências é contemplada.
Recomendamos muito.
Vamos discutir essas recomendações no nosso curso de pós-graduação em Aleitamento no Instituto Ciclos.
Esta publicação só está disponível em inglês até o momento.
Prof. Marcus Renato de Carvalho
www.agostodourado.com
Ozempic: Preoperative Management of Patients on GLP-1 Receptor Agonists Saeid Safari
Preoperative Management of Patients on GLP-1 Receptor Agonists like Ozempic and Semiglutide
ASA GUIDELINE
NYSORA Guideline
2 Case Reports of Gastric Ultrasound
Rasamanikya is a excellent preparation in the field of Rasashastra, it is used in various Kushtha Roga, Shwasa, Vicharchika, Bhagandara, Vatarakta, and Phiranga Roga. In this article Preparation& Comparative analytical profile for both Formulationon i.e Rasamanikya prepared by Kushmanda swarasa & Churnodhaka Shodita Haratala. The study aims to provide insights into the comparative efficacy and analytical aspects of these formulations for enhanced therapeutic outcomes.
Knee anatomy and clinical tests 2024.pdfvimalpl1234
This includes all relevant anatomy and clinical tests compiled from standard textbooks, Campbell,netter etc..It is comprehensive and best suited for orthopaedicians and orthopaedic residents.
DISSERTATION on NEW DRUG DISCOVERY AND DEVELOPMENT STAGES OF DRUG DISCOVERYNEHA GUPTA
The process of drug discovery and development is a complex and multi-step endeavor aimed at bringing new pharmaceutical drugs to market. It begins with identifying and validating a biological target, such as a protein, gene, or RNA, that is associated with a disease. This step involves understanding the target's role in the disease and confirming that modulating it can have therapeutic effects. The next stage, hit identification, employs high-throughput screening (HTS) and other methods to find compounds that interact with the target. Computational techniques may also be used to identify potential hits from large compound libraries.
Following hit identification, the hits are optimized to improve their efficacy, selectivity, and pharmacokinetic properties, resulting in lead compounds. These leads undergo further refinement to enhance their potency, reduce toxicity, and improve drug-like characteristics, creating drug candidates suitable for preclinical testing. In the preclinical development phase, drug candidates are tested in vitro (in cell cultures) and in vivo (in animal models) to evaluate their safety, efficacy, pharmacokinetics, and pharmacodynamics. Toxicology studies are conducted to assess potential risks.
Before clinical trials can begin, an Investigational New Drug (IND) application must be submitted to regulatory authorities. This application includes data from preclinical studies and plans for clinical trials. Clinical development involves human trials in three phases: Phase I tests the drug's safety and dosage in a small group of healthy volunteers, Phase II assesses the drug's efficacy and side effects in a larger group of patients with the target disease, and Phase III confirms the drug's efficacy and monitors adverse reactions in a large population, often compared to existing treatments.
After successful clinical trials, a New Drug Application (NDA) is submitted to regulatory authorities for approval, including all data from preclinical and clinical studies, as well as proposed labeling and manufacturing information. Regulatory authorities then review the NDA to ensure the drug is safe, effective, and of high quality, potentially requiring additional studies. Finally, after a drug is approved and marketed, it undergoes post-marketing surveillance, which includes continuous monitoring for long-term safety and effectiveness, pharmacovigilance, and reporting of any adverse effects.
ABDOMINAL TRAUMA in pediatrics part one.drhasanrajab
Abdominal trauma in pediatrics refers to injuries or damage to the abdominal organs in children. It can occur due to various causes such as falls, motor vehicle accidents, sports-related injuries, and physical abuse. Children are more vulnerable to abdominal trauma due to their unique anatomical and physiological characteristics. Signs and symptoms include abdominal pain, tenderness, distension, vomiting, and signs of shock. Diagnosis involves physical examination, imaging studies, and laboratory tests. Management depends on the severity and may involve conservative treatment or surgical intervention. Prevention is crucial in reducing the incidence of abdominal trauma in children.
micro teaching on communication m.sc nursing.pdfAnurag Sharma
Microteaching is a unique model of practice teaching. It is a viable instrument for the. desired change in the teaching behavior or the behavior potential which, in specified types of real. classroom situations, tends to facilitate the achievement of specified types of objectives.
These lecture slides, by Dr Sidra Arshad, offer a quick overview of the physiological basis of a normal electrocardiogram.
Learning objectives:
1. Define an electrocardiogram (ECG) and electrocardiography
2. Describe how dipoles generated by the heart produce the waveforms of the ECG
3. Describe the components of a normal electrocardiogram of a typical bipolar lead (limb II)
4. Differentiate between intervals and segments
5. Enlist some common indications for obtaining an ECG
6. Describe the flow of current around the heart during the cardiac cycle
7. Discuss the placement and polarity of the leads of electrocardiograph
8. Describe the normal electrocardiograms recorded from the limb leads and explain the physiological basis of the different records that are obtained
9. Define mean electrical vector (axis) of the heart and give the normal range
10. Define the mean QRS vector
11. Describe the axes of leads (hexagonal reference system)
12. Comprehend the vectorial analysis of the normal ECG
13. Determine the mean electrical axis of the ventricular QRS and appreciate the mean axis deviation
14. Explain the concepts of current of injury, J point, and their significance
Study Resources:
1. Chapter 11, Guyton and Hall Textbook of Medical Physiology, 14th edition
2. Chapter 9, Human Physiology - From Cells to Systems, Lauralee Sherwood, 9th edition
3. Chapter 29, Ganong’s Review of Medical Physiology, 26th edition
4. Electrocardiogram, StatPearls - https://www.ncbi.nlm.nih.gov/books/NBK549803/
5. ECG in Medical Practice by ABM Abdullah, 4th edition
6. Chapter 3, Cardiology Explained, https://www.ncbi.nlm.nih.gov/books/NBK2214/
7. ECG Basics, http://www.nataliescasebook.com/tag/e-c-g-basics
1. Infrared Spectroscopy Spectroscopy is the measurement of the absorption or emission of energy by matter (atoms or molecules) when it is subjected to electromagnetic radiation. A spectrophotometer measures the energy changes that take place within a molecule when it is irradiated and records these changes as spectra . In absorption spectroscopy , molecules absorb energy and undergo transitions from the ground state to an excited state of the molecule. The type of spectroscopy involved will depend on the region of the electromagnetic spectrum that is used as a radiation source. In Infrared Spectroscopy , molecules absorb infrared radiation which brings about changes in stretching and bending motions of the molecule. The radiation absorbed is in the energy range with wavelengths (λ) between 2.5 and 17 μm (4000 cm -1 to 600 cm -1 ). In Electronic (UV-visible) Spectroscopy, molecules absorb radiation in the UV-visible region (200 - 800 nm). This brings about electronic transitions within the molecule. Since absorption of radiation is quantized ( i.e. it is subject to certain quantum mechanical restrictions), only the allowed frequencies of radiation appear as absorption bands in the spectrum.
2. Vibrational Spectroscopy All chemical bonds have a natural frequency of vibration (C-H, O-H, C=O, C-C, C=C) but the exact frequency will depend on their environment, i.e. on the actual structure of the molecule involved. Identification of the vibrational frequencies indicates the different bonds present in a molecule and provides structural information about that molecule. An infrared spectrum is a plot of % transmittance (y-axis) versus energy (cm -1 ) (x-axis) in the range 4000 cm -1 to 600 cm -1 .
3.
4. The Units: The frequency (s -1 ) => # vibrations per second For molecular vibrations, this number is very large (10 13 s -1 ) => inconvenient e.g. = 3 * 10 13 s -1 = 1000 cm -1 Wave Length : 1 = More convenient : Wavenumber = c ( Frequency / Velocity ) = s 3 * 10 10 cm s -1
5. Intensity in IR Intensity: Transmittance ( T ) or %T Absorbance ( A ) IR : Plot of %IR that passes through a sample ( transmittance ) vs Wavelenght T = I I 0 A = log I I 0
9. Introduction IR is one of the first technique inorganic chemists used (since 1940) Molecular Vibration Newton’s law of motion is used classically to calculate force constant r r e F F The basic picture : atoms (mass) are connected with bonding electrons. R e is the equilibrium distance and F : force to restore equilibrium F(x) = - k x where X is displacement from equilibrium Where K i is the force constant and i is reduce mass of a particular motion Because the energy is quantized: E = h i = 1 2 √ k i i
10. Introduction Displacement of atoms during vibration lead to distortion of electrival charge distribution of the molecule which can be resolve in dipole, quadrupole, octopole …. In various directions => Molecular vibration lead to oscillation of electric charge governed by vibration frequencies of the system Oscillating molecular dipole can interact directly with oscillating electric vector of electromagnetic radiation of the same frequency h = h Vibrations are in the range 10 11 to 10 13 Hz => 30 - 3,000 cm -1
11.
12. Calculating stretching frequencies Hooke’s law : : Frequency in cm -1 c : Velocity of light => 3 * 10 10 cm/s K : Force constant => dynes /cm masses of atoms in grams C —C K = 5* 10 5 dynes/cm C =C K = 10* 10 5 dynes/cm C C K = 15* 10 5 dynes/cm = 1 2 c K m 1 m 2 m 1 + m 2 M 1 M 2 M 1 + M 2 (6.02 * 10 23 ) = 4.12 K
13. Calculating stretching frequencies C =C K = 10* 10 5 dynes/cm C —H K = 5* 10 5 dynes/cm C —D K = 5* 10 5 dynes/cm = 4.12 K M 1 M 2 M 1 + M 2 (12)(12) 12 + 12 = 4.12 10* 10 5 = 1682 cm -1 Experimental 1650 cm -1 = 4.12 5* 10 5 = 3032 cm -1 M 1 M 2 M 1 + M 2 (12)(1) 12 + 1 Experimental 3000 cm -1 = 4.12 5* 10 5 = 2228 cm -1 M 1 M 2 M 1 + M 2 (12)(2) 12 + 2 Experimental 2206 cm -1
18. Analyzing an IR spectrum In practice, there are similarities between frequencies of molecules containing similar groups. Group - frequency correlations have been extensively developed for organic compounds and some have also been developed for inorganics
19. Some characteristic infrared absorption frequencies BOND COMPOUND TYPE FREQUENCY RANGE, cm -1 C-H alkanes 2850-2960 and 1350-1470 alkenes 3020-3080 (m) and RCH=CH2 910-920 and 990-1000 R2C=CH2 880-900 cis -RCH=CHR 675-730 (v) trans -RCH=CHR 965-975 aromatic rings 3000-3100 (m) and monosubst. 690-710 and 730-770 ortho -disubst. 735-770 meta -disubst. 690-710 and 750-810 (m) para -disubst. 810-840 (m) alkynes 3300 O-H alcohols or phenols 3200-3640 (b) C=C alkenes 1640-1680 (v) aromatic rings 1500 and 1600 (v) C≡C alkynes 2100-2260 (v) C-O primary alcohols 1050 (b) secondary alcohols 1100 (b) tertiary alcohols 1150 (b) phenols 1230 (b) alkyl ethers 1060-1150 aryl ethers 1200-1275(b) and 1020-1075 (m) all abs. strong unless marked: m, moderate; v, variable; b, broad
20.
21. n -pentane CH 3 CH 2 CH 2 CH 2 CH 3 3000 cm -1 1470 &1375 cm -1 2850-2960 cm -1 sat’d C-H n -pentane CH 3 CH 2 CH 2 CH 2 CH 3 3000 cm -1 1470 &1375 cm -1 2850-2960 cm -1 sat’d C-H
38. Symmetrical and asymmetrical stretch Methyl 2872 cm -1 Symmetrical Stretch Asymmetrical Stretch Anhydride 1760 cm -1 2962 cm -1 1800 cm -1 Amino Nitro 3300 cm -1 3400 cm -1 1350 cm -1 1550 cm -1 — C — H H H — C — H H H O O O O O O — N H H — N H H — N O O — N O O
39. General IR comments Precise treatment of vibrations in molecule is not feasible here Some information from IR is also contained in MS and NMR Certain bands occur in narrow regions : OH , CH , C=O Detail of the structure is revealed by the exact position of the band e.g. Ketones 1715 cm -1 1680 cm -1 Region 4000 – 1300 : Functional group Absence of band in this region can be used to deduce absence of groups Caution: some bands can be very broad because of hydrogen bonding e.g. Enols v.broad OH, C=O absent!! Weak bands in high frequency are extremely useful : S-H, C C, C N Lack of strong bands in 900-650 means no aromatic
40. Alkanes , Alkenes , Alkynes C-H : <3000 cm -1 >3000 cm -1 3300 cm -1 sharp C-C Stretch Not useful C=C C C 1660-1600 cm -1 conj. Moves to lower values Symmetrical : no band 2150 cm -1 conj. Moves to lower values Weak but very useful Symmetrical no band Bending CH 2 Rocking 720 cm -1 indicate Presence of 4-CH 2 1000-700 cm -1 Indicate substitution pattern C-H ~630 cm -1 Strong and broad Confirm triple bond
43. Alkene : 1-Decene To give rise to absorption of IR => Oscillating Electric Dipole Symmetry Molecules with Center of symmetry Symmetric vibration => inactive Antisymmetric vibration => active
44. Alkene In large molecule local symmetry produce weak or absent vibration C=C R R trans C=C isomer -> weak in IR Observable in Raman
45. Alkene: Factors influencing vibration frequency 1- Strain move peak to right (decrease ) angle 1650 1646 1611 1566 1656 : exception 2- Substitution increase 3- conjugation decrease C=C-Ph 1625 cm -1 1566 1641 1675 1611 1650 1679 1646 1675 1681 C C C
49. In IR, Most important transition involve : Ground State ( i = 0) to First Excited State ( i = 1) Transition ( i = 0) to ( J = 2) => Overtone
50. IR : Aromatic =C-H > 3000 cm -1 C=C 1600 and 1475 cm -1 =C-H out of plane bending: great utility to assign ring substitution overtone 2000-1667: useful to assign ring substitution e.g. Naphthalene: Substitution pattern Isolated H 862-835 835-805 760-735 2 adjacent H 4 adjacent H out of plane bending
55. IR: Alcohols and Phenols O-H Free : Sharp 3650-3600 O-H H-Bond : Broad 3400-3300 Intermolecular Hydrogen bonding Increases with concentration => Less “Free” OH
56. IR: Alcohols and Phenols C-O : 1260-1000 cm -1 (coupled to C-C => C-C-O) C-O Vibration is sensitive to substitution: Phenol 1220 3` Alcohols 1150 2` Alcohols 1100 1` Alcohols 1050 More complicated than above: shift to lower Wavenumber With unsaturation (Table 3.2)
63. IR: Carbonyl From 1850 – 1650 cm -1 Ketone 1715 cm -1 is used as reference point for comparisons 1715 1690 1725 1700 1710 1680 1810 Anhydr Band 1800 Acid Chloride 1760 Anhydr Band 2 1735 Ester 1725 Aldehyde 1715 Ketone 1710 Acid 1690 Amide Factor influencing C=O 1) conjugation Conjugation increase single bond character of C=O Lower force constant lower frequency number C=C C O C + — C C O -
65. Ketone and Ring Strain Ring Strain: Higher Factors influencing C=O 2) Ring size 1715 cm -1 Angle ~ 120 o 1751 cm -1 < 120 o 1775 cm -1 << 120 o
66.
67. Factors influencing carbonyl: C=O 3) substitution effect (Chlorine or other halogens) Result in stronger bound higher frequency 1750 cm -1 4) Hydrogen bonding Decrease C=O strenght lower frequency 1680 cm -1 — C — C — X O
76. Carbonyl compounds : Acids Carboxylic acid Exist as dimer : Strong Hydrogen bond OH : Very broad 3400 – 2400 cm -1 C=O : broad 1730 – 1700 cm -1 C — O : 1320 – 1210 cm -1 Medium intensity
77. Carbonyl compounds : Acids C=O OH C=O : 1711 cm -1 OH : Very Broad 3300 to 2500 cm -1 C-O : 1285, 1207 cm -1
78. Anhydrides C=O always has 2 bands: 1830-1800 and 1775-1740 cm -1 C —O multiple bands 1300 – 900 cm -1
79. Carbonyl compounds : Aldehydes Aldehydes C=O ~ 1725 cm -1 O=C-H : 2 weak bands 2750, 2850 cm -1 Conjugation => lower freq. C=O : 1724 cm -1
82. Other carbonyl Amides Lactams Acid Chlorides C=O ~1680-1630 cm -1 (band I) NH 2 ~ 3350 and 3180 cm -1 (stretch) NH ~ 3300 cm -1 (stretch) NH ~ 1640-1550 cm -1 (bending) 1810-1775 cm -1 C — Cl 730 – 550 cm -1 ~1660 ~1705 ~1745 Increase with strain R — C — Cl O
83. Amides NH 2 : Symmetrical stretch =>3170 cm -1 asymmetrical stretch => 3352 cm -1 C=O : 1640 cm -1 NH Out of plane
91. Other Nitrogen Compounds Nitriles Isocyanates Isothiocyanates Imines / Oximes R-C N : Sharp 2250 cm -1 Conjugation moves to lower frequency R-N=C=O Broad ~ 2270 cm -1 R-N=C=S 2 Broad peaks ~ 2125 cm -1 R 2 C=N-R 1690 - 1640 cm -1
95. Nitro Aliphatic : Asymmetric : 1600-1530 cm -1 Symmetric : 1390-1300 cm -1 Aromatic : Asymmetric : 1550-1490 cm -1 Symmetric : 1355-1315 cm -1 — N O O + -
98. Sulfur Mercaptans S – H : weak 2600-2550 cm -1 Since only few absorption in that range it confirm its presence Sulfides,Disulfides : no useful information Sulfoxides: Strong ~ 1050 cm -1 Sulfones : Asymetrical ~ 1300 cm -1 Symetrical ~ 1150 cm -1 2 bands :
101. Sulfur: Sulfonate S=O : Asymmetrical stretch: 1350 cm-1 Symmetrical Stretch : 1175 cm-1 S-O : several bands between 1000 – 750 cm -1
102. Sulfur: Sulfonamide S=O : Asymmetrical stretch: 1325 cm-1 Symmetrical Stretch : 1140 cm-1 NH 2 stretch: 3350 and 3250 cm -1 NH Bend: 1550 cm -1
103. Halogens C —F : 1400 – 1000 cm -1 C —Cl : strong 785 – 540 cm -1 C —Br : 650 – 510 cm -1 (out of range with NaCl plates) C —I : 600 – 485 cm -1 (out of range)
105. Phosphorus Phosphines: R-PH 2 R 2 PH P —H : Sharp 2320 – 2270 cm -1 P H 2 bending : 1090 – 1075 and 840 - 810 cm -1 P H bending : 990 - 886 cm -1 Phosphine Oxide : R 3 P=O P =O very strong : 1210 - 1140 cm -1 Phosphate Esters : (OR) 3 P=O P =O very strong : 1300 - 1240 cm -1 P -O very strong : 1088 – 920 cm -1 P -O : 845 - 725 cm -1
106. Silicon IR-Organometallic Index Si-H : 2200 cm -1 (Stretch) 950 – 800 cm -1 (bend) Si-O-H : OH: 3700 – 3200 cm -1 (Stretch) Si-O : 830 – 1110 cm -1