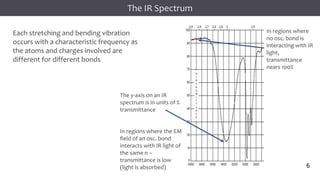
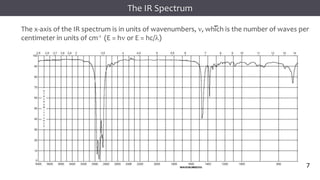
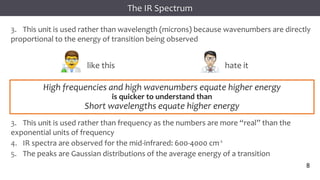
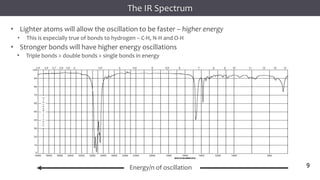
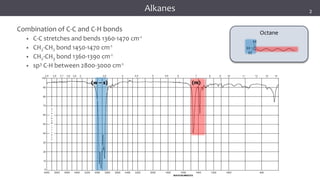
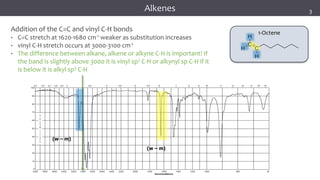
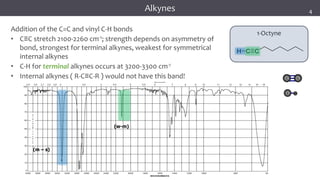
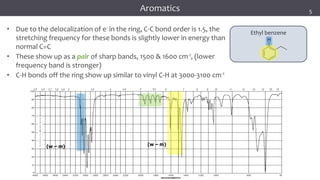
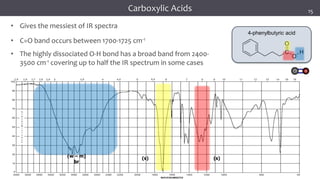
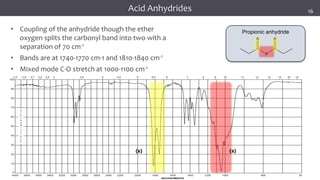
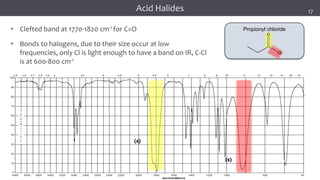
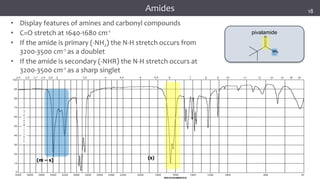
The document discusses infrared (IR) spectroscopy, detailing the quantum mechanical principles behind molecular vibrations and their electromagnetic interactions. It outlines the characteristics of diatomic molecular vibrations, the significance of bond stretching and bending, and explains how IR spectra can be used to identify functional groups in compounds. Additionally, it covers different bond types, their behavior in IR spectroscopy, and the effects of electronegativity and conjugation on spectral properties.

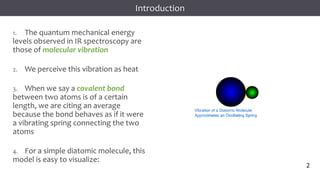


![谷歌留痕技术 [ 𝙩𝙤𝙥 𝟮𝟯𝟯. 𝙘 𝙤𝙢 ]](https://cdn.slidesharecdn.com/ss_thumbnails/top233-260130174328-3833018c-thumbnail.jpg?width=640&height=640&fit=bounds)


