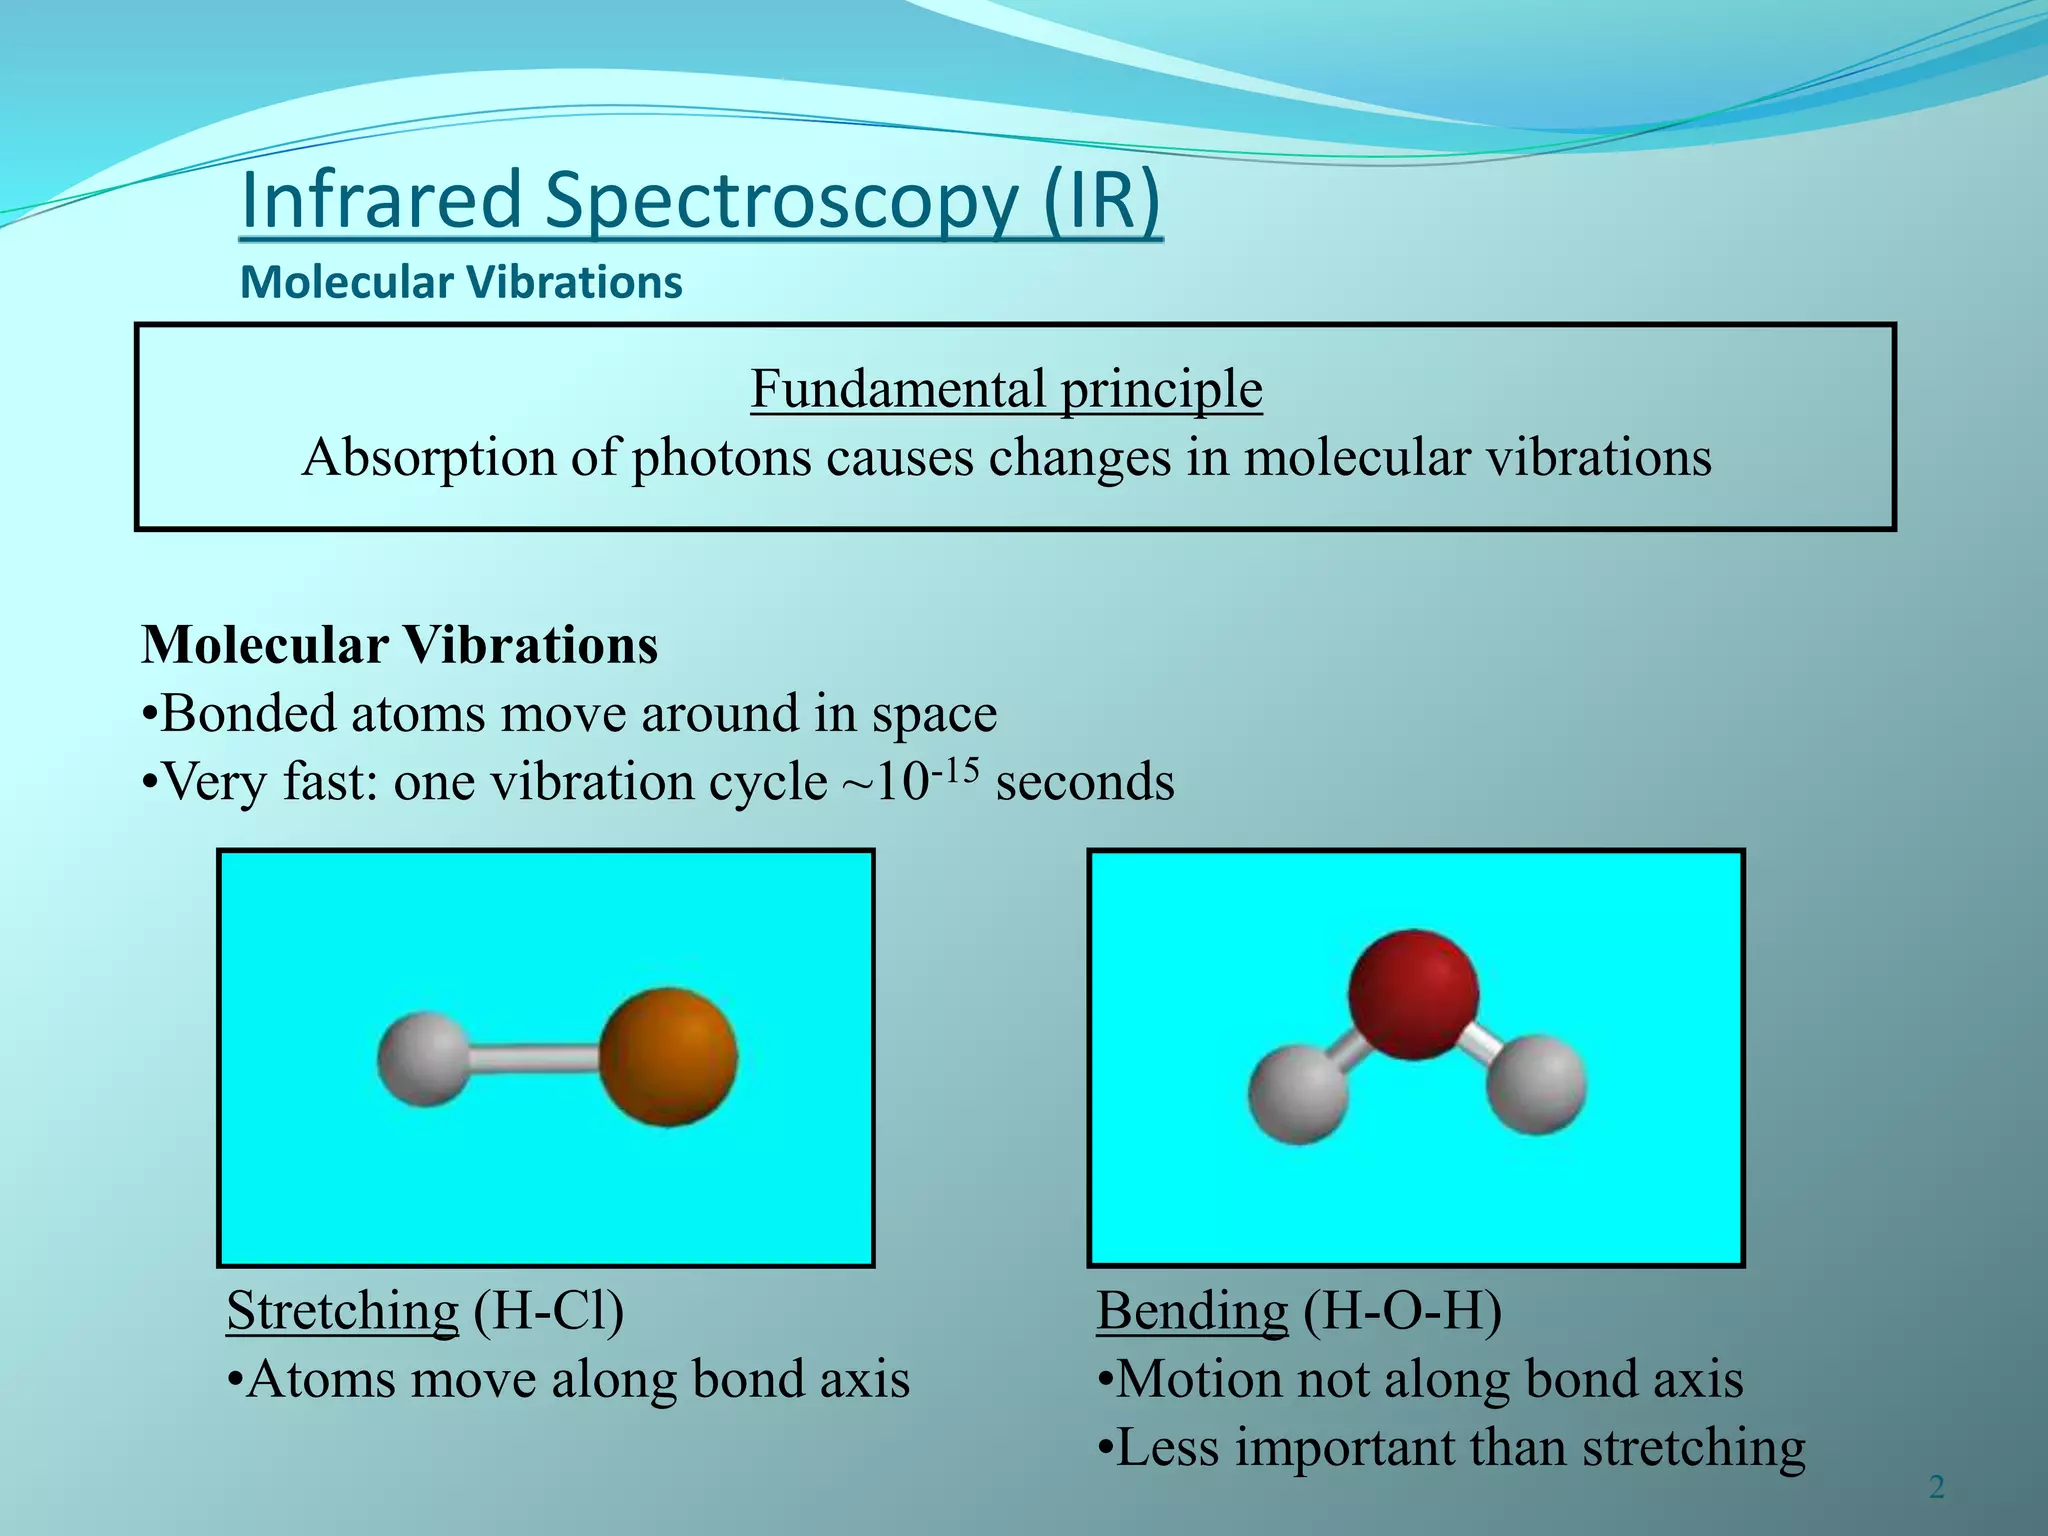
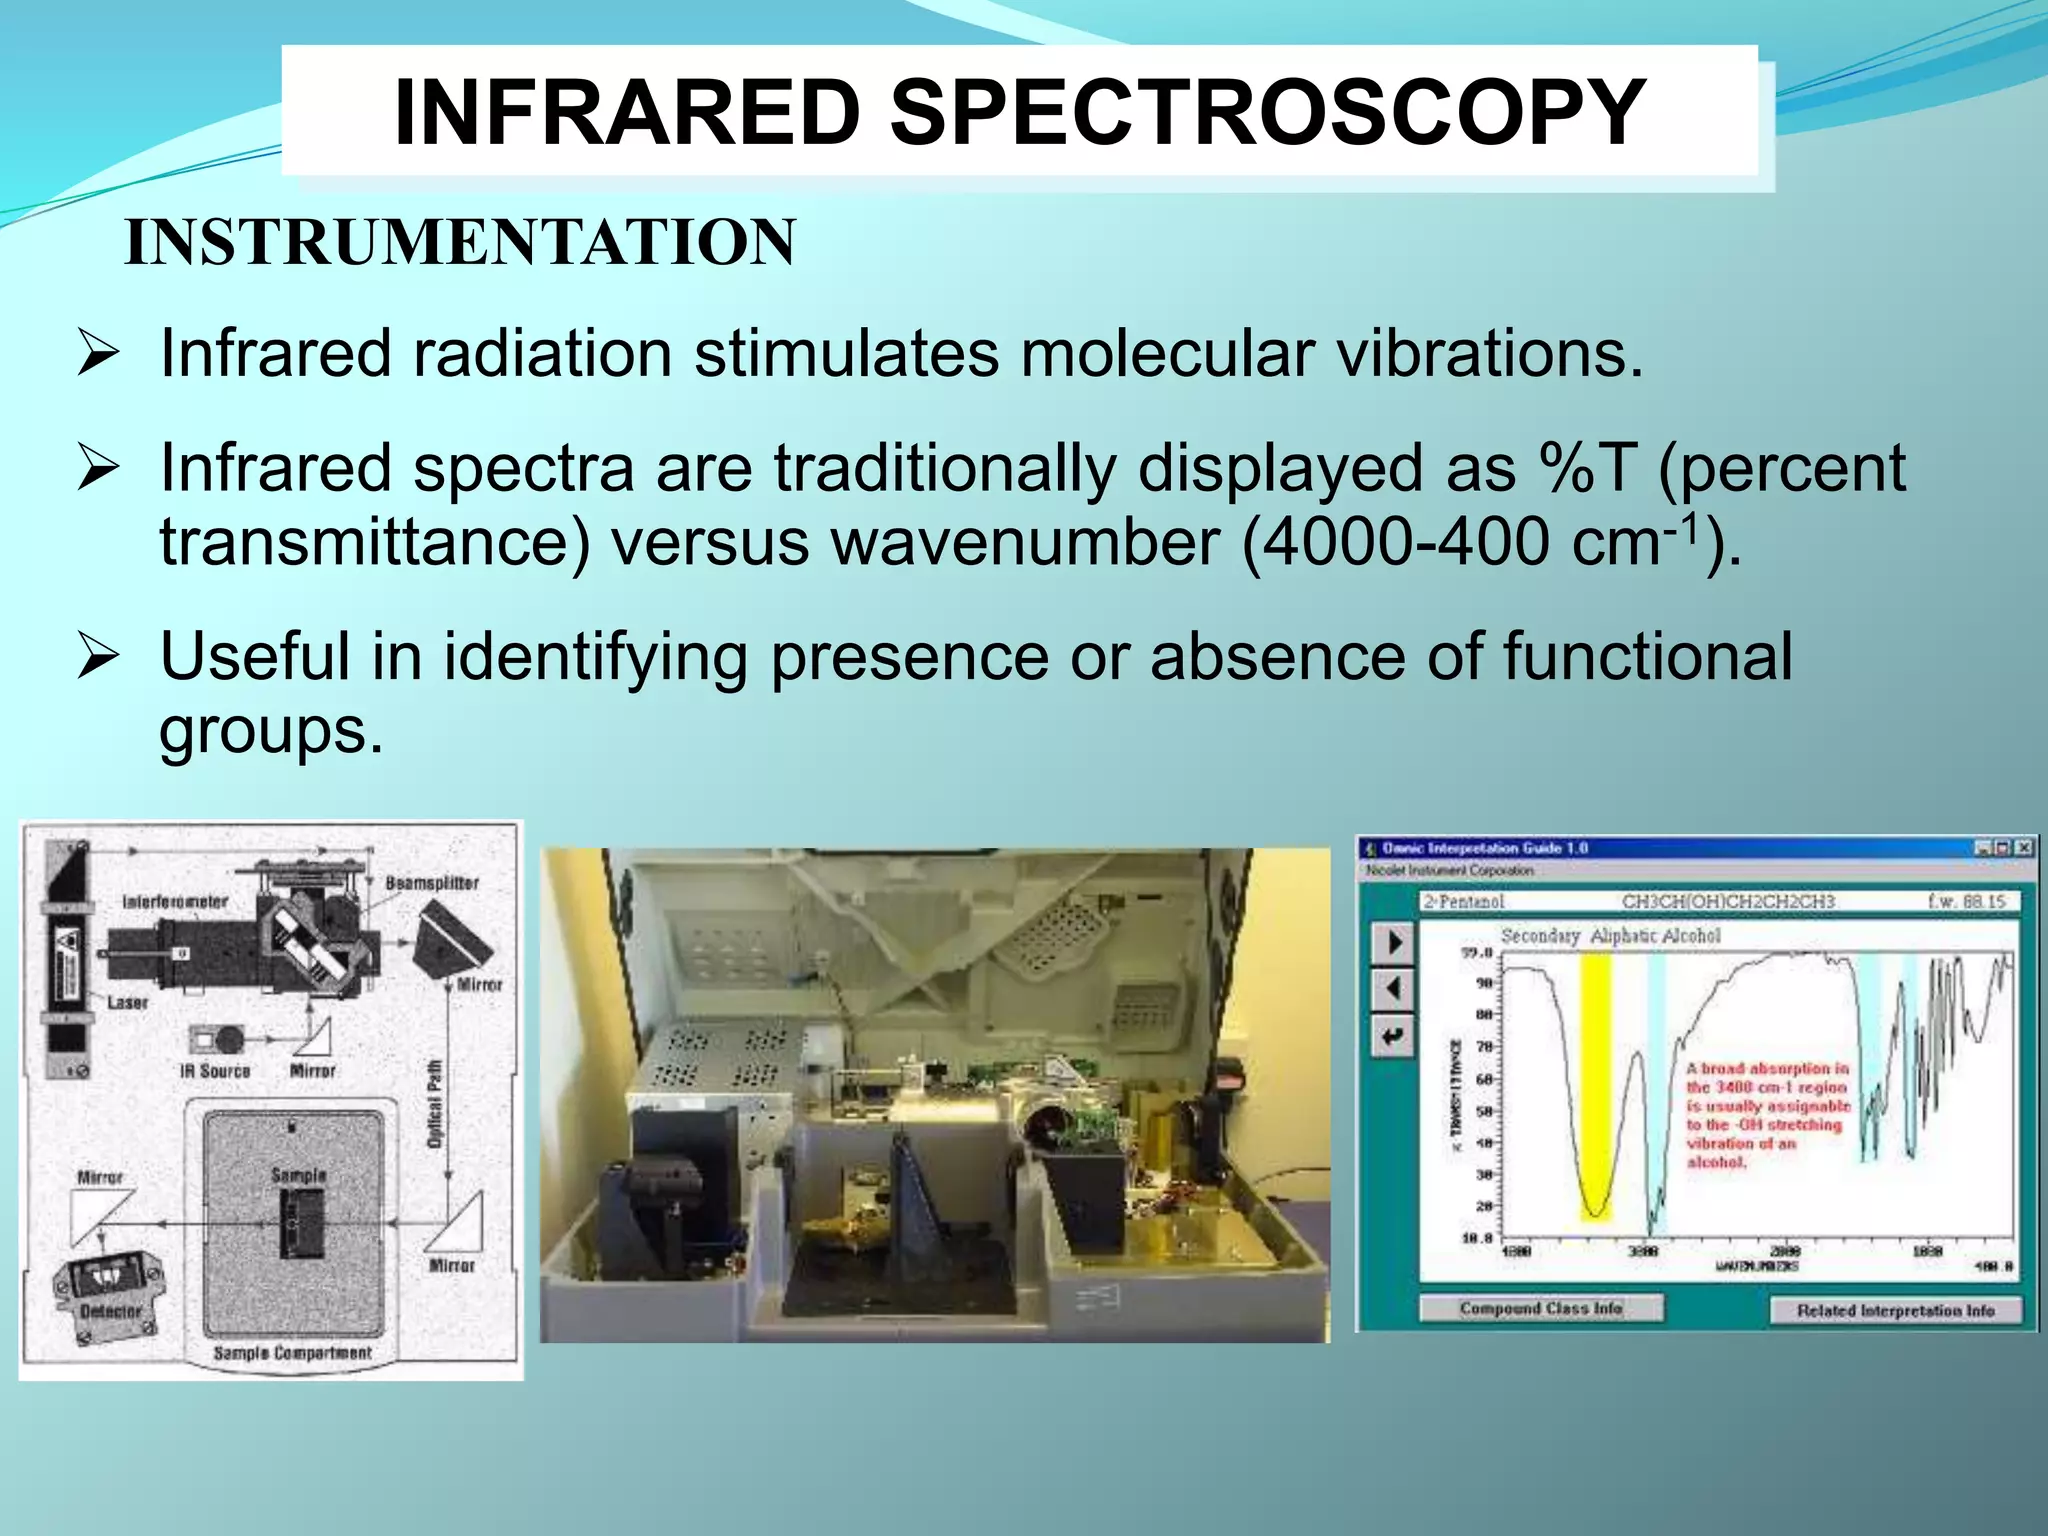
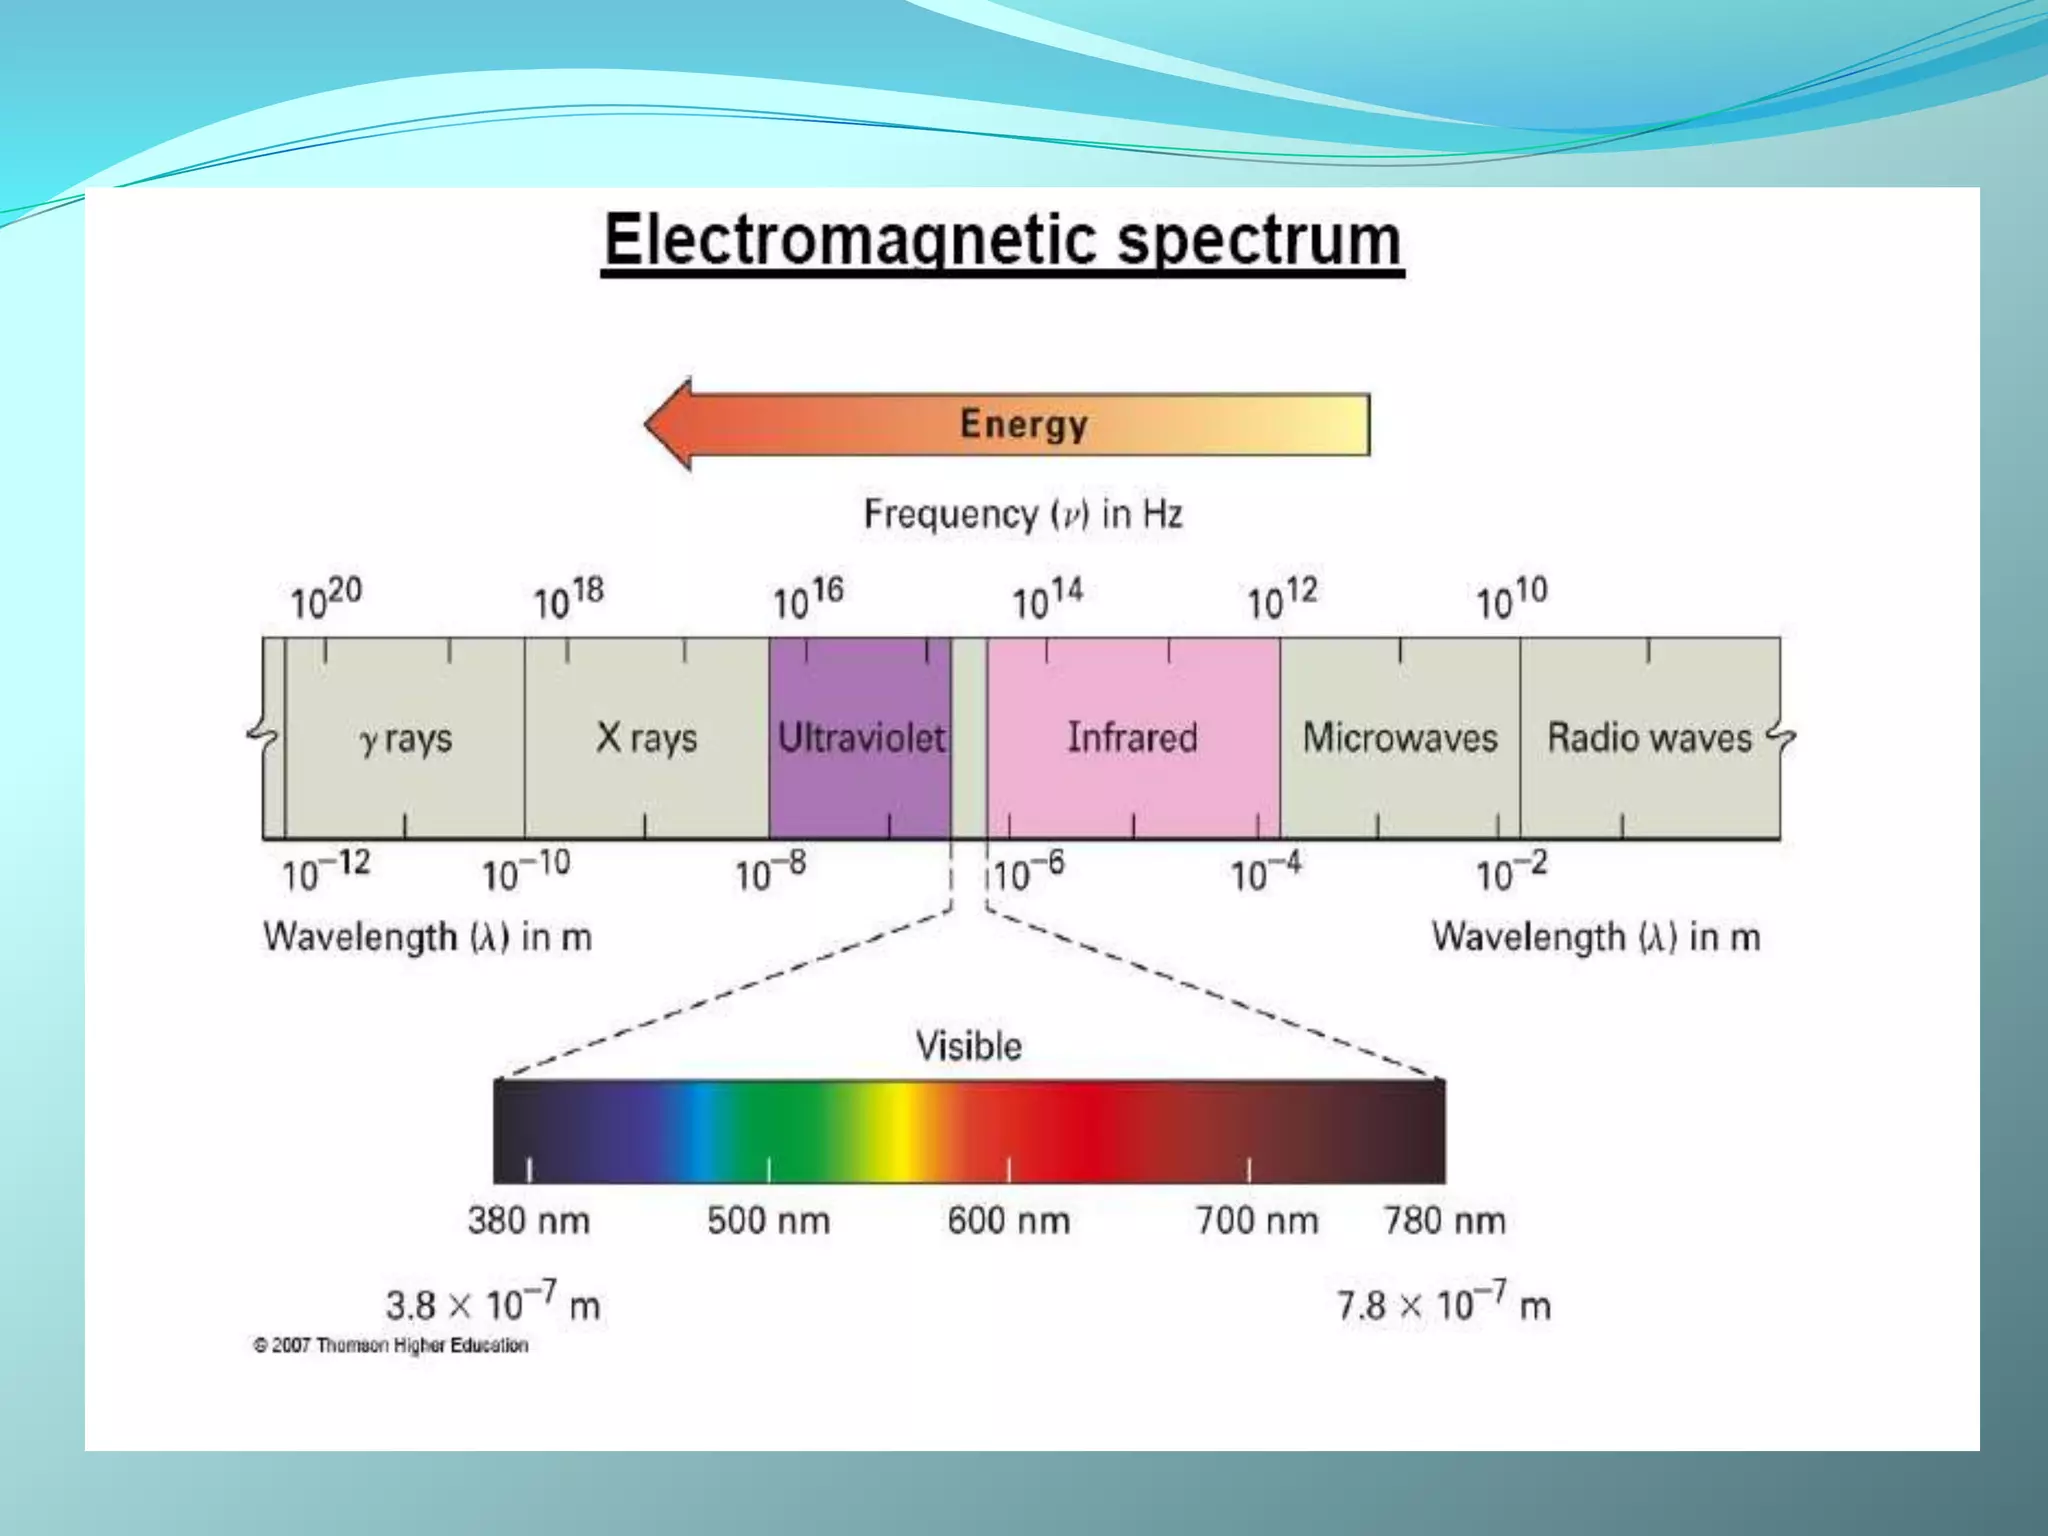
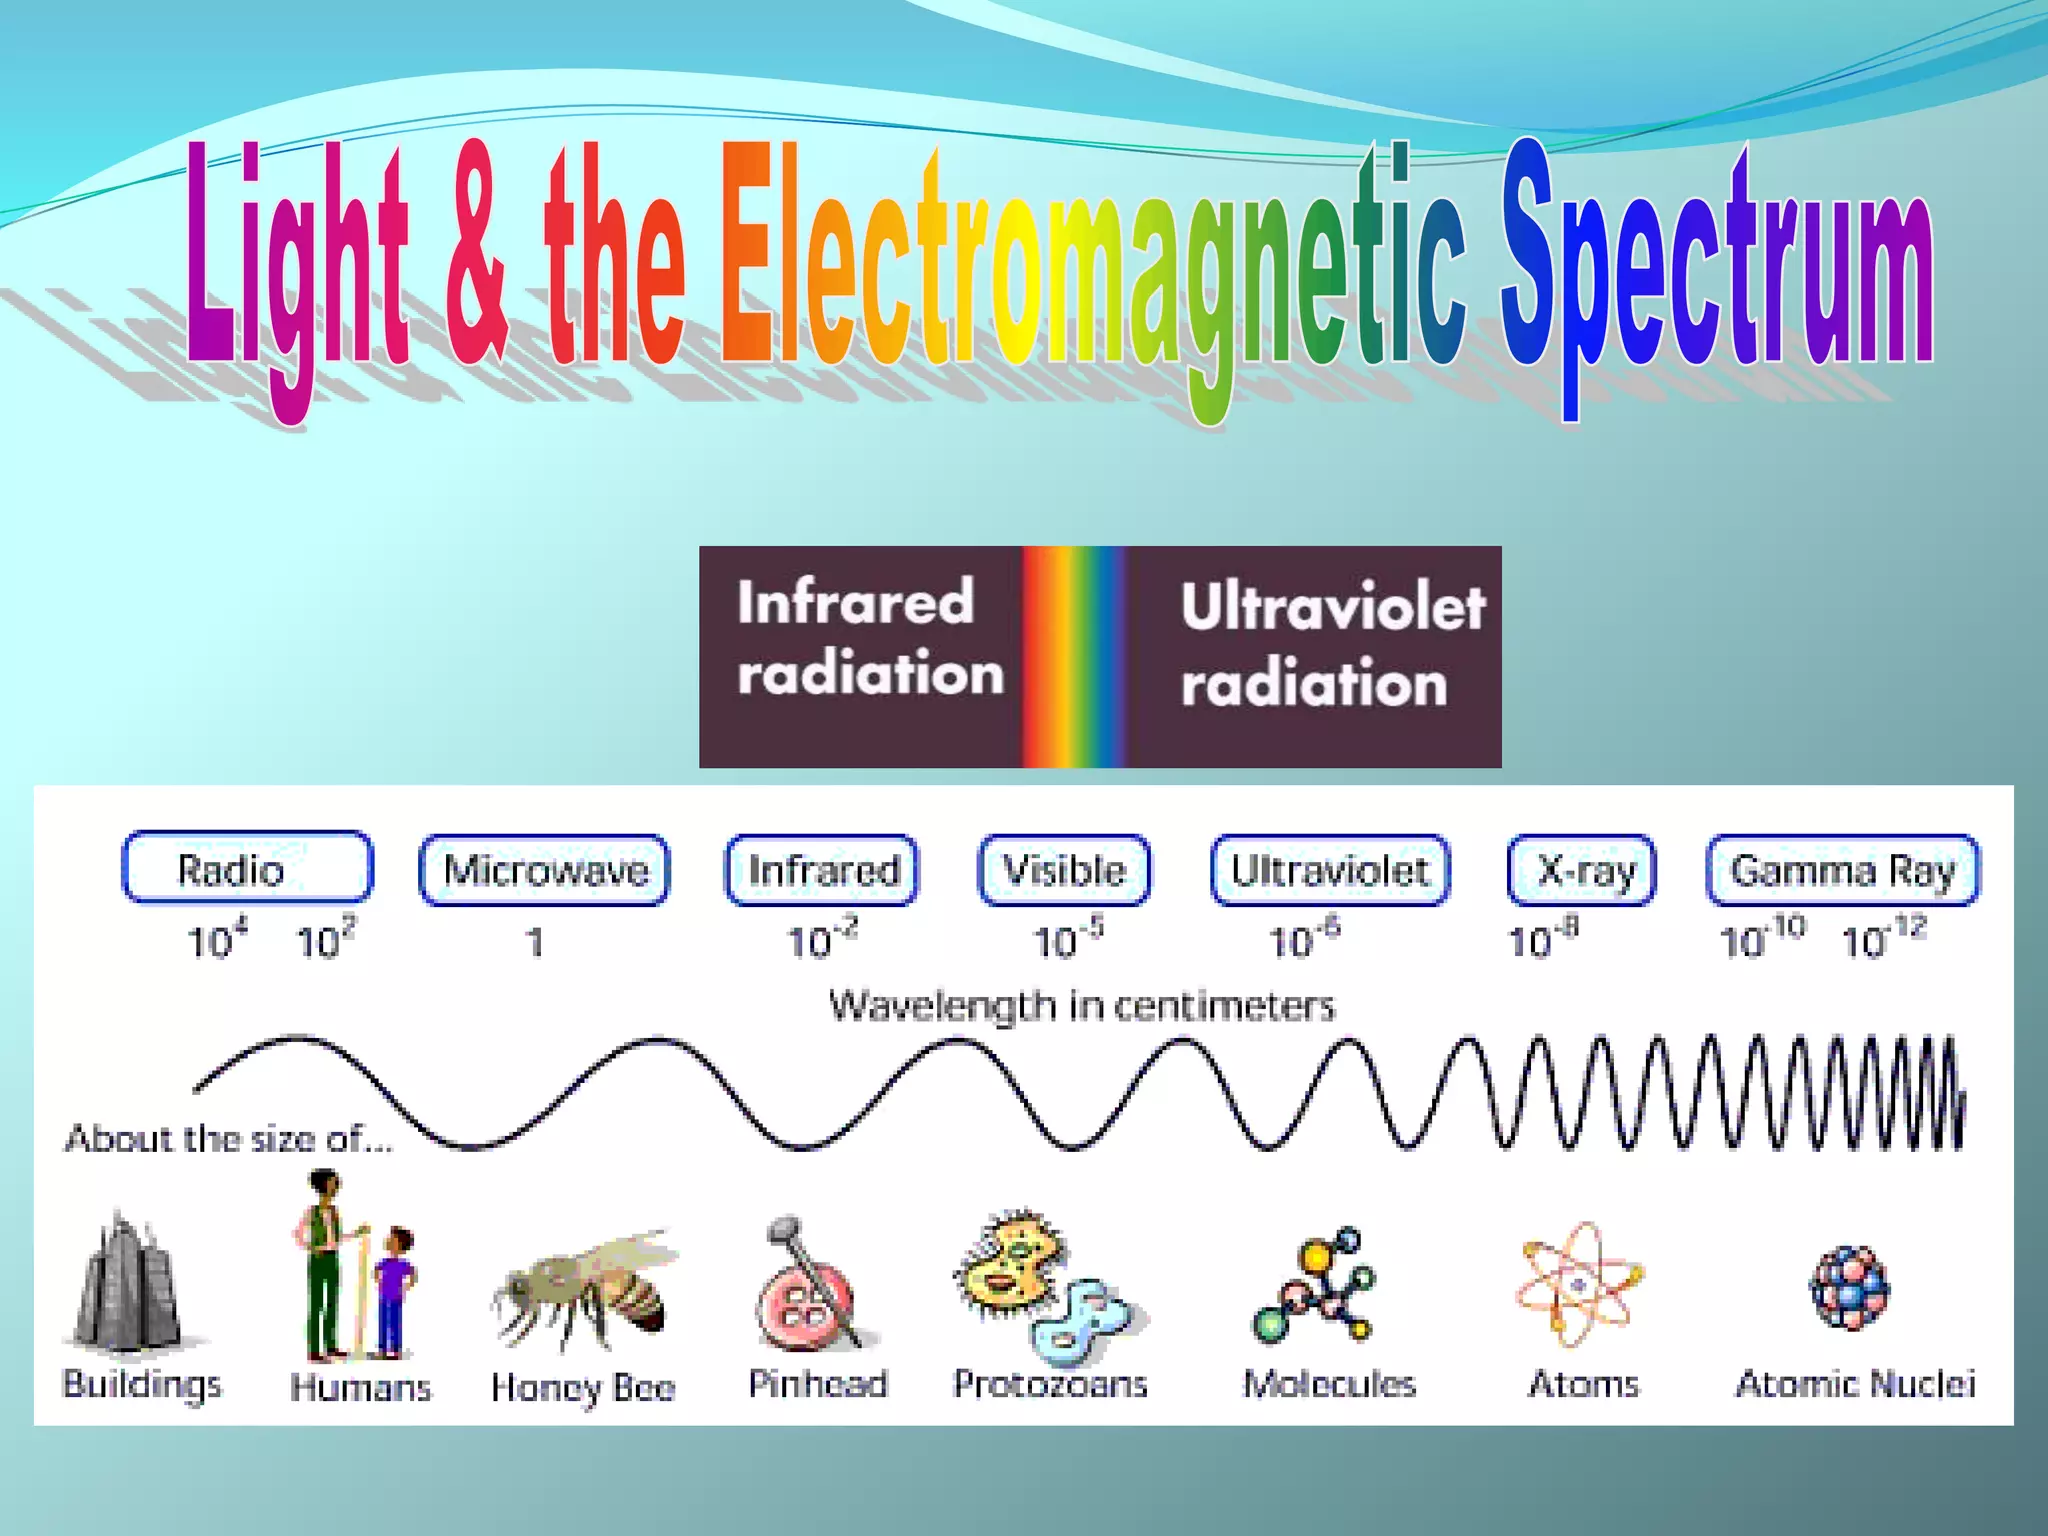
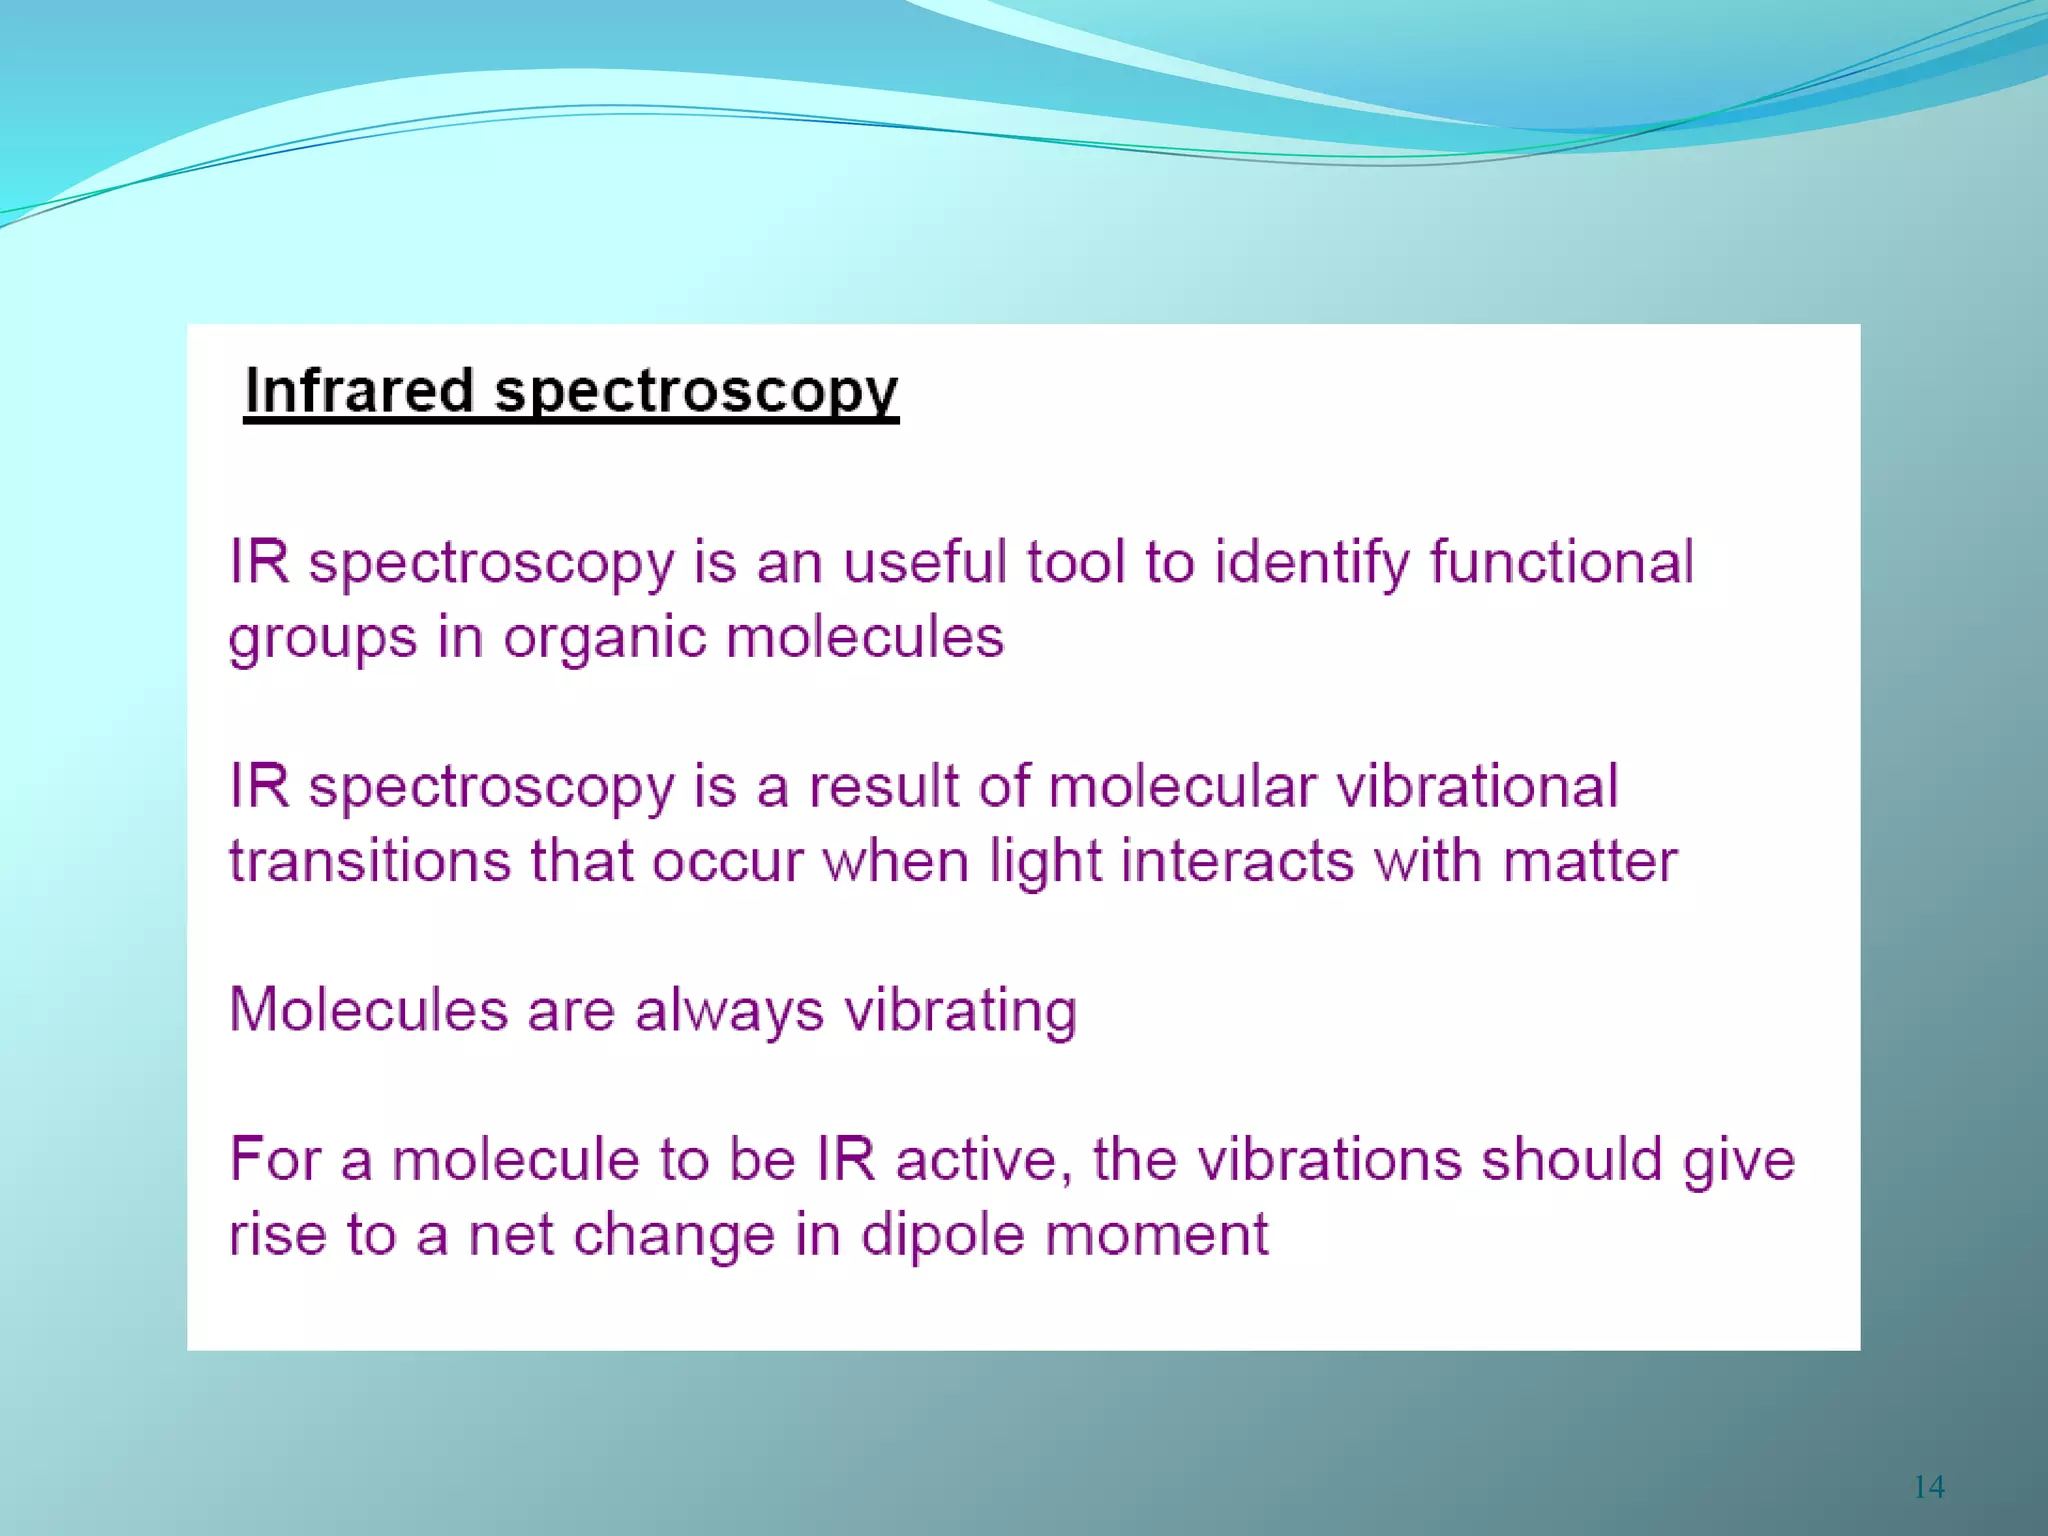
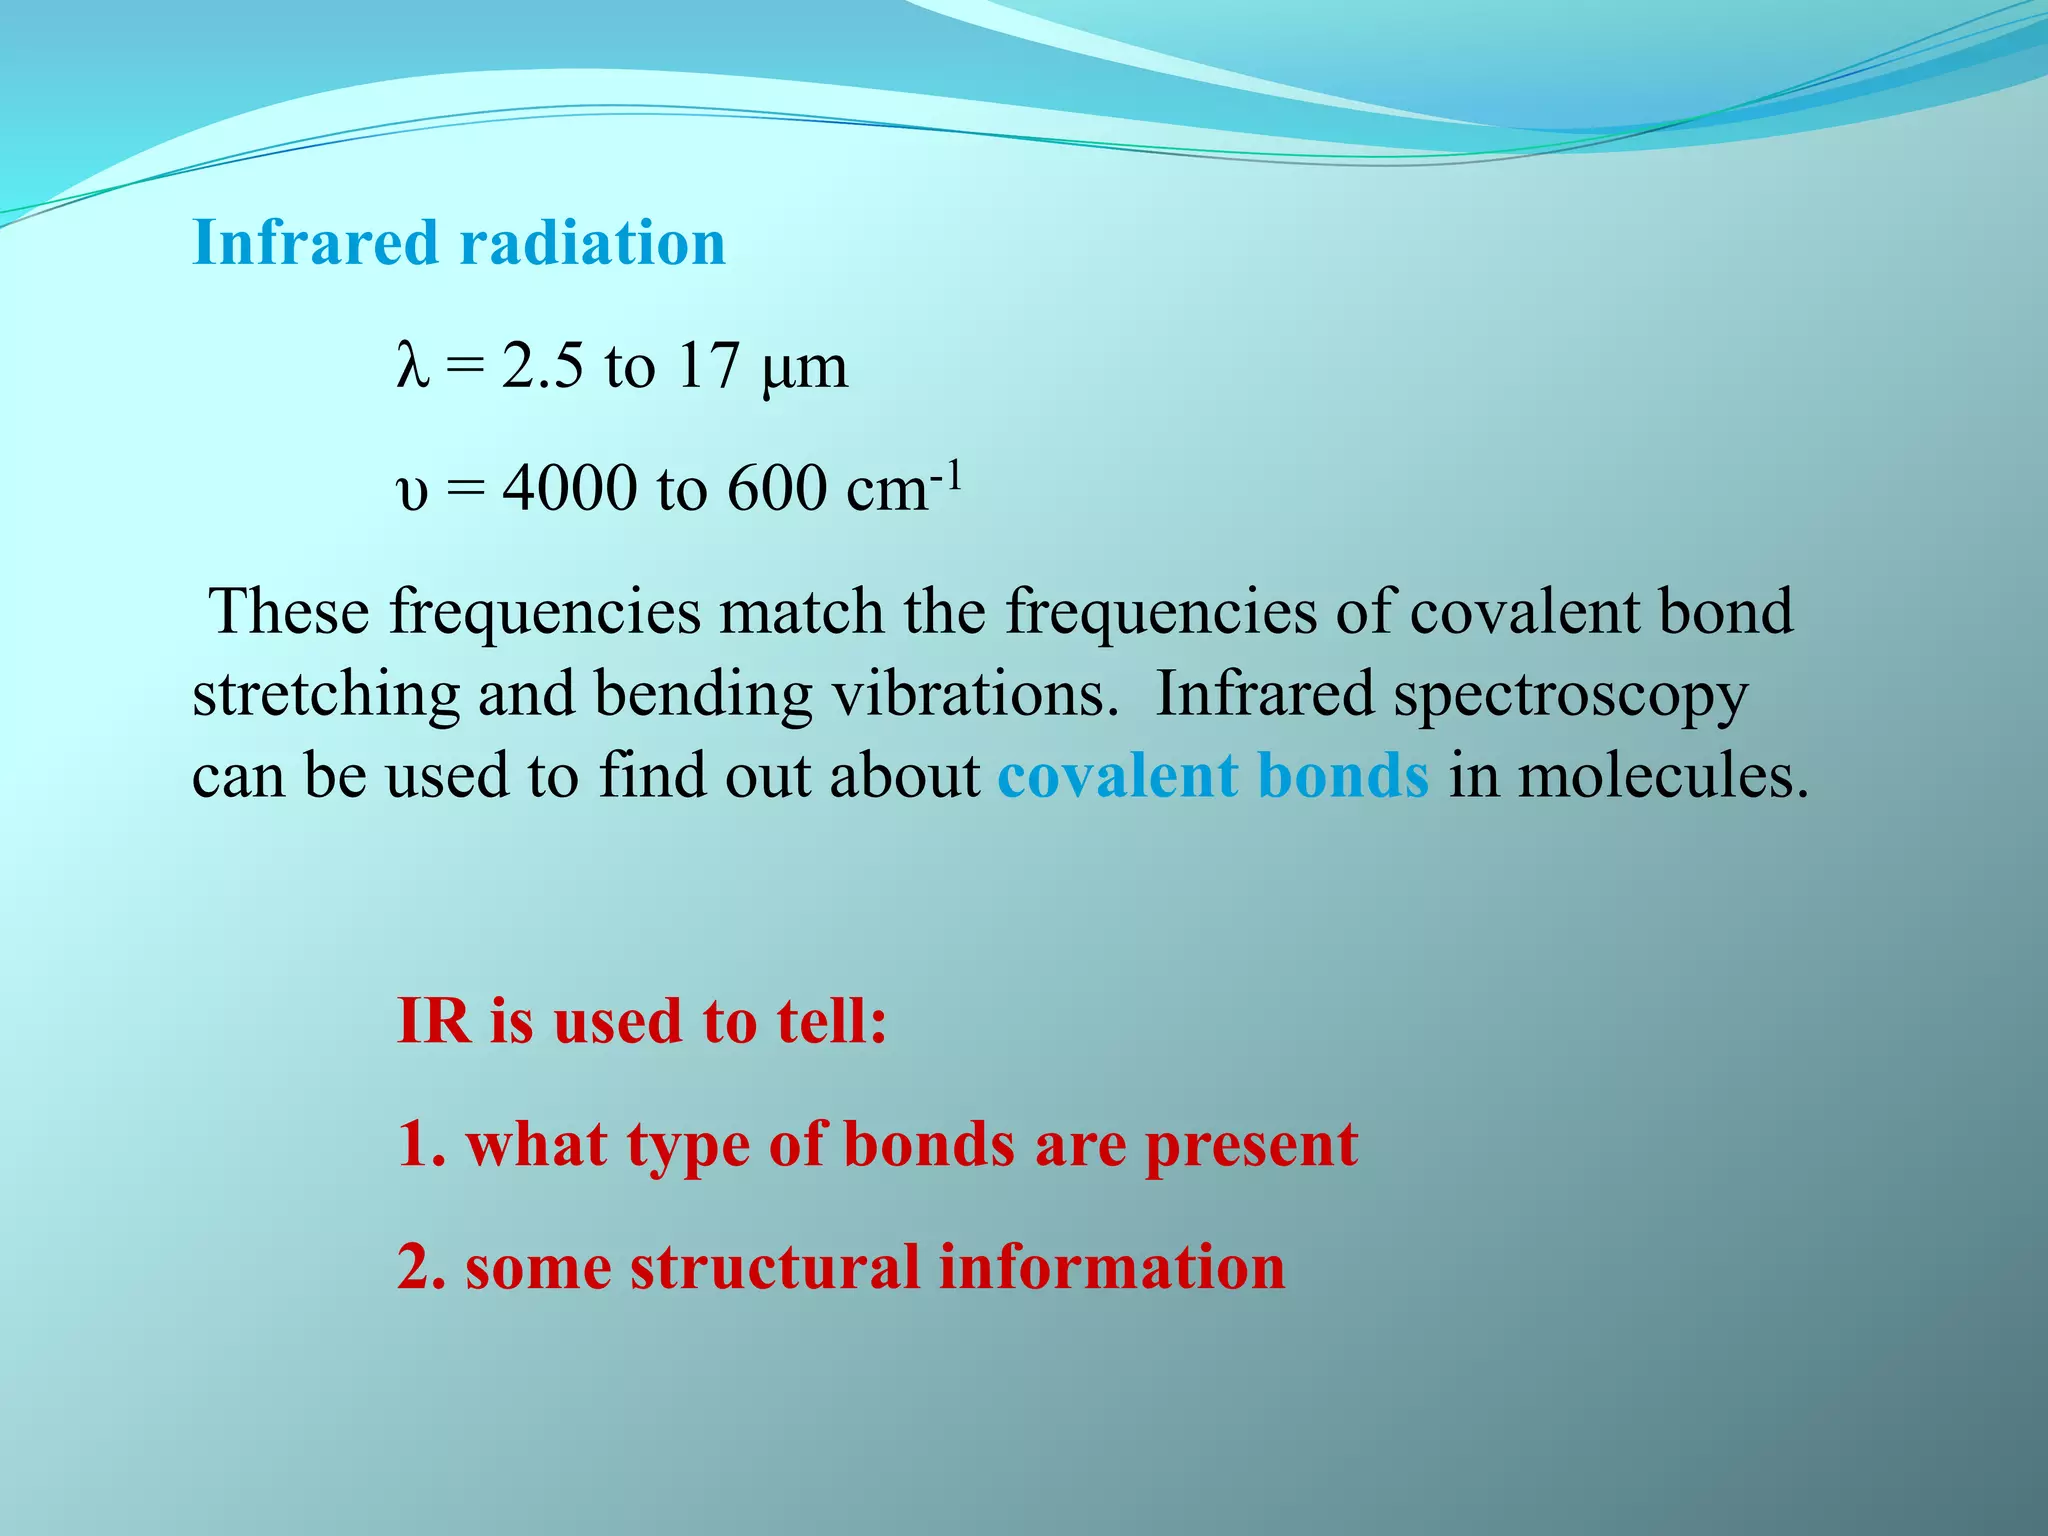
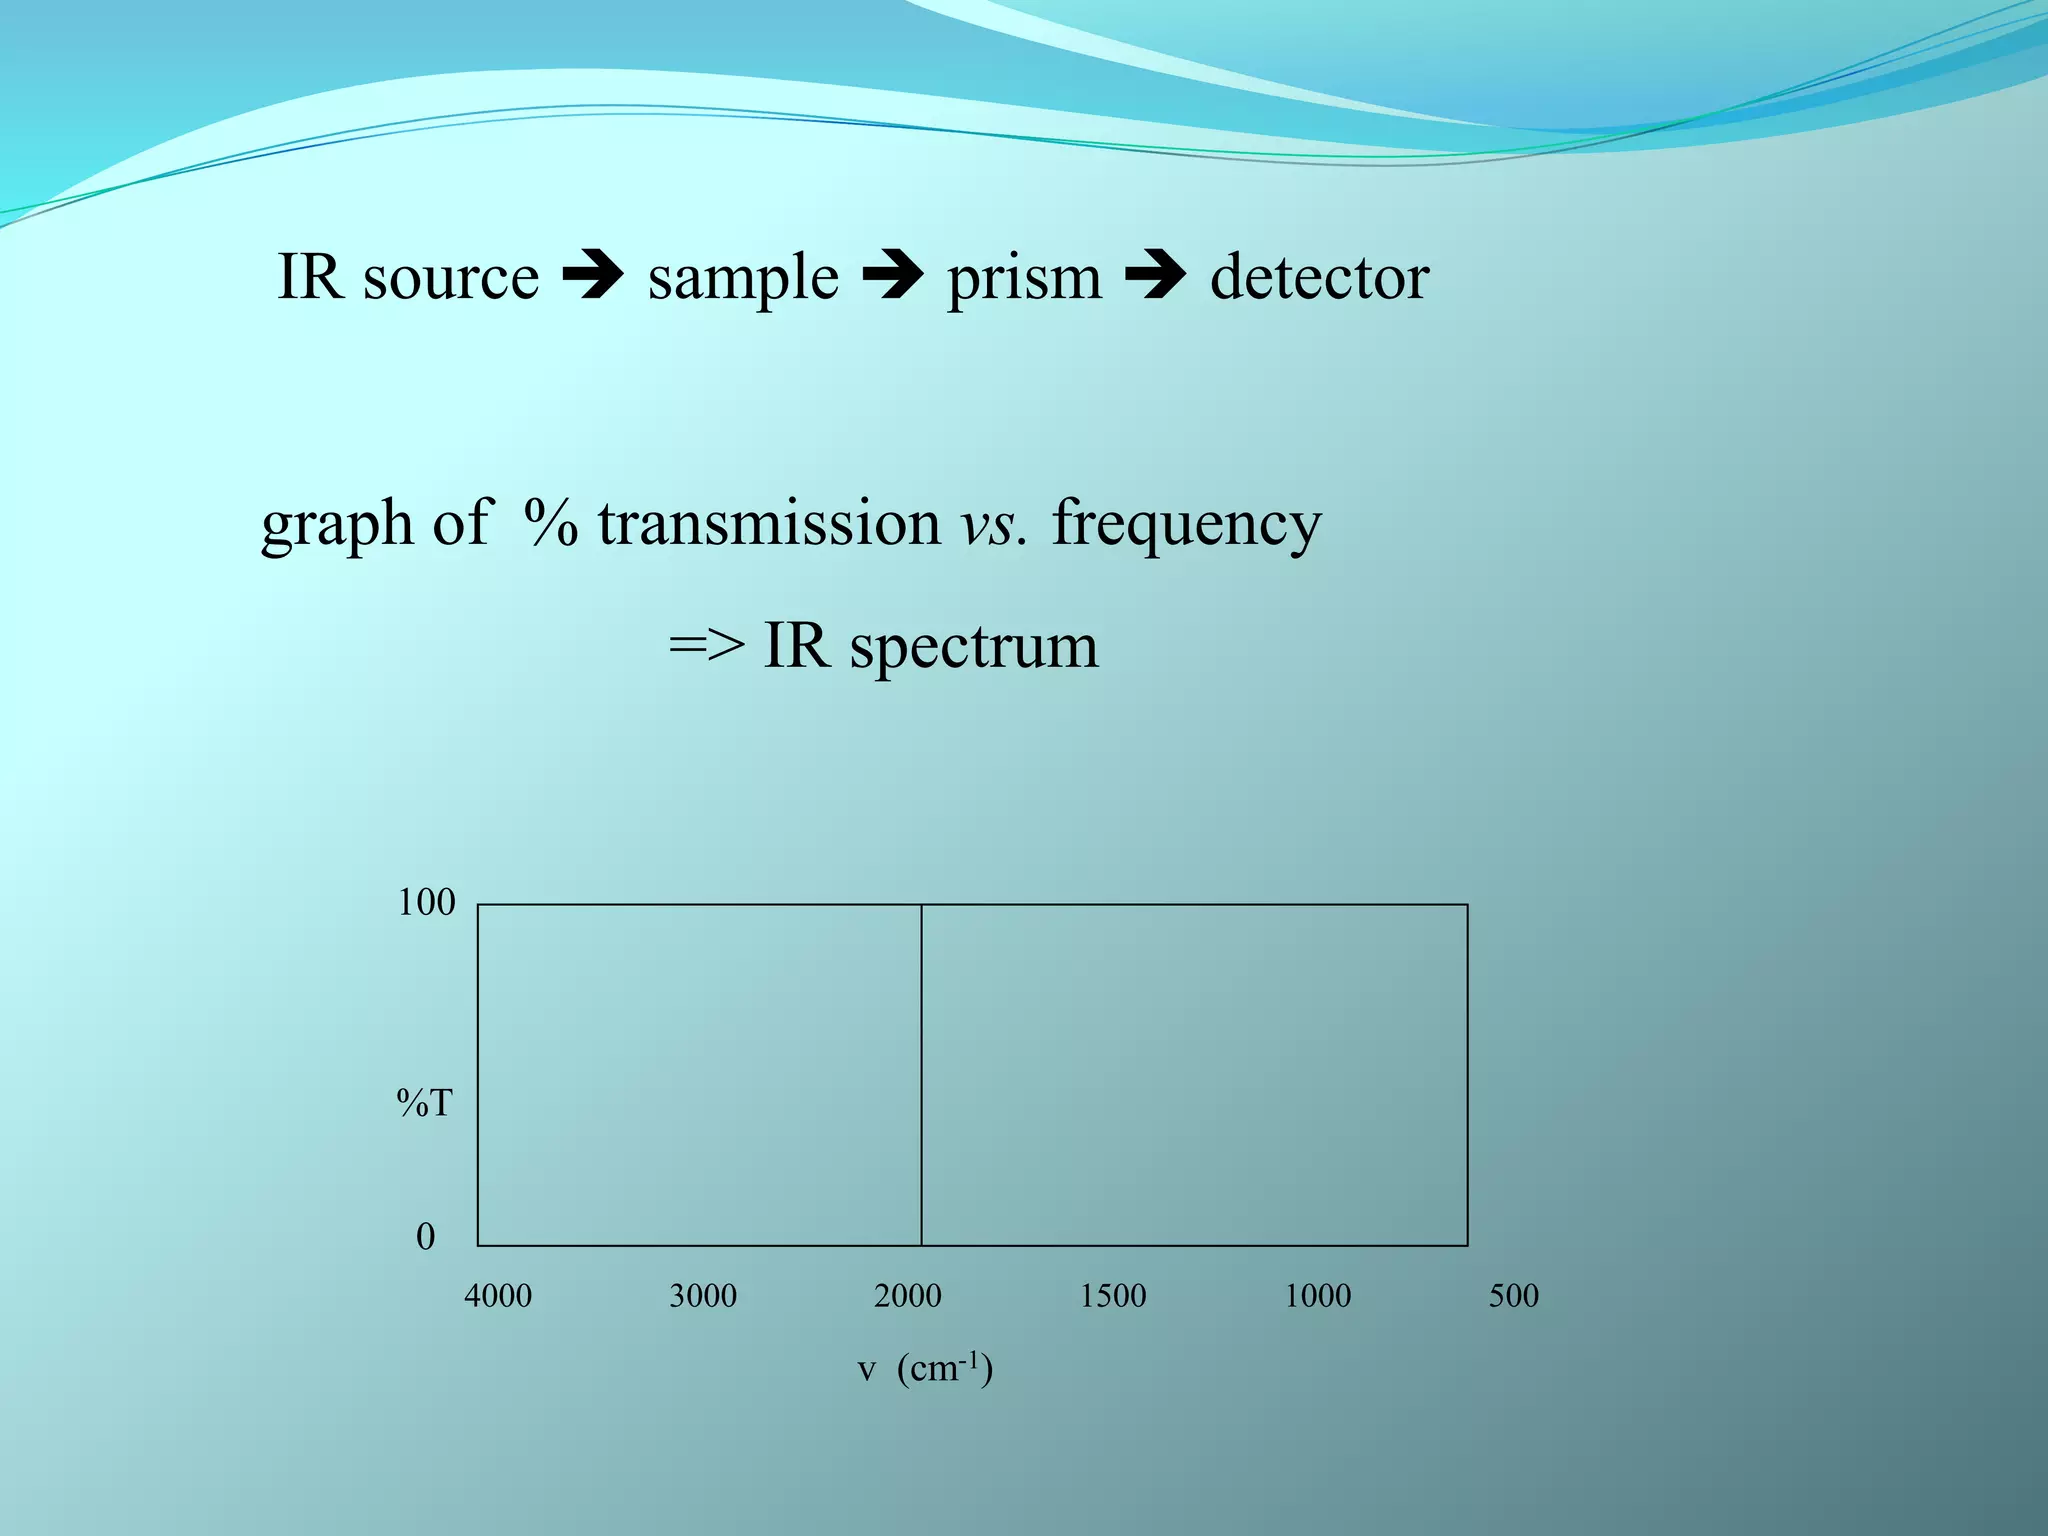
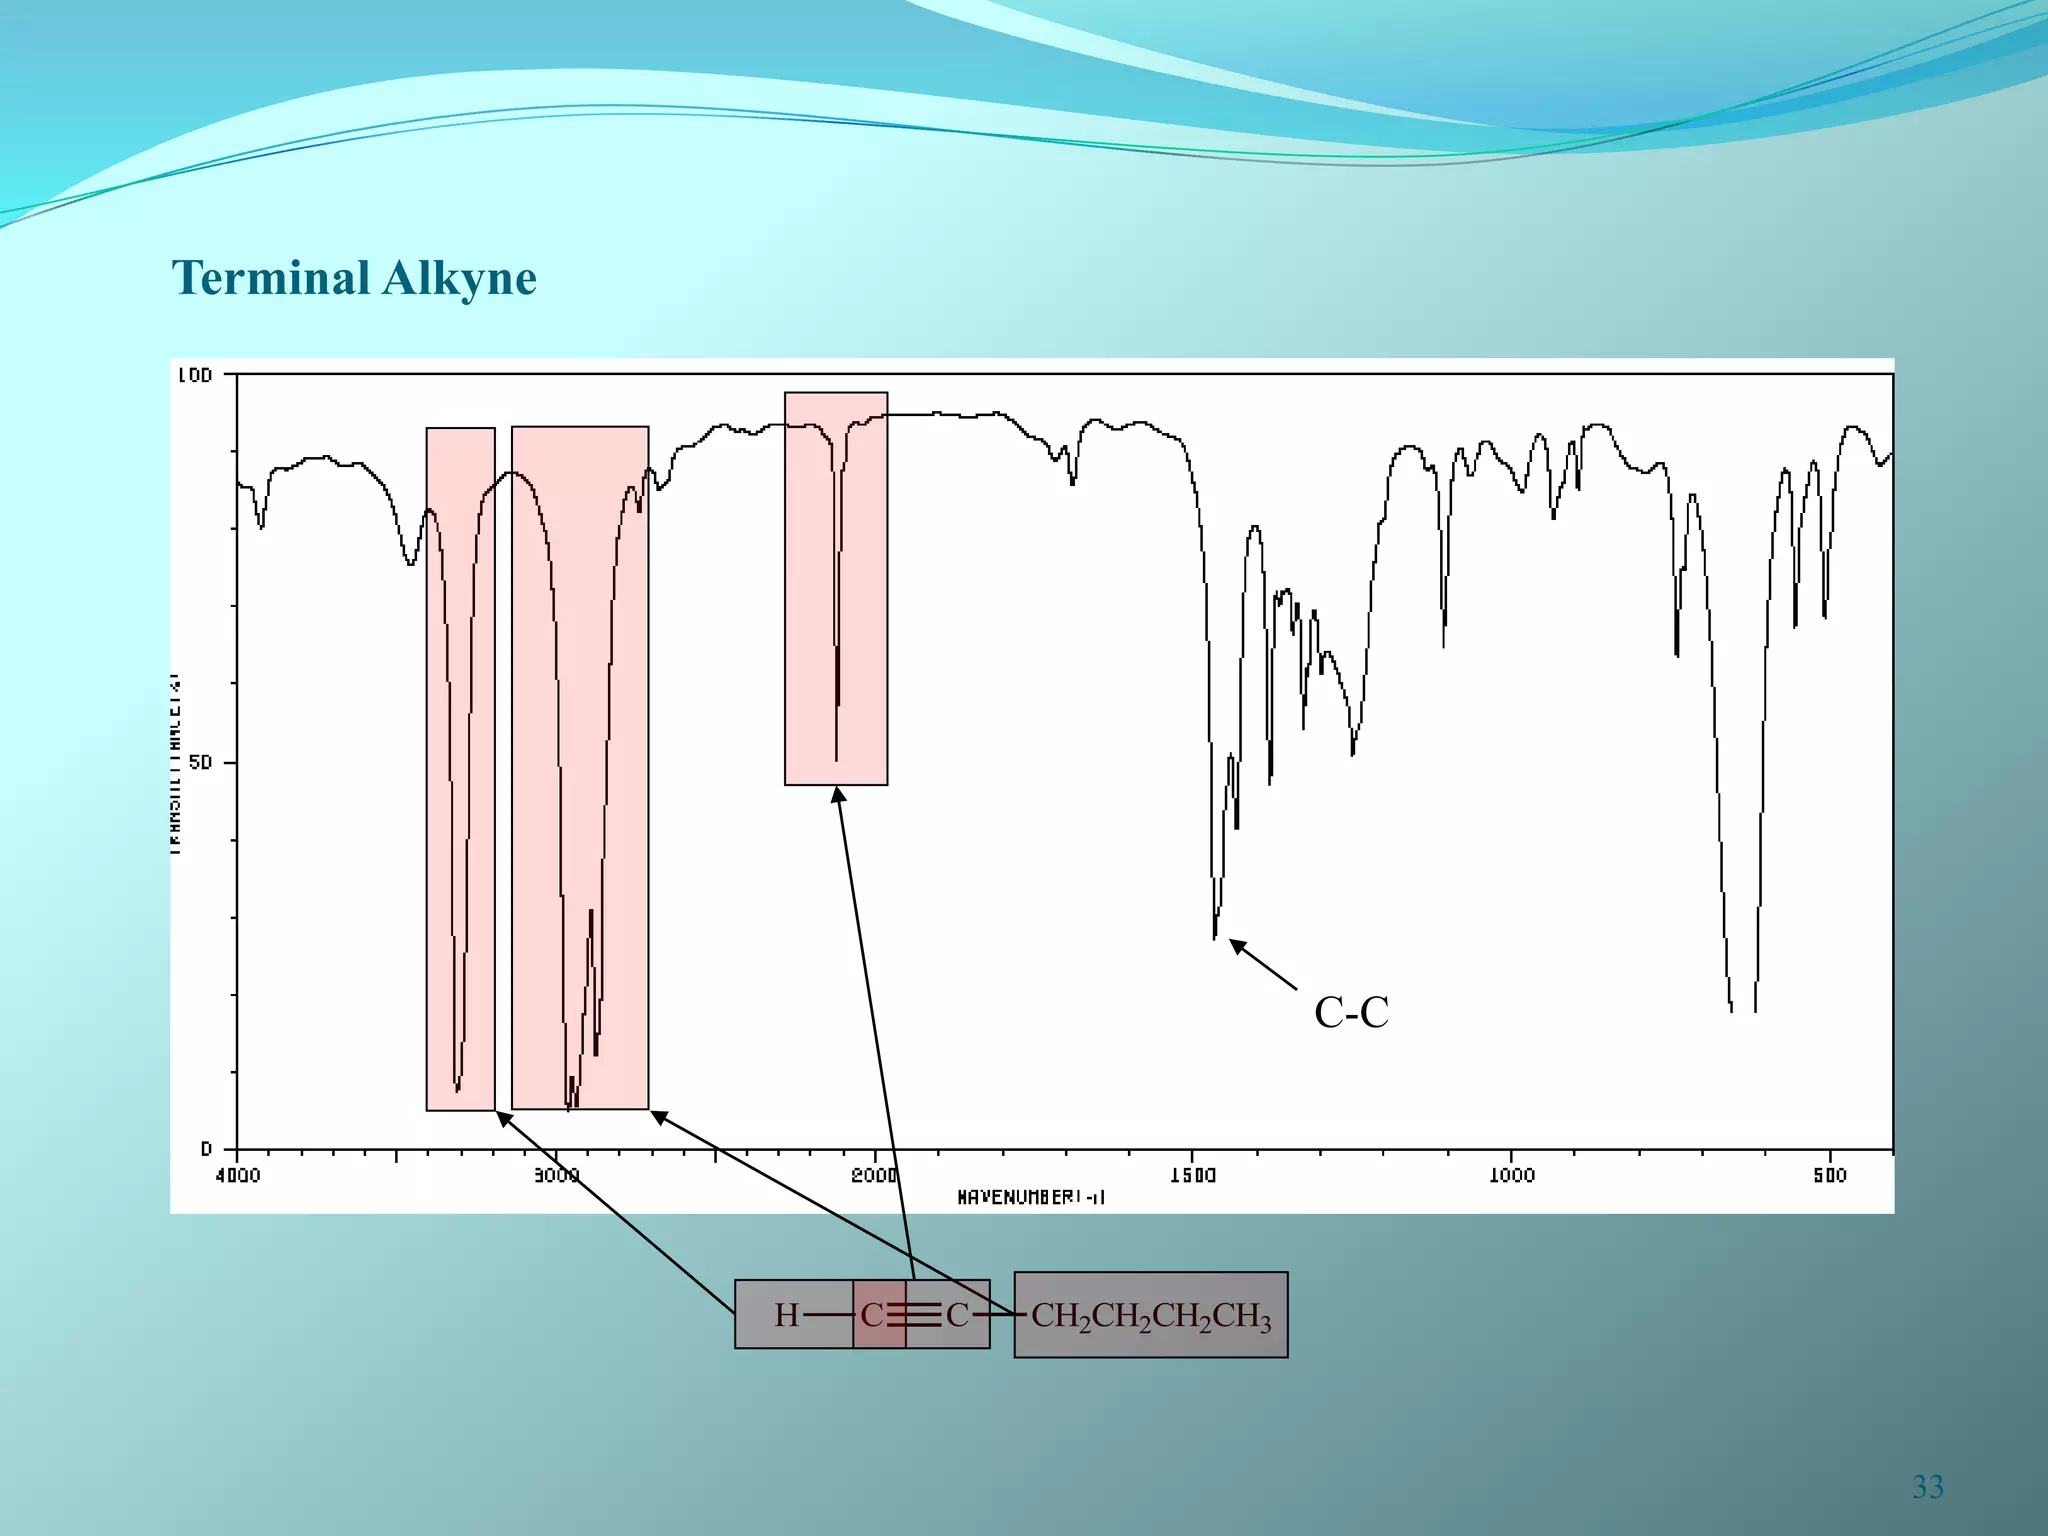
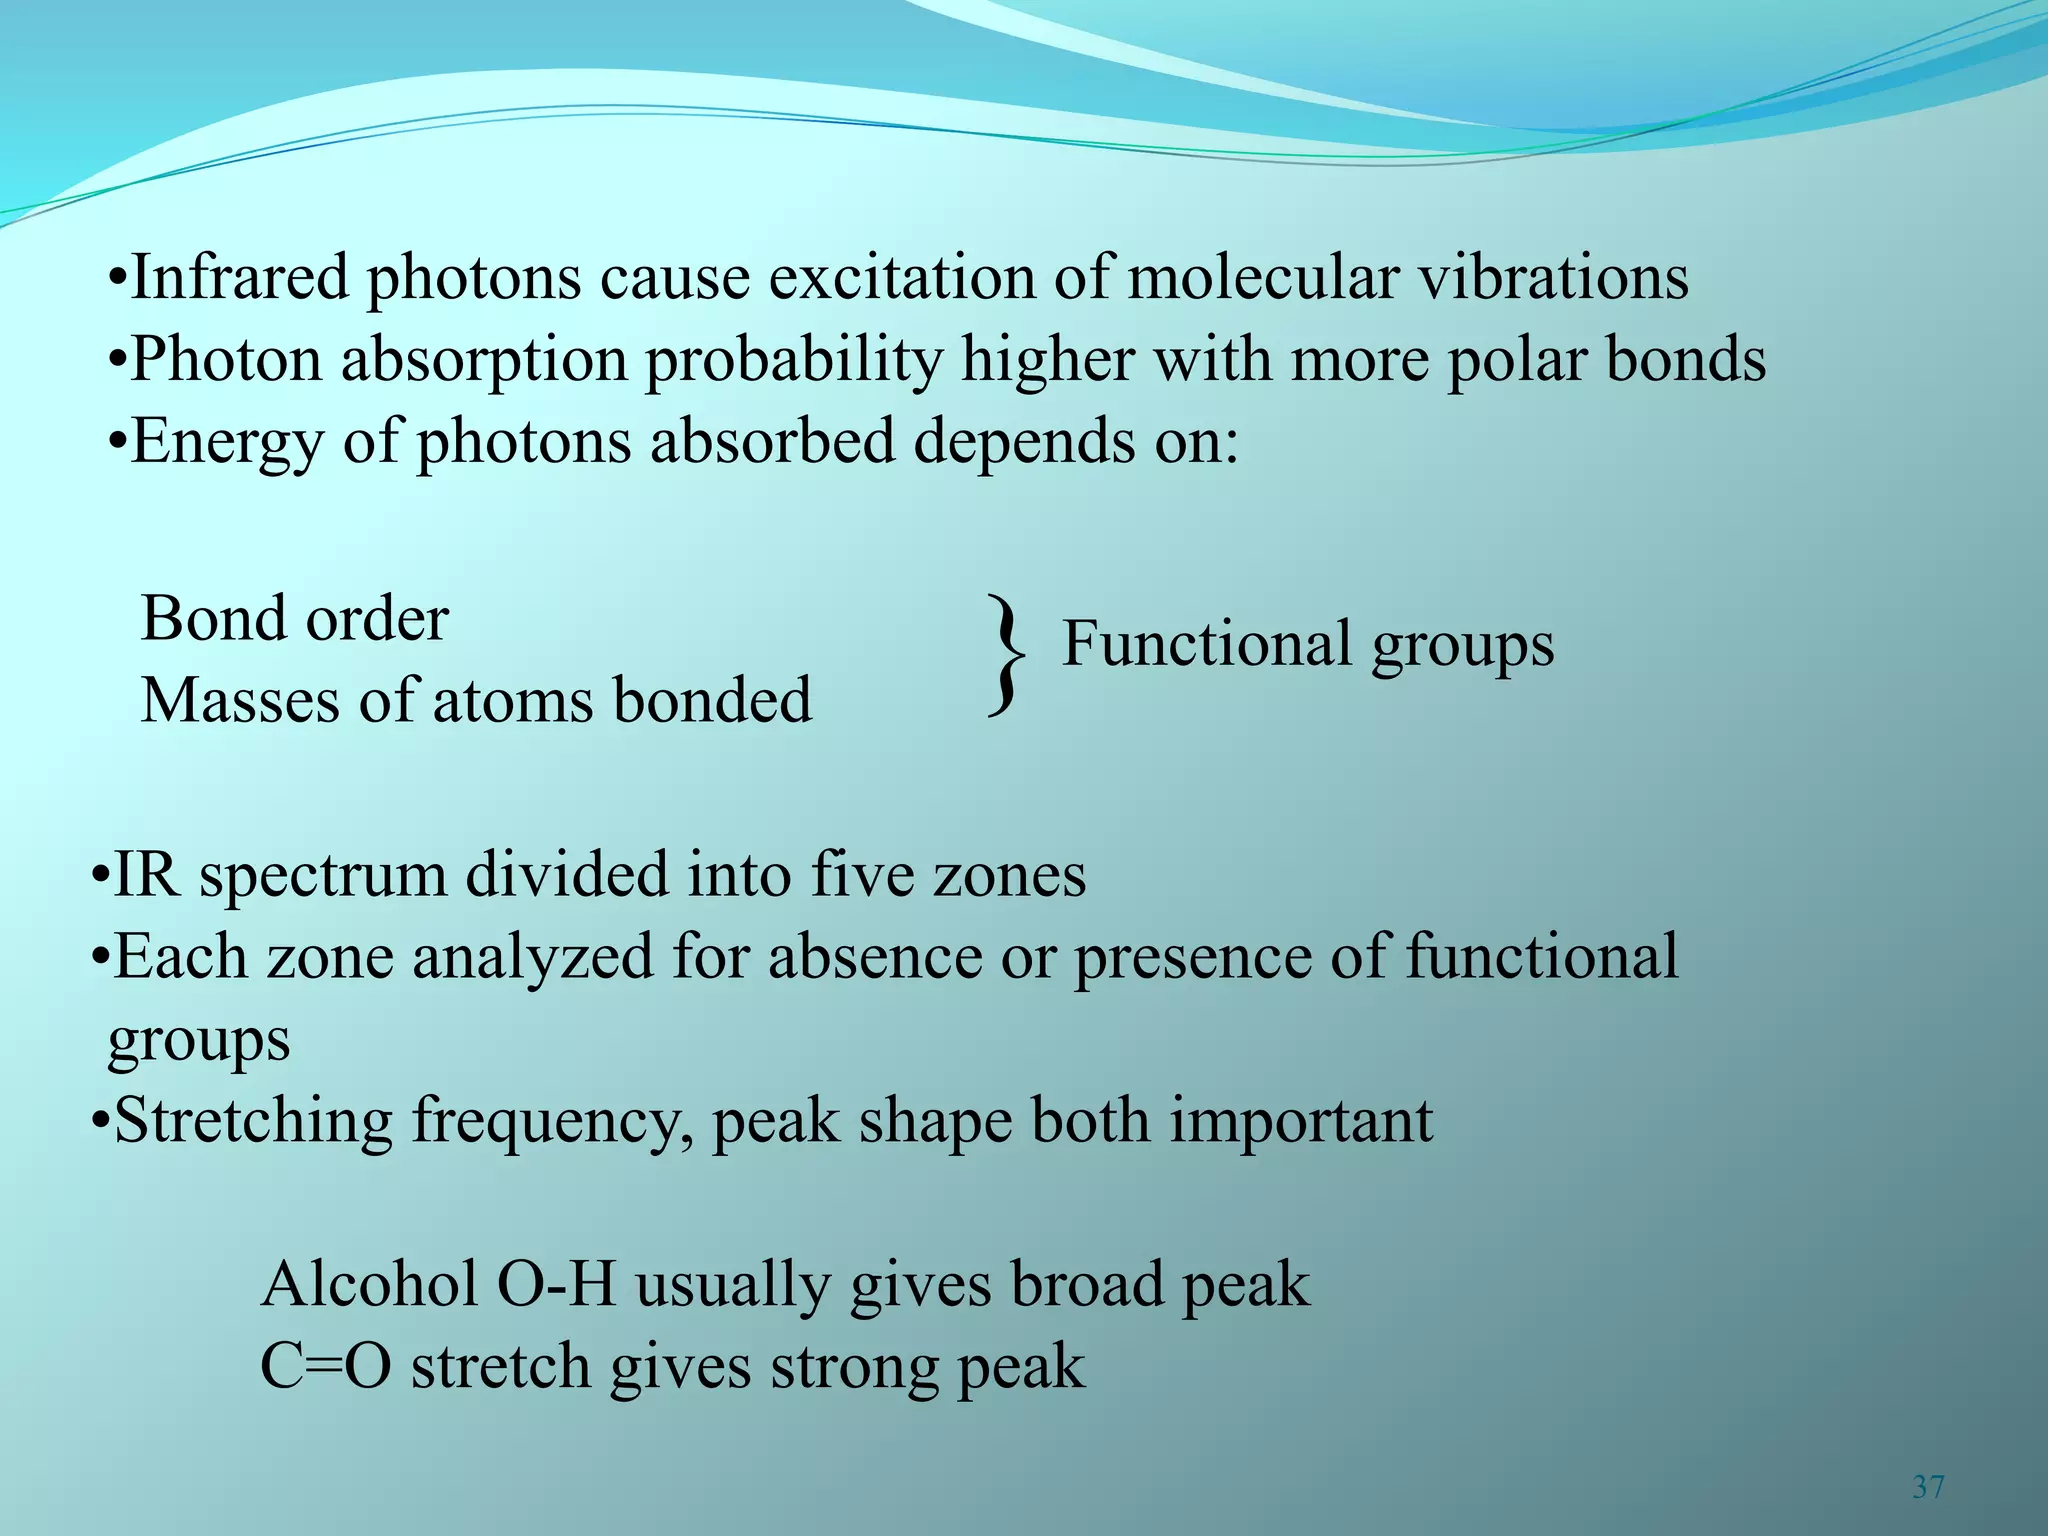
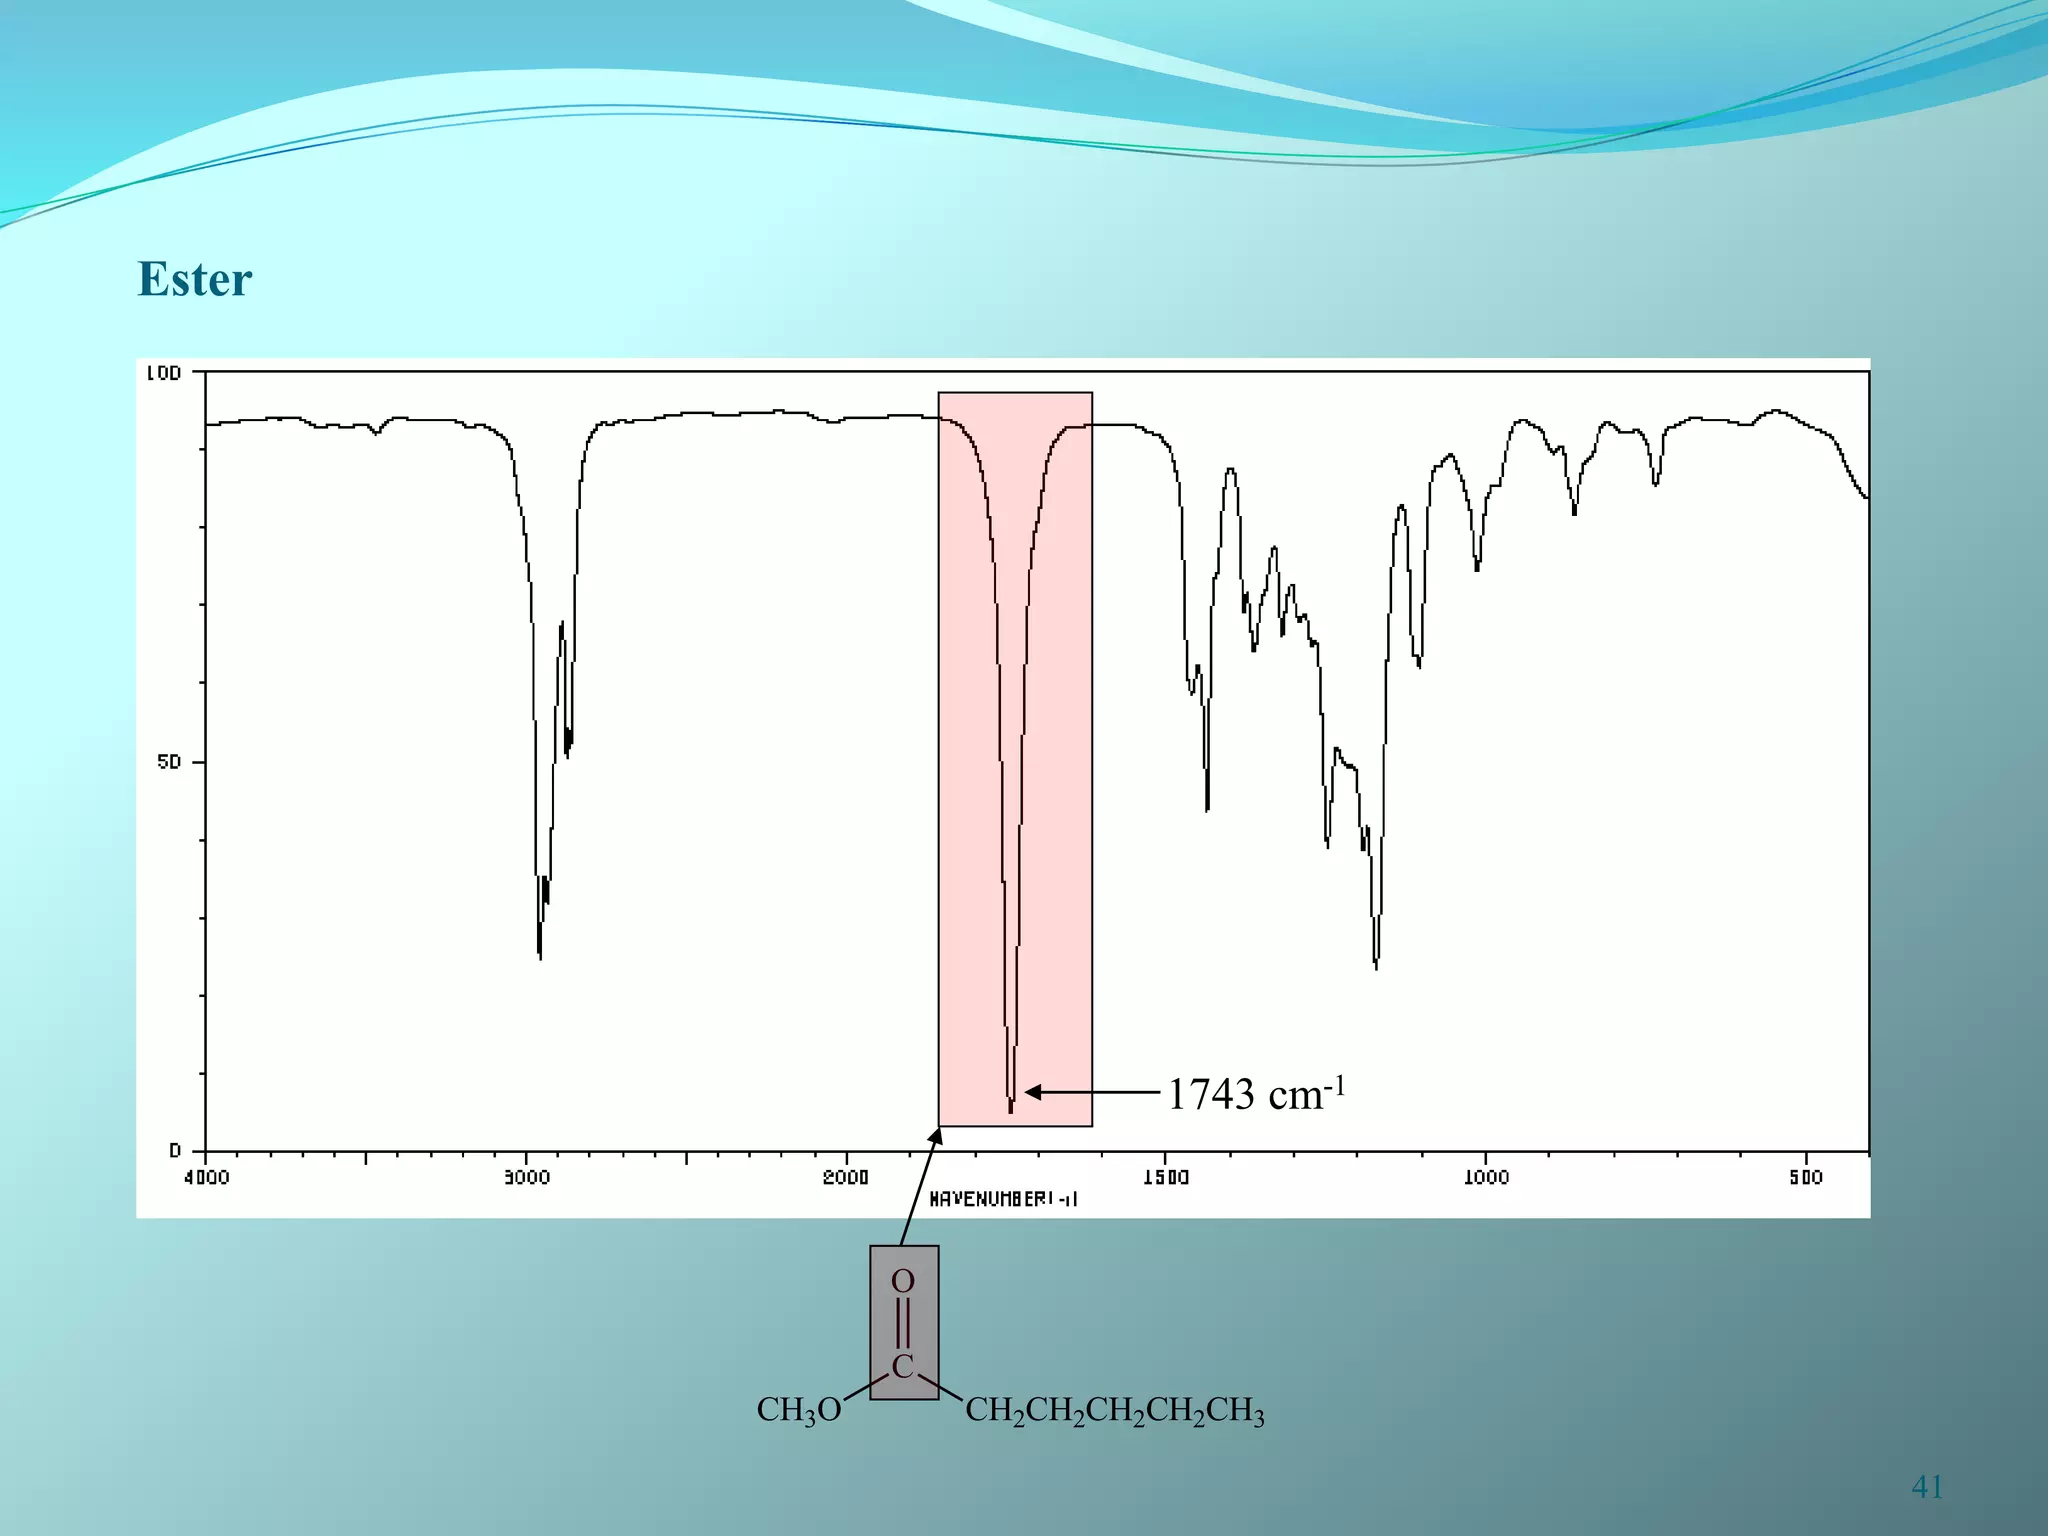
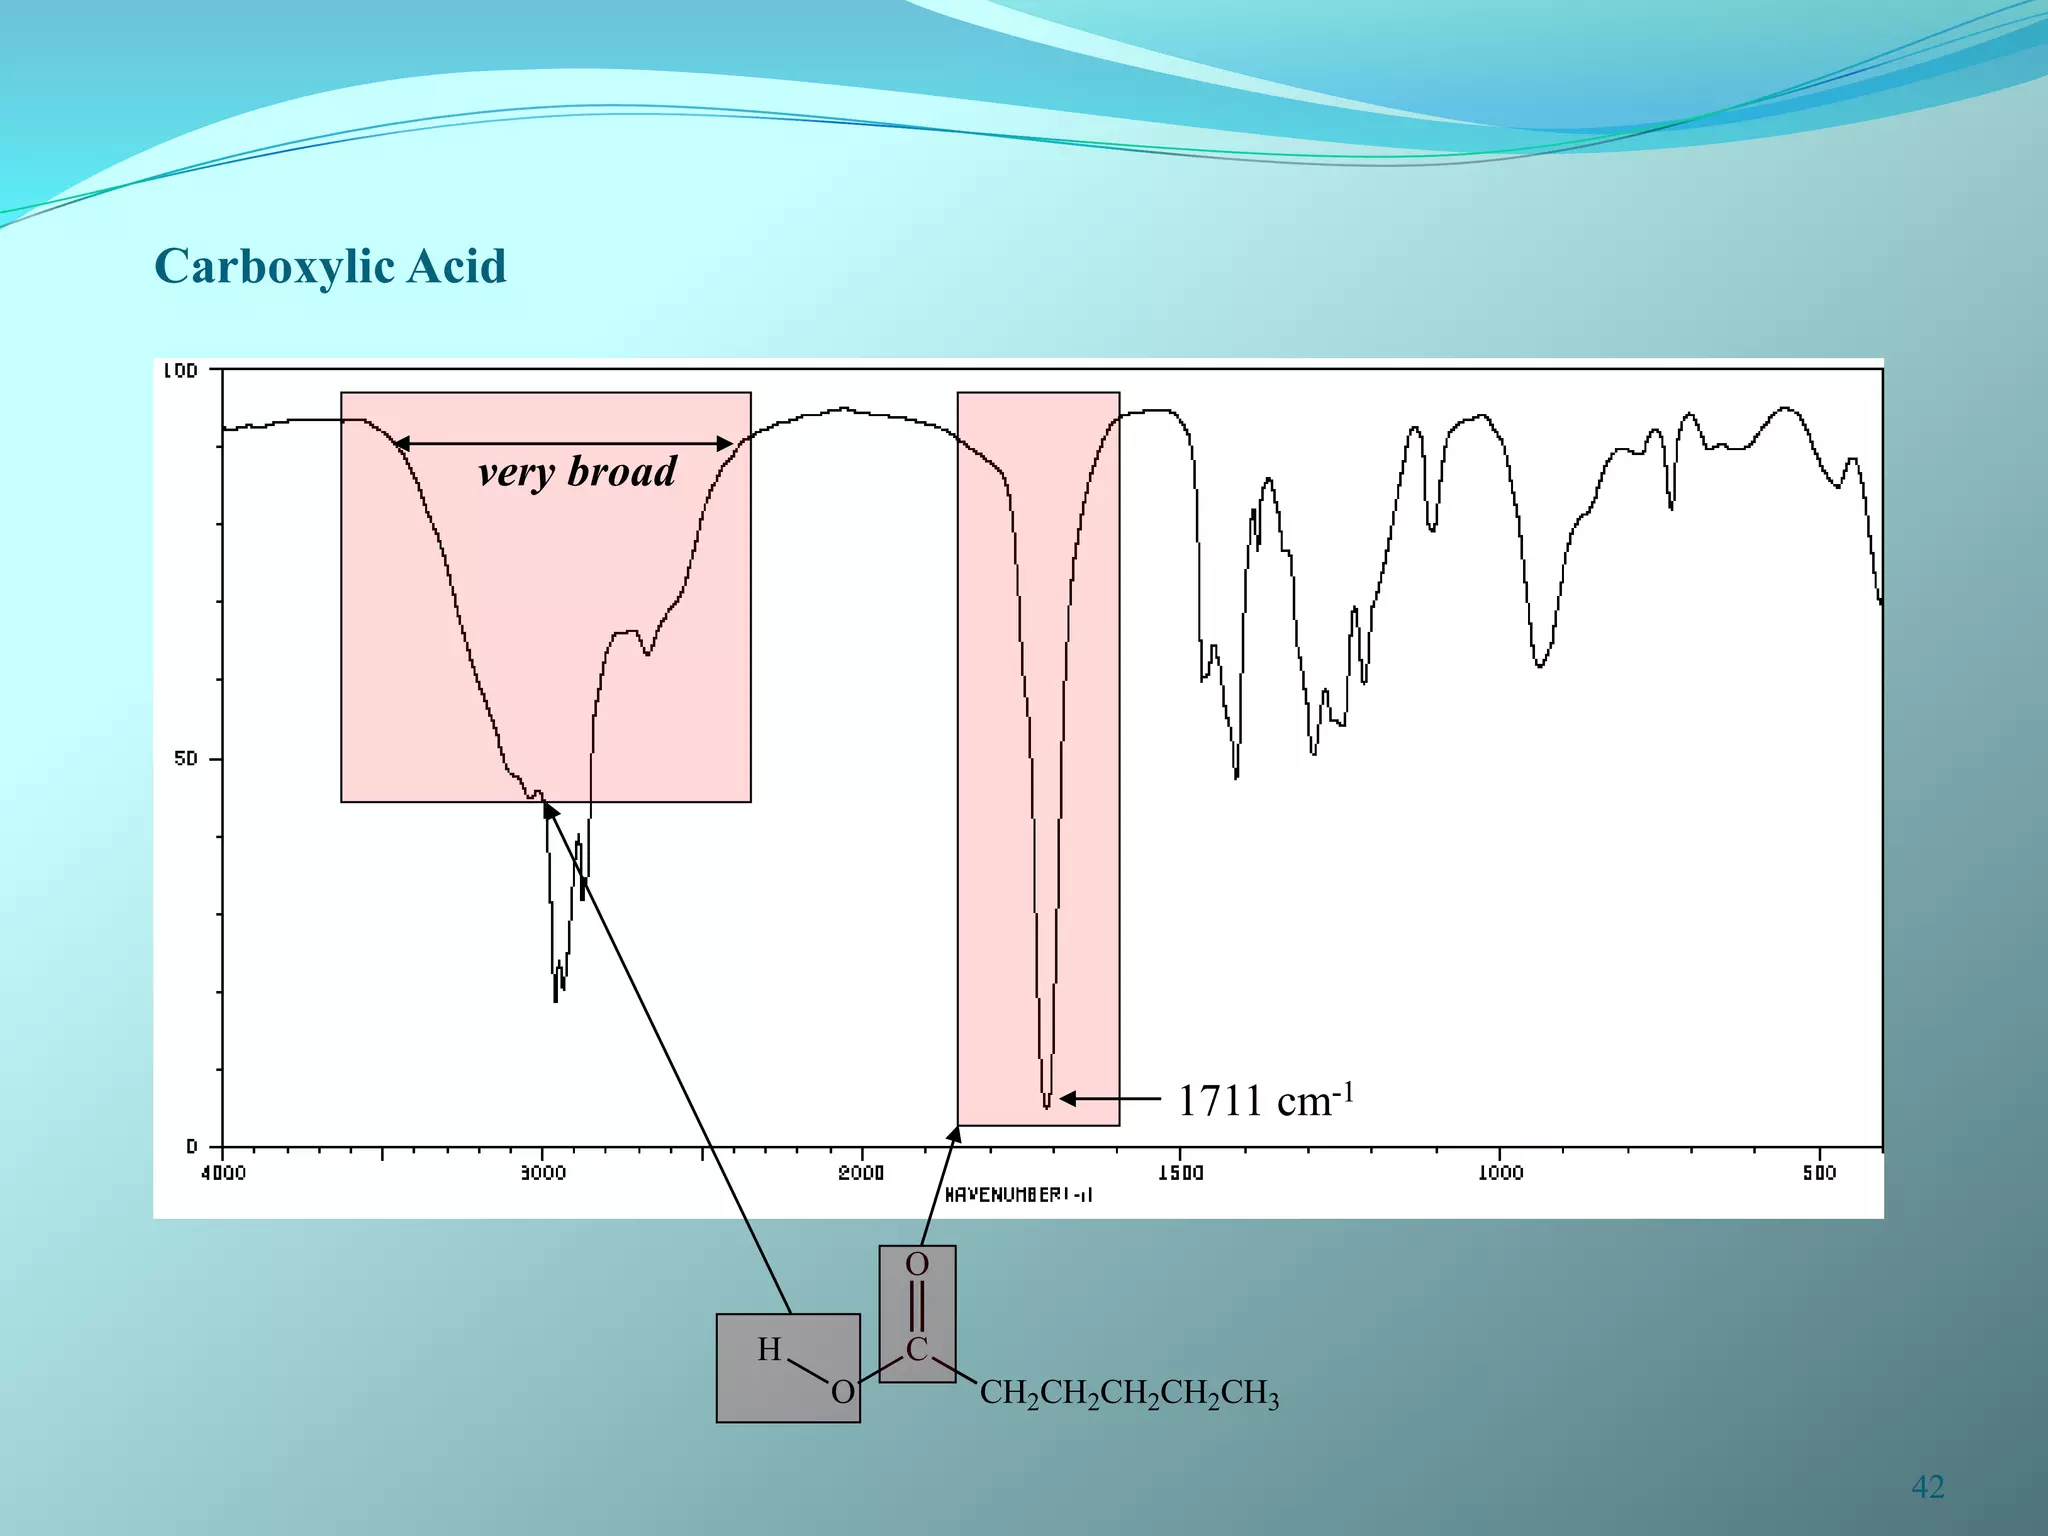
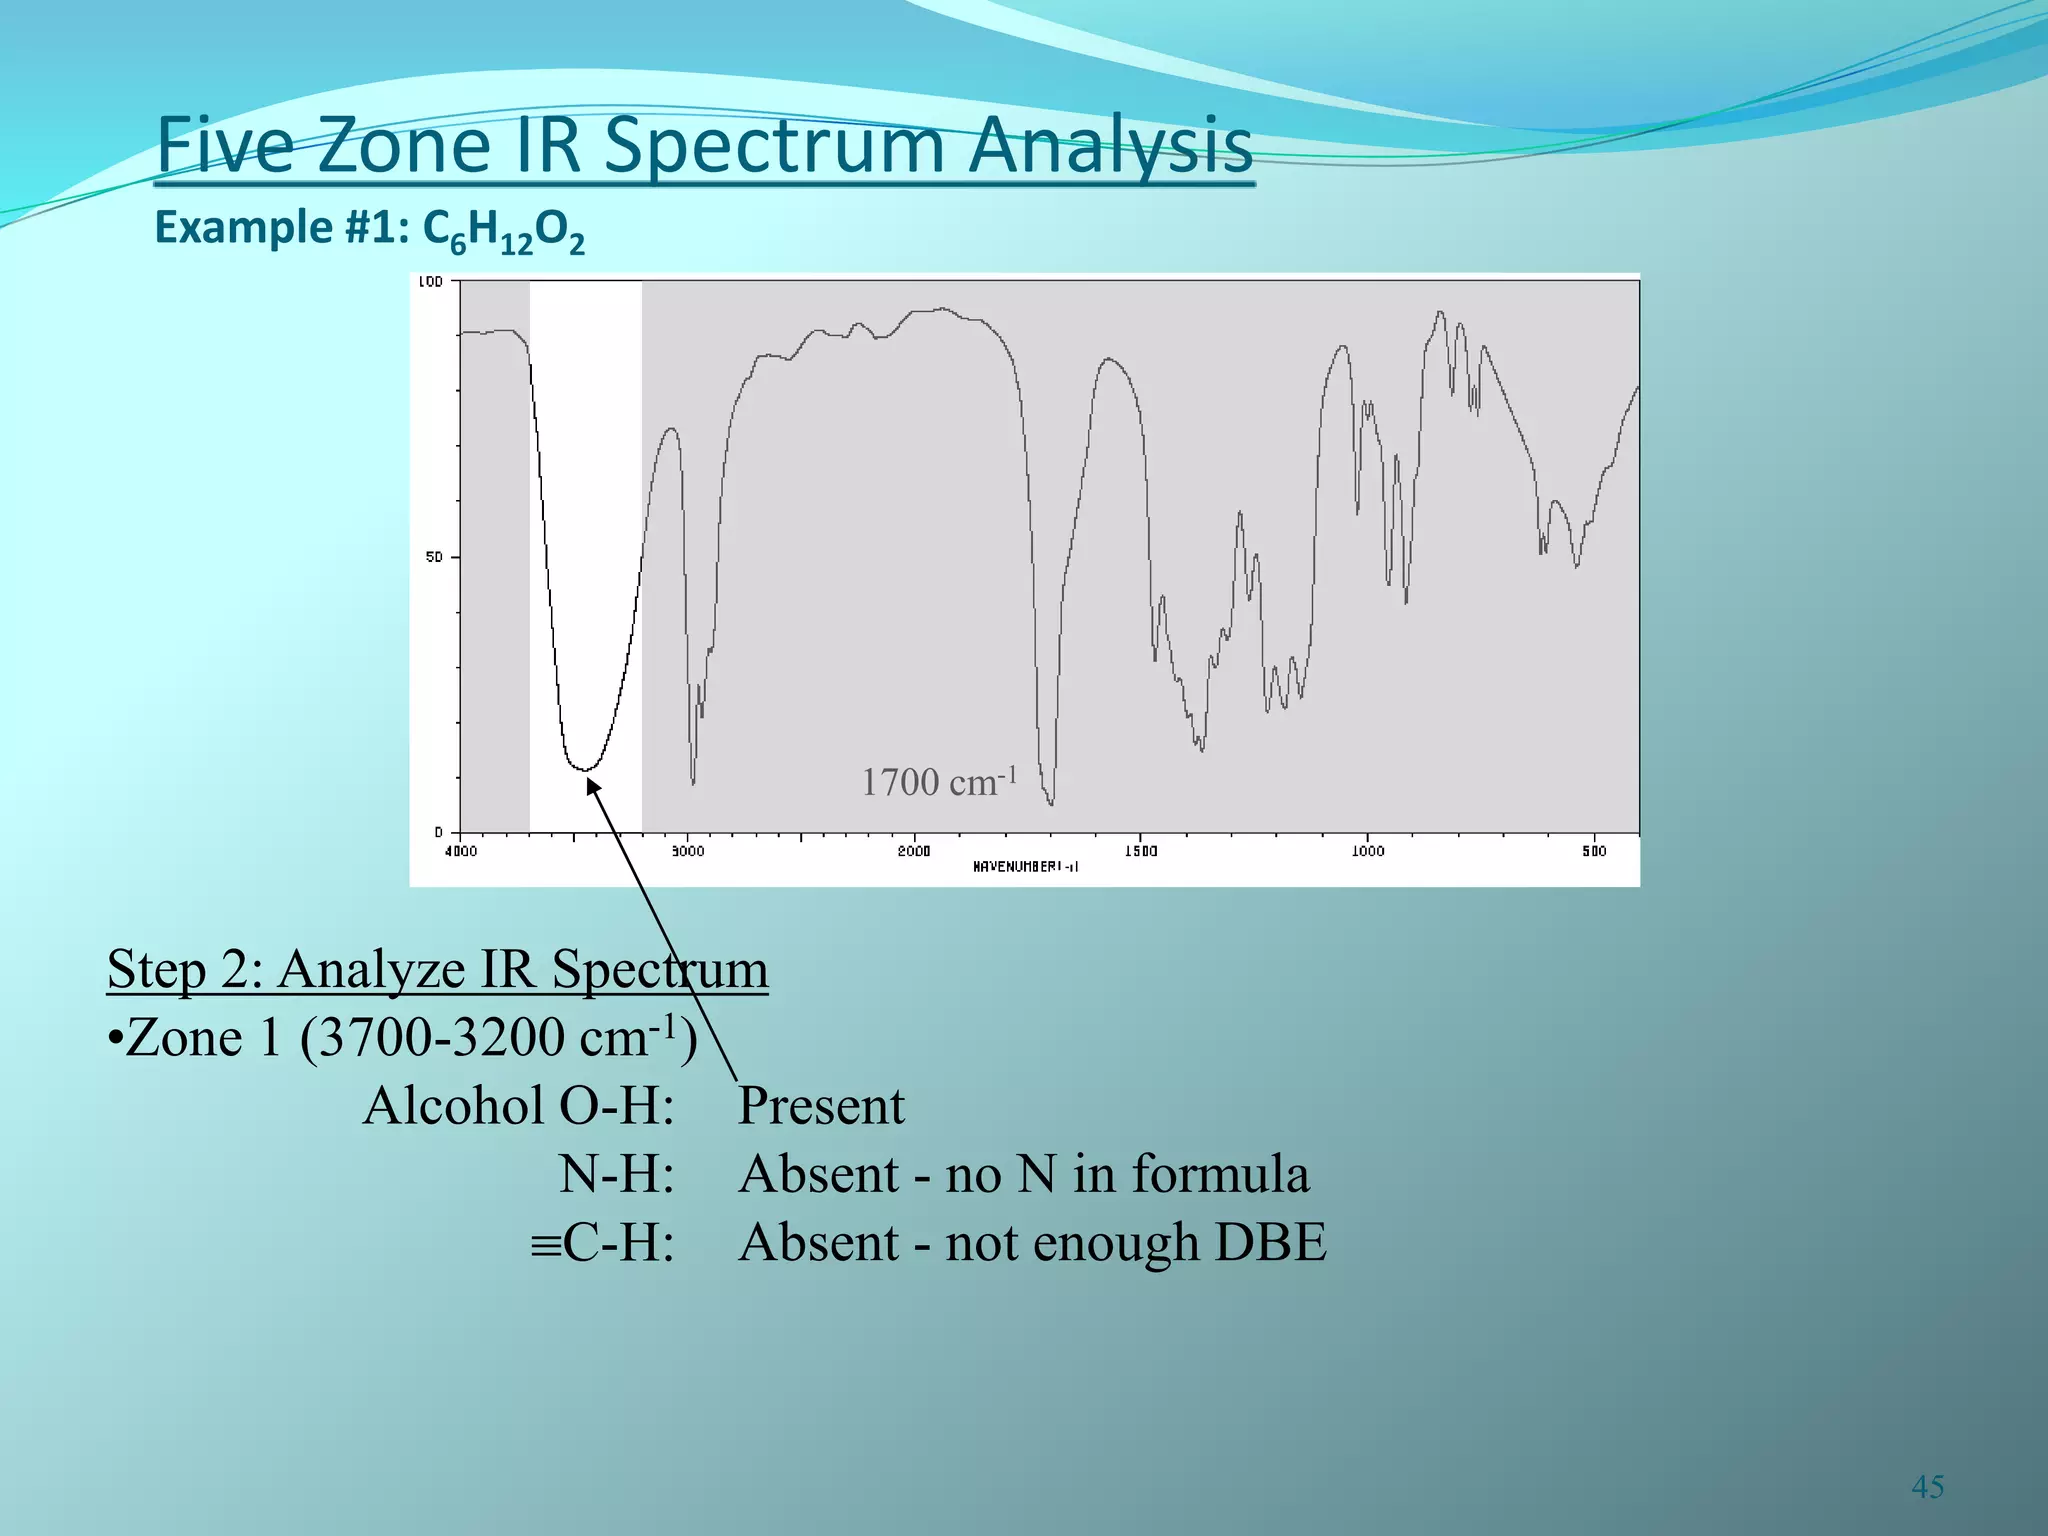
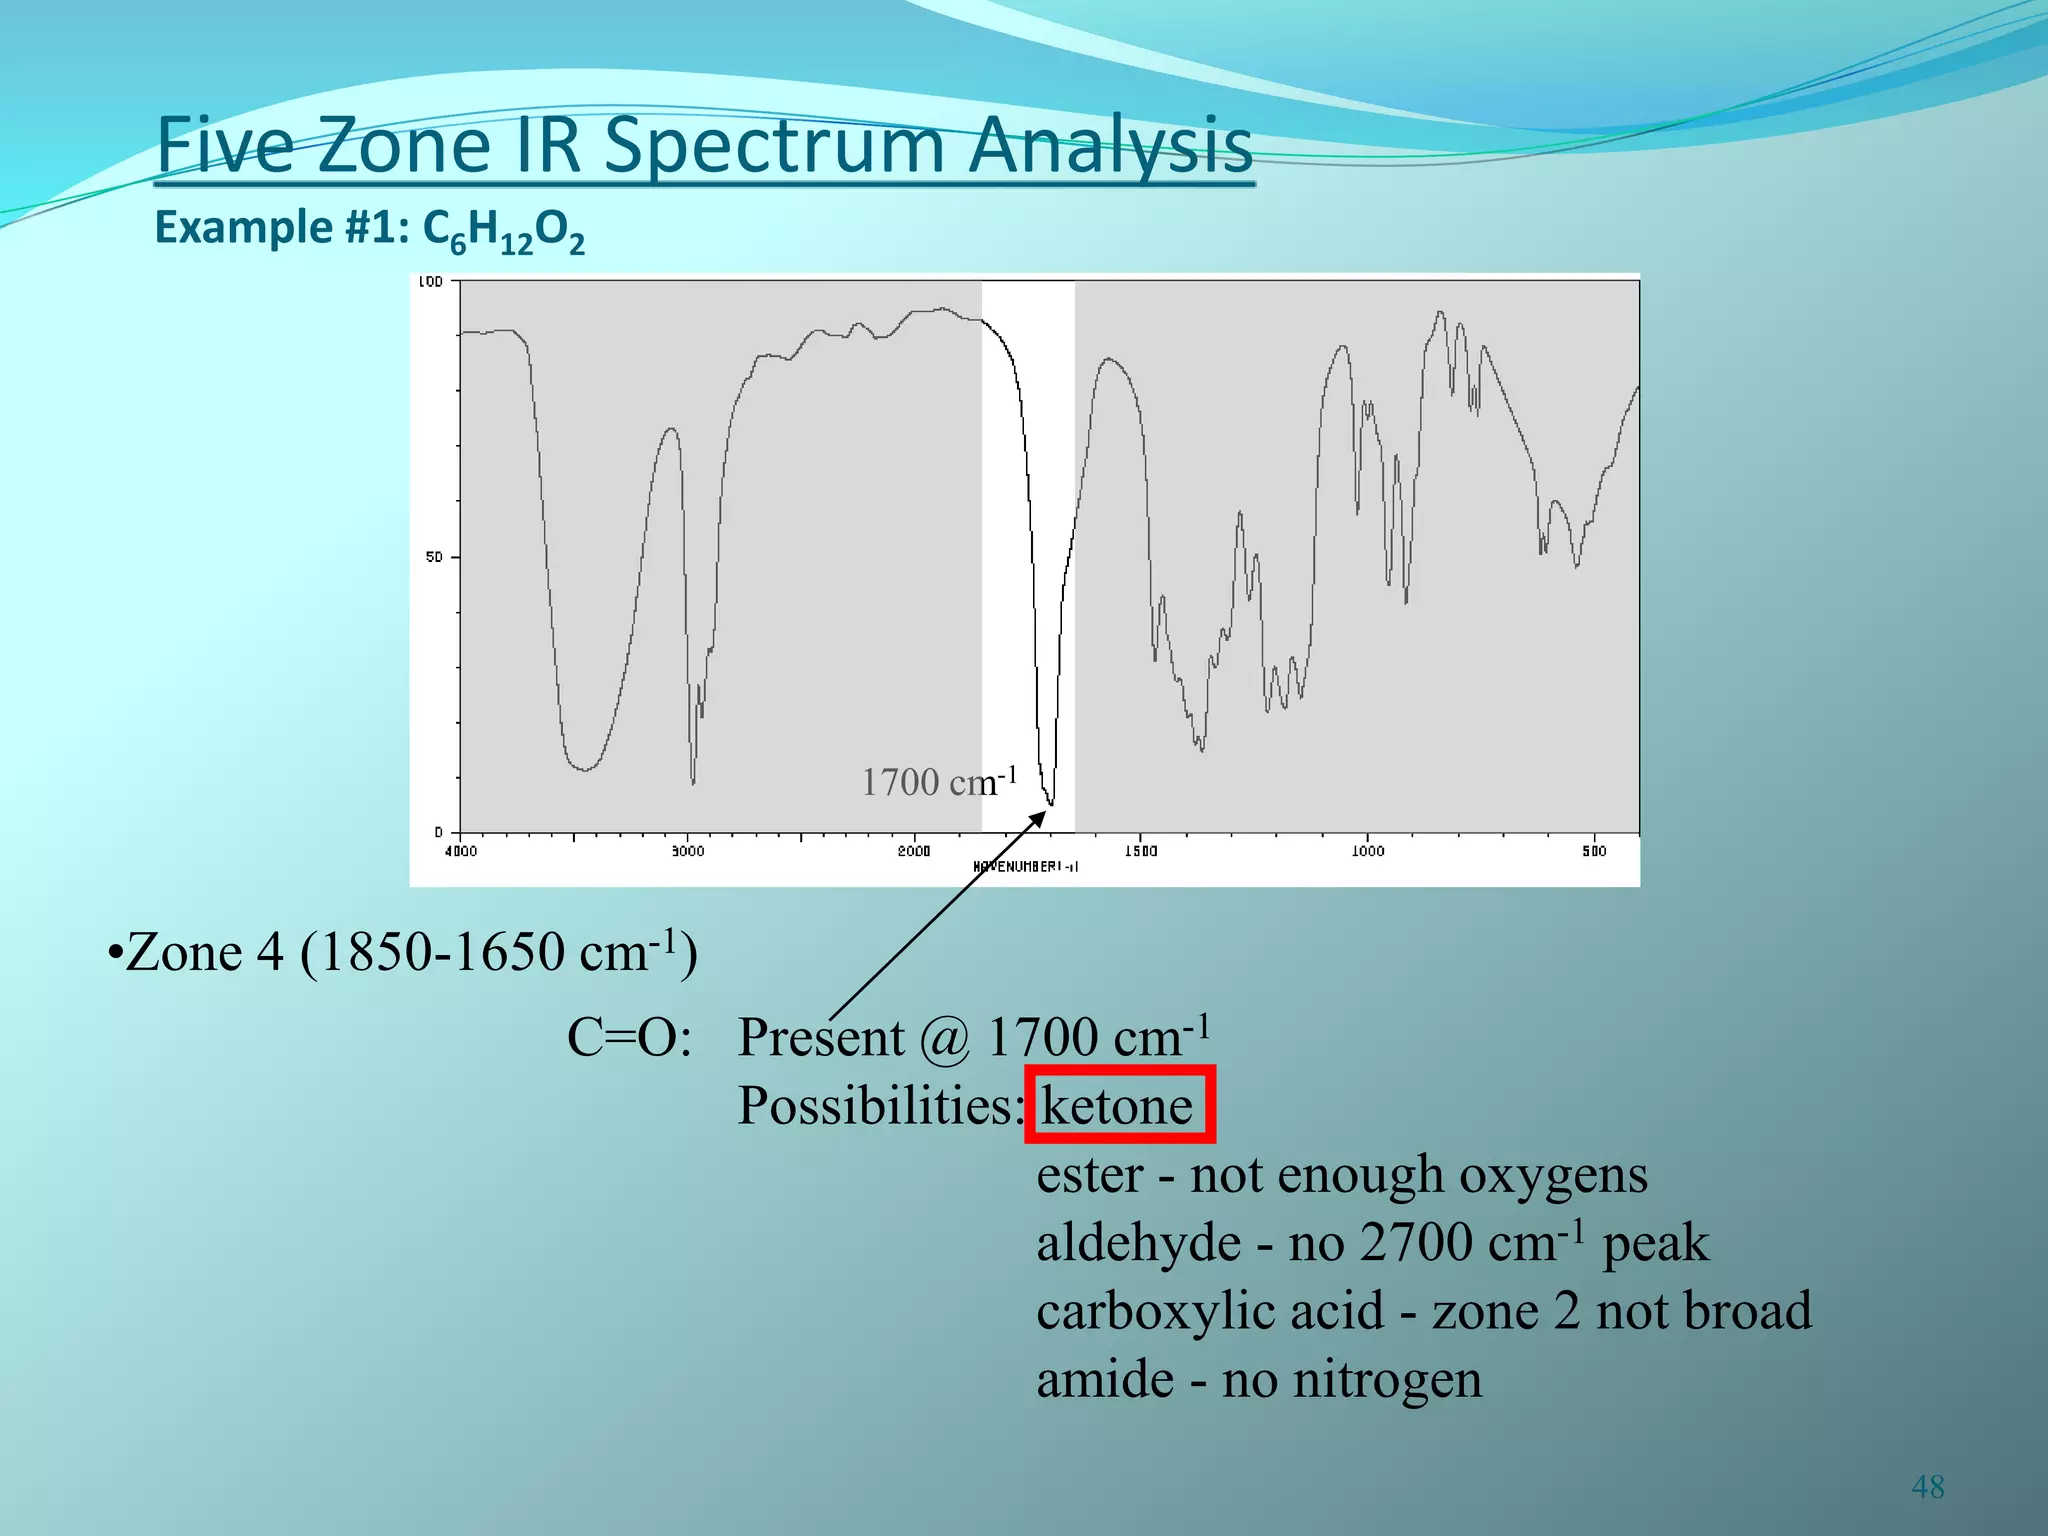
Dr. Prabhakar Chavan
Assistant Professor
Department of Studies and Research in Chemistry
Sahyadri Science College, Kuvempu University
Shivamogga-577 203, Karnataka. INDIA
prabhakarchavan7@gmail.com
INFRARED SPECTROSCOPY
Infrared Spectroscopy (IR)
Molecular Vibrations
2
Fundamental principle
Absorption of photons causes changes in molecular vibrations
Molecular Vibrations
•Bonded atoms move around in space
•Very fast: one vibration cycle ~10-15 seconds
Stretching (H-Cl)
•Atoms move along bond axis
Bending (H-O-H)
•Motion not along bond axis
•Less important than stretching
Molecular Vibrations
3
Vibration energy
•  vibration energy  average bond length
Ground state
lower energy
add energy
Excited state
higher energy
Molecular Vibrations
4
Vibration energy
• Vibrational energy is quantized (only certain energy values are possible)
Excited vibrational state
Ground vibrational state
DE = hn
For bond vibrations:
DE = dependent on bond
= ~5 kcal mol-1
= lower energy than red light photons
= infrared photons
n = stretching frequency
Vibrational
state
energy
INFRARED SPECTROSCOPY
 Infrared radiation stimulates molecular vibrations.
 Infrared spectra are traditionally displayed as %T (percent
transmittance) versus wavenumber (4000-400 cm-1).
 Useful in identifying presence or absence of functional
groups.
INSTRUMENTATION
electromagnetic relationships:
λυ = c λ  1/υ
E = hυ E  υ
E = hc/λ E  1/λ
λ = wave length
υ = frequency
c = speed of light
E = kinetic energy
h = Planck’s constant
λ
c
Two oscillators will strongly interact when their energies
are equal.
E1 = E2
λ1 = λ2
υ1 = υ2
If the energies are different, they will not strongly interact!
We can use electromagnetic radiation to probe atoms and
molecules to find what energies they contain.
10
11
12
13
14
15
16
17
18
Infrared radiation
λ = 2.5 to 17 μm
υ = 4000 to 600 cm-1
These frequencies match the frequencies of covalent bond
stretching and bending vibrations. Infrared spectroscopy
can be used to find out about covalent bonds in molecules.
IR is used to tell:
1. what type of bonds are present
2. some structural information
IR source  sample  prism  detector
graph of % transmission vs. frequency
=> IR spectrum
4000 3000 2000 1500 1000 500
v (cm-1)
100
%T
0
The Infrared Spectrum
21
Many photons absorbed
Spectrum = plot of photon energy versus photon quantity
Number
of
photons
absorbed
Stretching frequency
Proportional to photon energy
Typical infrared spectrum:
Few
photons
absorbed
Molecular Structure from IR Spectrum
22
How does spectrum give information about molecular structure?
•Structure controls number of photons absorbed
•Structure controls stretching frequency
Structure versus Photon Quantity
23
Chance of photon absorption controlled by change in dipole moment (m)
Intensity of IR peak Vector sum of bond dipoles
d+ X Y d-
Useful approximation
Consider only one bond
From quantum mechanics:
Absorption Intensity versus Bond Dipoles
24
•Bond dipole ~ (magnitude of electronegativity difference) x (bond length)
•  DEN  dipole
•  bond length  dipole
•  bond dipole  absorption
In practical terms:
•Highly polar bond  strong peak
•Symmetrical (nonpolar) or nearly symmetrical bond  peak weak or absent
d+ X Y d-
Absorption Intensity versus Bond Dipoles
25
C=O peak strong
H3C CH3
O
CH3
H3C
H3C CH3
C=C peak absent (or maybe weak)
H
H
H3C CH3
C=C peak present but weak
Examples:
Caution!
•Weak peaks not always discernable
•Be careful when excluding symmetrical functional groups base on absence of peak
26
Structure versus Stretching Frequency
27
Hooke’s Law (1660)
•Stretching frequency of two masses on a spring
atoms bond
Stretching frequency =
1
2c
f
mA + mB
mAmB
1/2
 bond order
stretching frequency
increasing
spring stiffness
C-C
C=C
CC
atom masses
Functional groups determine IR stretching frequencies
Characteristic Stretching Frequencies
The Five Zones
28
IR spectrum divided into five zones (groups) of important absorptions
1 2 3 4 5 Fingerprint region
Characteristic Stretching Frequencies
The Five Zones
29
Bond Stretching Frequency Shape and Intensity
Zone 1: 3700-3200 cm-1
Alcohol O-H 3650-3200 cm-1 usually strong and broad
Alkyne C-H 3340-3250 cm-1 usually strong and sharp
Amine or amide N-H 3500-3300 cm-1 medium; often broad
Zone 2: 3200-2700 cm-1
Aryl* or vinyl** sp2 C-H 3100-3000 cm-1 variable
Alkyl sp3 C-H 2960-2850 cm-1 variable
Aldehyde C-H ~2900, ~2700 cm-1 medium; two peaks
Carboxylic acid O-H 3000-2500 cm-1 usually strong; very broad
* attached to benzene ring **attached to alkene
Characteristic Stretching Frequencies
The Five Zones
30
Bond Stretching Frequency Shape and Intensity
Zone 3: 2300-2000 cm-1
Alkyne CC 2260-2000 cm-1 sharp and variable
Nitrile CN 2260-2220 cm-1 sharp and variable
Zone 4: 1850-1650 cm-1
Ketone C=O 1750-1705 cm-1 strong
Ester C=O 1750-1735 cm-1 strong
Aldehyde C=O 1740-1720 cm-1 strong
Carboxylic acid C=O 1725-1700 cm-1 strong
Amide C=O 1690-1650 cm-1 strong
C=O frequencies 20-40 cm-1 lower when conjugated to a pi bond
Characteristic Stretching Frequencies
The Five Zones
31
Bond Stretching Frequency Shape and Intensity
Zone 5: 1680-1450 cm-1
Alkene C=C 1680-1620 cm-1 variable
Benzene C=C
~1600 and
1500-1450 cm-1
variable;
1600 cm-1 often two peaks
32
Terminal Alkyne
33
C C
H CH2CH2CH2CH3
C-C
Terminal Alkene
34
C
C
H
CH2CH2CH2CH3
H
H
Alcohol
35
H O CH2CH2CH2CH2CH2CH3
broad
C-O
Ketone
36
C
H3C CH2CH3
O
very
strong
1718 cm-1
37
•Infrared photons cause excitation of molecular vibrations
•Photon absorption probability higher with more polar bonds
•Energy of photons absorbed depends on:
}Functional groups
•IR spectrum divided into five zones
•Each zone analyzed for absence or presence of functional
groups
•Stretching frequency, peak shape both important
Bond order
Masses of atoms bonded
Alcohol O-H usually gives broad peak
C=O stretch gives strong peak
Ketone (again)
38
C
H3C CH2CH3
O
very
strong
1718 cm-1
Aldehyde
39
C
H CH2CH2CH2CH2CH3
O
~2900 cm-1
usually obscured
very
strong
1718 cm-1
Ketone with Alkene Conjugation
40
C
H3C C
C
O
H
H
H
Conjugation with pi bond lowers
C=O stretch by 20-40 cm-1
1720 cm-1
Ester
41
C
CH3O CH2CH2CH2CH2CH3
O
1743 cm-1
Carboxylic Acid
42
C
O CH2CH2CH2CH2CH3
O
H
very broad
1711 cm-1
Benzene Ring
43
H3C
H
H
H H
H
May be two peaks
Five Zone IR Spectrum Analysis
Example #1: C6H12O2
44
1700 cm-1
Step 1: Calculate DBE
DBE = C - (H/2) + (N/2) + 1
= 6 - (12/2) + (0/2) +1
= 1
One ring or one pi bond
Five Zone IR Spectrum Analysis
Example #1: C6H12O2
45
1700 cm-1
Step 2: Analyze IR Spectrum
•Zone 1 (3700-3200 cm-1)
Present
Absent - no N in formula
Absent - not enough DBE
Alcohol O-H:
N-H:
C-H:
Five Zone IR Spectrum Analysis
Example #1: C6H12O2
46
1700 cm-1
•Zone 2 (3200-2700 cm-1)
Aryl/vinyl sp2 C-H:
Alkyl sp3 C-H:
Aldehyde C-H:
Carboxylic acid O-H:
Probably not (not enough DBE)
Absent - no 2700 cm-1
Absent - not broad enough
Present
Five Zone IR Spectrum Analysis
Example #1: C6H12O2
47
1700 cm-1
•Zone 3 (2300-2000 cm-1)
Alkyne CC:
Nitrile CN:
Absent - no peaks; not enough DBE
Five Zone IR Spectrum Analysis
Example #1: C6H12O2
48
1700 cm-1
•Zone 4 (1850-1650 cm-1)
C=O:
Possibilities: ketone
ester - not enough oxygens
aldehyde - no 2700 cm-1 peak
carboxylic acid - zone 2 not broad
amide - no nitrogen
Present @ 1700 cm-1
Five Zone IR Spectrum Analysis
Example #1: C6H12O2
49
1700 cm-1
•Zone 5 (1680-1450 cm-1)
Benzene ring:
Alkene C=C:
Absent - no peak ~1600 cm-1; not enough DBE
Actual structure:
OH
O
Five Zone IR Spectrum Analysis
Example #2: C8H7N
50
Step 1: Calculate DBE
DBE = C - (H/2) + (N/2) + 1
= 8 - (7/2) + (1/2) +1
= 6
Six rings and/or pi bonds
Possible benzene ring
Five Zone IR Spectrum Analysis
Example #2: C8H7N
51
Step 2: Analyze IR Spectrum
•Zone 1 (3700-3200 cm-1)
Absent - no oxygen in formula
Absent - peaks too small
Alcohol O-H:
N-H:
C-H:
Five Zone IR Spectrum Analysis
Example #2: C8H7N
52
•Zone 2 (3200-2700 cm-1)
Aryl/vinyl sp2 C-H:
Alkyl sp3 C-H:
Aldehyde C-H:
Carboxylic acid O-H:
Present - peaks > 3000 cm-1
Present - peaks < 3000 cm-1
Absent - no 2700 cm-1; no C=O in zone 4
Absent - not broad enough; C=O in zone 4
Five Zone IR Spectrum Analysis
Example #2: C8H7N
53
•Zone 3 (2300-2000 cm-1)
Alkyne CC:
Nitrile CN:
Possible
Possible }
Five Zone IR Spectrum Analysis
Example #2: C8H7N
54
•Zone 4 (1850-1650 cm-1)
C=O: Absent - no peak; no oxygen in formula
Five Zone IR Spectrum Analysis
Example #2: C8H7N
55
•Zone 5 (1680-1450 cm-1)
Benzene ring:
Alkene C=C:
Present - peaks ~1600 cm-1 and ~1500 cm-1
triple bond
Absent - not enough DBE for alkene plus benzene plus
Actual structure: CH2C
C N
56
57
toluene
IR spectra of ALKANES
C—H bond “saturated”
(sp3) 2850-2960 cm-1
+ 1350-1470 cm-1
-CH2- + 1430-1470
-CH3 + “ and 1375
-CH(CH3)2 + “ and 1370, 1385
-C(CH3)3 + “ and 1370(s), 1395 (m)
n-pentane
CH3CH2CH2CH2CH3
3000 cm-1
1470 &1375 cm-1
2850-2960 cm-1
sat’d C-H
CH3CH2CH2CH2CH2CH3
n-hexane
2-methylbutane (isopentane)
2,3-dimethylbutane
cyclohexane
no 1375 cm-1
no –CH3
IR of ALKENES
=C—H bond, “unsaturated” vinyl
(sp2) 3020-3080 cm-1
+ 675-1000
RCH=CH2 + 910-920 & 990-1000
R2C=CH2 + 880-900
cis-RCH=CHR + 675-730 (v)
trans-RCH=CHR + 965-975
C=C bond 1640-1680 cm-1 (v)
1-decene
910-920 &
990-1000
RCH=CH2
C=C 1640-1680
unsat’d
C-H
3020-3080
cm-1
4-methyl-1-pentene
910-920 &
990-1000
RCH=CH2
2-methyl-1-butene
880-900
R2C=CH2
2,3-dimethyl-1-butene
880-900
R2C=CH2
IR spectra BENZENEs
=C—H bond, “unsaturated” “aryl”
(sp2) 3000-3100 cm-1
+ 690-840
mono-substituted + 690-710, 730-770
ortho-disubstituted + 735-770
meta-disubstituted + 690-710, 750-810(m)
para-disubstituted + 810-840(m)
C=C bond 1500, 1600 cm-1
ethylbenzene
690-710, 730-770
mono-
1500 & 1600
Benzene ring
3000-3100 cm-1
Unsat’d C-H
o-xylene
735-770
ortho
p-xylene
810-840(m)
para
m-xylene
meta
690-710,
750-810(m)
styrene
no sat’d C-
H
910-920 &
990-1000
RCH=CH2
mono
1640
C=C
2-phenylpropene
mono
880-900
R2C=C
H2
Sat’d C-
H
p-methylstyrene
para
IR spectra ALCOHOLS & ETHERS
C—O bond 1050-1275 (b) cm-1
1o ROH 1050
2o ROH 1100
3o ROH 1150
ethers 1060-1150
O—H bond 3200-3640 (b) 
1-butanol
CH3CH2CH2CH2-OH
C-O
1o
3200-3640 (b) O-
H
2-butanol
C-O
2o
O-H
tert-butyl alcohol
C-O 3o
O-H
methyl n-propyl ether
no O--
H
C-O
ether
2-butanone
 C=O
~1700 (s)
C9H12
C-H unsat’d &
sat’d
1500 &
1600
benzene
mono
C9H12 – C6H5 = -
C3H7
isopropylbenzene
n-propylbenzene?
n-propylbenzene
isopropyl split 1370 + 1385
isopropylbenzene
C8H6
C-H
unsat’d
1500, 1600
benzene
mono
C8H6 – C6H5 = C2H
phenylacetylene
3300
C-H
C4H8
1640-
1680
C=C
880-900
R2C=CH2
isobutylene CH3
CH3C=CH2
Unst’d
Which compound is this?
a) 2-pentanone
b) 1-pentanol
c) 1-bromopentane
d) 2-methylpentane
1-pentanol
What is the compound?
a) 1-bromopentane
b) 1-pentanol
c) 2-pentanone
d) 2-methylpentane
2-pentanone
H2
C C
H
CH2
CH3
CH3
CH3CH2CH2CH2CH3
H2
C
H2
C
CH2CH2CH2CH3
biphenyl allylbenzene 1,2-diphenylethane
o-xylene n-pentane n-butylbenzene
A
B
C
D
E
F
In a “matching” problem, do not try to fully analyze each
spectrum. Look for differences in the possible compounds that
will show up in an infrared spectrum.
1
2
3
4
5
6
99
100
101
Thank You

IR SPECTROSCOPY.ppt