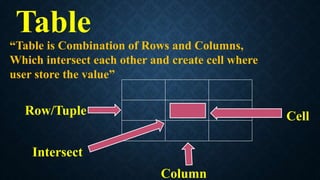
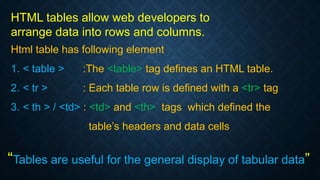
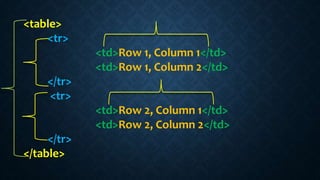
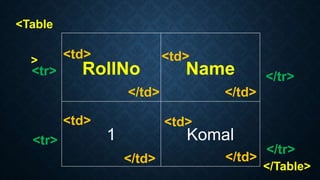
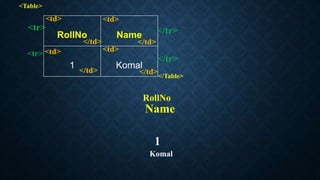
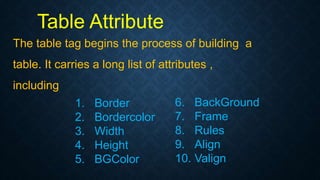
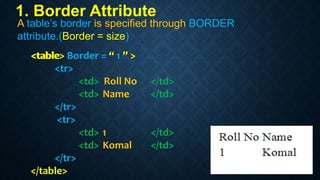
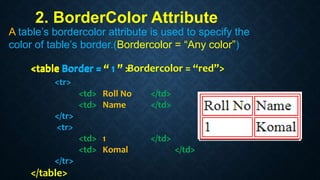
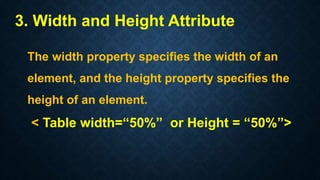
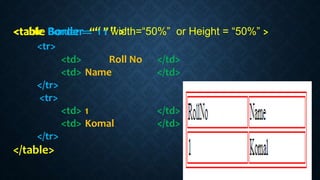
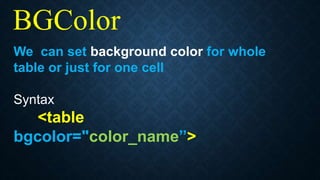
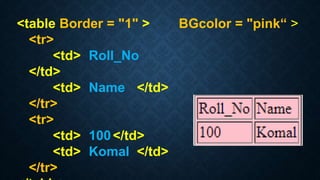
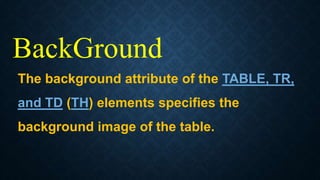
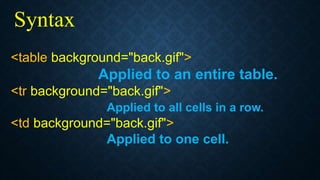
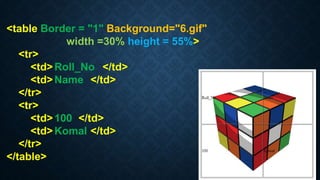
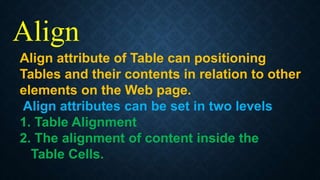
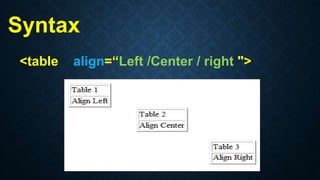
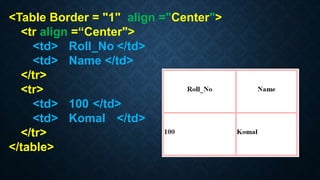
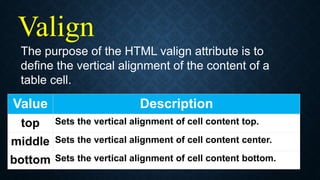
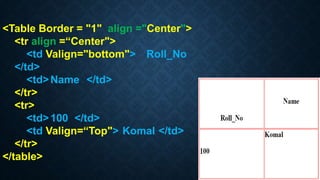
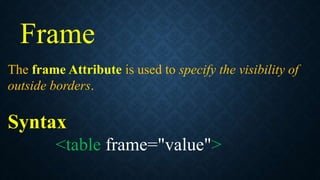
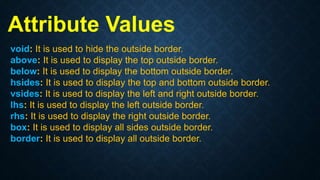
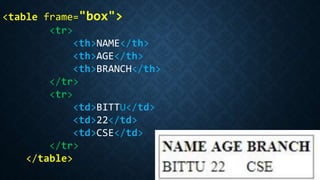
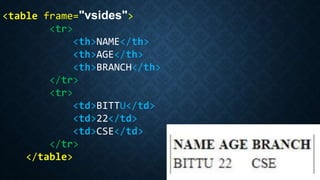
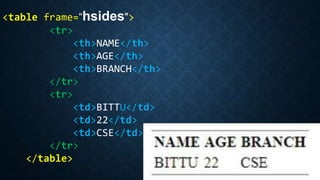
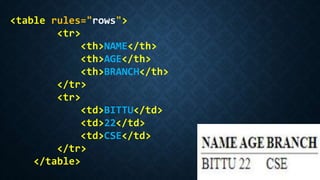
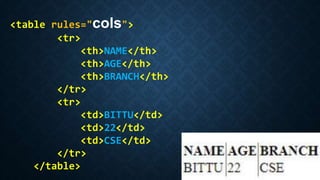
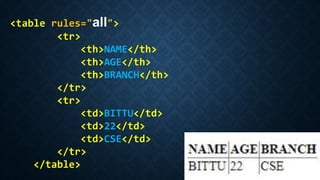
The document discusses HTML tables and their structure and attributes. It explains that HTML tables allow arranging data into rows and columns using <table>, <tr>, and <td> tags. It then describes various table attributes like border, width, height, bgcolor, background, frame, align, valign, and rules that can customize a table's appearance and layout.
Web Visualization with HTML5, CSS3, and JavaScript is the course with the rapidly changing web
development technologies, it has become important to stay in line with them to progress within the industry,
which is why this course in web virtualization has been brought to you to spruce up your web designing and
animating skills using HTML5, CSS3 and JavaScript. The latest features of HTML5, CSS3 and JavaScript is set
to be provided to you through this course, hence, it is desired that you have basic knowledge on these
programming languages for a smoother learning experience.
This course will start off by walking you through the CSS3 virtualization techniques to design and
animate webs. You will be taught how to create a 3D element using CSS transition and to transform animates
into 2D and 3D, along with an insight into the elements of scalable vector graphics which is needed to create basic
images and polygons and to animate.
Our tutors will further take you through the canvas aspects of HTML5 to start drawing grids and
animations using it. You will also get to learn how to create a callback and create and activate a queue that is
needed in animating and the animation libraries that will be essential to your web designing projects. By the end
of this course, you will have an outstanding knowledge of web visualization using HTML5, CSS3 and
JavaScript to secure yourself a prominent place within the web development industry.
This presentation is regarding HTML table.In this it is briefly explained about the HTML table from which we can get good knowledge about how to use Tables in HTML.
Using this presentation you will learn dividing the browser window into different parts(frame). With frames, several Web pages can be displayed in the same browser window.
This slide guides through the differences of the Span and Div tags in HTML.
I started a channel on YouTube for Networking lovers. "VERY SIMPLE NETWORKING" SERIES can be found at http://www.youtube.com/bgccnadom.
THANK YOU FOR YOUR SUPPORT AND LIKES.
Developing Distributed High-performance Computing Capabilities of an Open Sci...Globus
COVID-19 had an unprecedented impact on scientific collaboration. The pandemic and its broad response from the scientific community has forged new relationships among public health practitioners, mathematical modelers, and scientific computing specialists, while revealing critical gaps in exploiting advanced computing systems to support urgent decision making. Informed by our team’s work in applying high-performance computing in support of public health decision makers during the COVID-19 pandemic, we present how Globus technologies are enabling the development of an open science platform for robust epidemic analysis, with the goal of collaborative, secure, distributed, on-demand, and fast time-to-solution analyses to support public health.
In 2015, I used to write extensions for Joomla, WordPress, phpBB3, etc and I ...Juraj Vysvader
In 2015, I used to write extensions for Joomla, WordPress, phpBB3, etc and I didn't get rich from it but it did have 63K downloads (powered possible tens of thousands of websites).
Software Engineering, Software Consulting, Tech Lead.
Spring Boot, Spring Cloud, Spring Core, Spring JDBC, Spring Security,
Spring Transaction, Spring MVC,
Log4j, REST/SOAP WEB-SERVICES.
SOCRadar Research Team: Latest Activities of IntelBrokerSOCRadar
The European Union Agency for Law Enforcement Cooperation (Europol) has suffered an alleged data breach after a notorious threat actor claimed to have exfiltrated data from its systems. Infamous data leaker IntelBroker posted on the even more infamous BreachForums hacking forum, saying that Europol suffered a data breach this month.
The alleged breach affected Europol agencies CCSE, EC3, Europol Platform for Experts, Law Enforcement Forum, and SIRIUS. Infiltration of these entities can disrupt ongoing investigations and compromise sensitive intelligence shared among international law enforcement agencies.
However, this is neither the first nor the last activity of IntekBroker. We have compiled for you what happened in the last few days. To track such hacker activities on dark web sources like hacker forums, private Telegram channels, and other hidden platforms where cyber threats often originate, you can check SOCRadar’s Dark Web News.
Stay Informed on Threat Actors’ Activity on the Dark Web with SOCRadar!
Code reviews are vital for ensuring good code quality. They serve as one of our last lines of defense against bugs and subpar code reaching production.
Yet, they often turn into annoying tasks riddled with frustration, hostility, unclear feedback and lack of standards. How can we improve this crucial process?
In this session we will cover:
- The Art of Effective Code Reviews
- Streamlining the Review Process
- Elevating Reviews with Automated Tools
By the end of this presentation, you'll have the knowledge on how to organize and improve your code review proces
Unleash Unlimited Potential with One-Time Purchase
BoxLang is more than just a language; it's a community. By choosing a Visionary License, you're not just investing in your success, you're actively contributing to the ongoing development and support of BoxLang.
Check out the webinar slides to learn more about how XfilesPro transforms Salesforce document management by leveraging its world-class applications. For more details, please connect with sales@xfilespro.com
If you want to watch the on-demand webinar, please click here: https://www.xfilespro.com/webinars/salesforce-document-management-2-0-smarter-faster-better/
Exploring Innovations in Data Repository Solutions - Insights from the U.S. G...Globus
The U.S. Geological Survey (USGS) has made substantial investments in meeting evolving scientific, technical, and policy driven demands on storing, managing, and delivering data. As these demands continue to grow in complexity and scale, the USGS must continue to explore innovative solutions to improve its management, curation, sharing, delivering, and preservation approaches for large-scale research data. Supporting these needs, the USGS has partnered with the University of Chicago-Globus to research and develop advanced repository components and workflows leveraging its current investment in Globus. The primary outcome of this partnership includes the development of a prototype enterprise repository, driven by USGS Data Release requirements, through exploration and implementation of the entire suite of the Globus platform offerings, including Globus Flow, Globus Auth, Globus Transfer, and Globus Search. This presentation will provide insights into this research partnership, introduce the unique requirements and challenges being addressed and provide relevant project progress.
First Steps with Globus Compute Multi-User EndpointsGlobus
In this presentation we will share our experiences around getting started with the Globus Compute multi-user endpoint. Working with the Pharmacology group at the University of Auckland, we have previously written an application using Globus Compute that can offload computationally expensive steps in the researcher's workflows, which they wish to manage from their familiar Windows environments, onto the NeSI (New Zealand eScience Infrastructure) cluster. Some of the challenges we have encountered were that each researcher had to set up and manage their own single-user globus compute endpoint and that the workloads had varying resource requirements (CPUs, memory and wall time) between different runs. We hope that the multi-user endpoint will help to address these challenges and share an update on our progress here.
Globus Connect Server Deep Dive - GlobusWorld 2024Globus
We explore the Globus Connect Server (GCS) architecture and experiment with advanced configuration options and use cases. This content is targeted at system administrators who are familiar with GCS and currently operate—or are planning to operate—broader deployments at their institution.
Climate Science Flows: Enabling Petabyte-Scale Climate Analysis with the Eart...Globus
The Earth System Grid Federation (ESGF) is a global network of data servers that archives and distributes the planet’s largest collection of Earth system model output for thousands of climate and environmental scientists worldwide. Many of these petabyte-scale data archives are located in proximity to large high-performance computing (HPC) or cloud computing resources, but the primary workflow for data users consists of transferring data, and applying computations on a different system. As a part of the ESGF 2.0 US project (funded by the United States Department of Energy Office of Science), we developed pre-defined data workflows, which can be run on-demand, capable of applying many data reduction and data analysis to the large ESGF data archives, transferring only the resultant analysis (ex. visualizations, smaller data files). In this talk, we will showcase a few of these workflows, highlighting how Globus Flows can be used for petabyte-scale climate analysis.
How to Position Your Globus Data Portal for Success Ten Good PracticesGlobus
Science gateways allow science and engineering communities to access shared data, software, computing services, and instruments. Science gateways have gained a lot of traction in the last twenty years, as evidenced by projects such as the Science Gateways Community Institute (SGCI) and the Center of Excellence on Science Gateways (SGX3) in the US, The Australian Research Data Commons (ARDC) and its platforms in Australia, and the projects around Virtual Research Environments in Europe. A few mature frameworks have evolved with their different strengths and foci and have been taken up by a larger community such as the Globus Data Portal, Hubzero, Tapis, and Galaxy. However, even when gateways are built on successful frameworks, they continue to face the challenges of ongoing maintenance costs and how to meet the ever-expanding needs of the community they serve with enhanced features. It is not uncommon that gateways with compelling use cases are nonetheless unable to get past the prototype phase and become a full production service, or if they do, they don't survive more than a couple of years. While there is no guaranteed pathway to success, it seems likely that for any gateway there is a need for a strong community and/or solid funding streams to create and sustain its success. With over twenty years of examples to draw from, this presentation goes into detail for ten factors common to successful and enduring gateways that effectively serve as best practices for any new or developing gateway.
Accelerate Enterprise Software Engineering with PlatformlessWSO2
Key takeaways:
Challenges of building platforms and the benefits of platformless.
Key principles of platformless, including API-first, cloud-native middleware, platform engineering, and developer experience.
How Choreo enables the platformless experience.
How key concepts like application architecture, domain-driven design, zero trust, and cell-based architecture are inherently a part of Choreo.
Demo of an end-to-end app built and deployed on Choreo.
Providing Globus Services to Users of JASMIN for Environmental Data AnalysisGlobus
JASMIN is the UK’s high-performance data analysis platform for environmental science, operated by STFC on behalf of the UK Natural Environment Research Council (NERC). In addition to its role in hosting the CEDA Archive (NERC’s long-term repository for climate, atmospheric science & Earth observation data in the UK), JASMIN provides a collaborative platform to a community of around 2,000 scientists in the UK and beyond, providing nearly 400 environmental science projects with working space, compute resources and tools to facilitate their work. High-performance data transfer into and out of JASMIN has always been a key feature, with many scientists bringing model outputs from supercomputers elsewhere in the UK, to analyse against observational or other model data in the CEDA Archive. A growing number of JASMIN users are now realising the benefits of using the Globus service to provide reliable and efficient data movement and other tasks in this and other contexts. Further use cases involve long-distance (intercontinental) transfers to and from JASMIN, and collecting results from a mobile atmospheric radar system, pushing data to JASMIN via a lightweight Globus deployment. We provide details of how Globus fits into our current infrastructure, our experience of the recent migration to GCSv5.4, and of our interest in developing use of the wider ecosystem of Globus services for the benefit of our user community.
Navigating the Metaverse: A Journey into Virtual Evolution"Donna Lenk
Join us for an exploration of the Metaverse's evolution, where innovation meets imagination. Discover new dimensions of virtual events, engage with thought-provoking discussions, and witness the transformative power of digital realms."
Understanding Globus Data Transfers with NetSageGlobus
NetSage is an open privacy-aware network measurement, analysis, and visualization service designed to help end-users visualize and reason about large data transfers. NetSage traditionally has used a combination of passive measurements, including SNMP and flow data, as well as active measurements, mainly perfSONAR, to provide longitudinal network performance data visualization. It has been deployed by dozens of networks world wide, and is supported domestically by the Engagement and Performance Operations Center (EPOC), NSF #2328479. We have recently expanded the NetSage data sources to include logs for Globus data transfers, following the same privacy-preserving approach as for Flow data. Using the logs for the Texas Advanced Computing Center (TACC) as an example, this talk will walk through several different example use cases that NetSage can answer, including: Who is using Globus to share data with my institution, and what kind of performance are they able to achieve? How many transfers has Globus supported for us? Which sites are we sharing the most data with, and how is that changing over time? How is my site using Globus to move data internally, and what kind of performance do we see for those transfers? What percentage of data transfers at my institution used Globus, and how did the overall data transfer performance compare to the Globus users?
May Marketo Masterclass, London MUG May 22 2024.pdfAdele Miller
Can't make Adobe Summit in Vegas? No sweat because the EMEA Marketo Engage Champions are coming to London to share their Summit sessions, insights and more!
This is a MUG with a twist you don't want to miss.
Prosigns: Transforming Business with Tailored Technology SolutionsProsigns
Unlocking Business Potential: Tailored Technology Solutions by Prosigns
Discover how Prosigns, a leading technology solutions provider, partners with businesses to drive innovation and success. Our presentation showcases our comprehensive range of services, including custom software development, web and mobile app development, AI & ML solutions, blockchain integration, DevOps services, and Microsoft Dynamics 365 support.
Custom Software Development: Prosigns specializes in creating bespoke software solutions that cater to your unique business needs. Our team of experts works closely with you to understand your requirements and deliver tailor-made software that enhances efficiency and drives growth.
Web and Mobile App Development: From responsive websites to intuitive mobile applications, Prosigns develops cutting-edge solutions that engage users and deliver seamless experiences across devices.
AI & ML Solutions: Harnessing the power of Artificial Intelligence and Machine Learning, Prosigns provides smart solutions that automate processes, provide valuable insights, and drive informed decision-making.
Blockchain Integration: Prosigns offers comprehensive blockchain solutions, including development, integration, and consulting services, enabling businesses to leverage blockchain technology for enhanced security, transparency, and efficiency.
DevOps Services: Prosigns' DevOps services streamline development and operations processes, ensuring faster and more reliable software delivery through automation and continuous integration.
Microsoft Dynamics 365 Support: Prosigns provides comprehensive support and maintenance services for Microsoft Dynamics 365, ensuring your system is always up-to-date, secure, and running smoothly.
Learn how our collaborative approach and dedication to excellence help businesses achieve their goals and stay ahead in today's digital landscape. From concept to deployment, Prosigns is your trusted partner for transforming ideas into reality and unlocking the full potential of your business.
Join us on a journey of innovation and growth. Let's partner for success with Prosigns.
2. Table
“Table is Combination of Rows and Columns,
Which intersect each other and create cell where
user store the value”
Row/Tuple
Column
Cell
Intersect
4. HTML tables allow web developers to
arrange data into rows and columns.
Html table has following element
1. < table > :The <table> tag defines an HTML table.
2. < tr > : Each table row is defined with a <tr> tag
3. < th > / <td> : <td> and <th> tags which defined the
table’s headers and data cells
“Tables are useful for the general display of tabular data”
8. Table Attribute
The table tag begins the process of building a
table. It carries a long list of attributes ,
including
1. Border
2. Bordercolor
3. Width
4. Height
5. BGColor
6. BackGround
7. Frame
8. Rules
9. Align
10. Valign
9. 1. Border Attribute
A table’s border is specified through BORDER
attribute.(Border = size)
<table>
<tr>
<td> Roll No </td>
<td> Name </td>
</tr>
<tr>
<td> 1 </td>
<td> Komal </td>
</tr>
</table>
<table Border = “ 1 ” >
10. 2. BorderColor Attribute
A table’s bordercolor attribute is used to specify the
color of table’s border.(Bordercolor = “Any color”)
<table Border = “ 1 ” >
<tr>
<td> Roll No </td>
<td> Name </td>
</tr>
<tr>
<td> 1 </td>
<td> Komal </td>
</tr>
</table>
<table Border = “ 1 ” Bordercolor = “red”>
11. 3. Width and Height Attribute
The width property specifies the width of an
element, and the height property specifies the
height of an element.
< Table width=“50%” or Height = “50%”>
12. <table Border = “ 1 ” >
<tr>
<td> Roll No </td>
<td> Name </td>
</tr>
<tr>
<td> 1 </td>
<td> Komal </td>
</tr>
</table>
<table Border = “ 1 ” width=“50%” or Height = “50%” >
13. BGColor
We can set background color for whole
table or just for one cell
Syntax
<table
bgcolor="color_name”>
18. Align
Align attribute of Table can positioning
Tables and their contents in relation to other
elements on the Web page.
Align attributes can be set in two levels
1. Table Alignment
2. The alignment of content inside the
Table Cells.
21. Valign
The purpose of the HTML valign attribute is to
define the vertical alignment of the content of a
table cell.
Value Description
top Sets the vertical alignment of cell content top.
middle Sets the vertical alignment of cell content center.
bottom Sets the vertical alignment of cell content bottom.
23. Frame
The frame Attribute is used to specify the visibility of
outside borders.
Syntax
<table frame="value">
24. Attribute Values
void: It is used to hide the outside border.
above: It is used to display the top outside border.
below: It is used to display the bottom outside border.
hsides: It is used to display the top and bottom outside border.
vsides: It is used to display the left and right outside border.
lhs: It is used to display the left outside border.
rhs: It is used to display the right outside border.
box: It is used to display all sides outside border.
border: It is used to display all outside border.
28. Rules
The rules Attribute is used to specify the
which parts of the inside borders that should
be visible.
29. Syntax
<table rules="value">
Attribute Values
•none : It does not create any lines.
•Groups : It create lines between row and column
groups.
•Rows : It creates line between the rows.
•Cols : It creates line between the columns.
•All : It creates line between the rows and
columns.