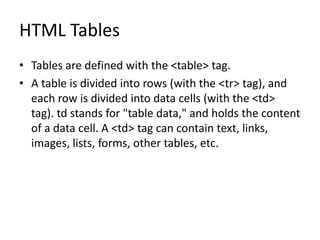
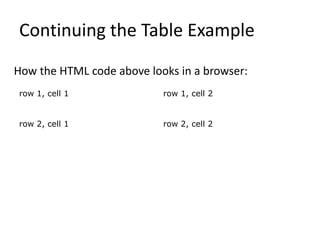
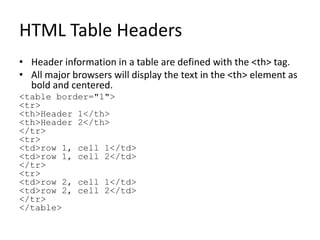
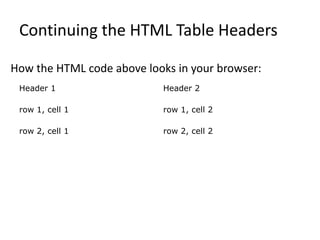
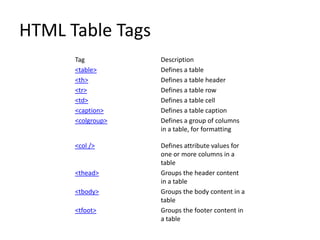
The document discusses HTML tables. It explains that tables are defined with <table> tags and divided into rows with <tr> tags and cells with <td> tags. It provides an example of a simple HTML table with two rows and two cells each and explains how it would appear in a browser. It also discusses using <th> tags for table headers, the border attribute, and common HTML table tags.
This presentation is regarding HTML table.In this it is briefly explained about the HTML table from which we can get good knowledge about how to use Tables in HTML.
Web Visualization with HTML5, CSS3, and JavaScript is the course with the rapidly changing web
development technologies, it has become important to stay in line with them to progress within the industry,
which is why this course in web virtualization has been brought to you to spruce up your web designing and
animating skills using HTML5, CSS3 and JavaScript. The latest features of HTML5, CSS3 and JavaScript is set
to be provided to you through this course, hence, it is desired that you have basic knowledge on these
programming languages for a smoother learning experience.
This course will start off by walking you through the CSS3 virtualization techniques to design and
animate webs. You will be taught how to create a 3D element using CSS transition and to transform animates
into 2D and 3D, along with an insight into the elements of scalable vector graphics which is needed to create basic
images and polygons and to animate.
Our tutors will further take you through the canvas aspects of HTML5 to start drawing grids and
animations using it. You will also get to learn how to create a callback and create and activate a queue that is
needed in animating and the animation libraries that will be essential to your web designing projects. By the end
of this course, you will have an outstanding knowledge of web visualization using HTML5, CSS3 and
JavaScript to secure yourself a prominent place within the web development industry.
HTML tables, table tag, element of a HTML table, attribute of table tag, more tags on table, attributes of <td> tag, example for table tag, adding pictures to table,
Hey friends,
This is the Basic HTML programs very Good for the html beginners i share with you .for more query contact my e-mail address abhi.smarta02@gmail.com
Юзеф Игнаци Крашевский - один из самых плодовитых писателей второй половины 19 в. Обладая разносторонними дарованиями, он был не только писателем, поэтом, драматургом, но и критиком, этнографом, публицистом, издателем, переводил с пяти языков, профессионально занимался музыкой и живописью.
У выніку другога падзелу Рэчы Паспалітай (1793) Беларускія землі канчаткова ўвайшлі ў склад Расійскай імперыі. Указам імператрыцы Кацярыны ІІ 23 красавіка 1793 года была заснавана Мінская губерня ў складзе 13 паветаў. З гэтага часу Мінск - губернскі горад. Прэзентацыя аб гэтым перыядзе ў гісторыі Мінска падрыхтавана супрацоўнікамі аддзела рэдкіх кніг і рукапісаў Цэнтральнай навуковай бібліятэкі НАН Беларусі.
Comics and health education un’opportunità per promuovere la salute Giuseppe Fattori
To teach concepts of primary prevention to a specific target audience such as children, it was decided to use an educational technology which uses comics as a teaching method. With this new teaching method the attention of the student will be held, involved and absorbed by the comic strip, and he will then be informed and “educated” by discovering and acquiring information on everything related to the basic rules of sanitation and proper behaviour. To obtain and use this information is simple.
This is Part 2 of a two-lecture series on implementing HTML. I created this lecture in an effort to keep my design students from "fearing the code" they encounter in an introductory level course to Dreamweaver and Web Site design.
State of ICS and IoT Cyber Threat Landscape Report 2024 previewPrayukth K V
The IoT and OT threat landscape report has been prepared by the Threat Research Team at Sectrio using data from Sectrio, cyber threat intelligence farming facilities spread across over 85 cities around the world. In addition, Sectrio also runs AI-based advanced threat and payload engagement facilities that serve as sinks to attract and engage sophisticated threat actors, and newer malware including new variants and latent threats that are at an earlier stage of development.
The latest edition of the OT/ICS and IoT security Threat Landscape Report 2024 also covers:
State of global ICS asset and network exposure
Sectoral targets and attacks as well as the cost of ransom
Global APT activity, AI usage, actor and tactic profiles, and implications
Rise in volumes of AI-powered cyberattacks
Major cyber events in 2024
Malware and malicious payload trends
Cyberattack types and targets
Vulnerability exploit attempts on CVEs
Attacks on counties – USA
Expansion of bot farms – how, where, and why
In-depth analysis of the cyber threat landscape across North America, South America, Europe, APAC, and the Middle East
Why are attacks on smart factories rising?
Cyber risk predictions
Axis of attacks – Europe
Systemic attacks in the Middle East
Download the full report from here:
https://sectrio.com/resources/ot-threat-landscape-reports/sectrio-releases-ot-ics-and-iot-security-threat-landscape-report-2024/
Accelerate your Kubernetes clusters with Varnish CachingThijs Feryn
A presentation about the usage and availability of Varnish on Kubernetes. This talk explores the capabilities of Varnish caching and shows how to use the Varnish Helm chart to deploy it to Kubernetes.
This presentation was delivered at K8SUG Singapore. See https://feryn.eu/presentations/accelerate-your-kubernetes-clusters-with-varnish-caching-k8sug-singapore-28-2024 for more details.
Kubernetes & AI - Beauty and the Beast !?! @KCD Istanbul 2024Tobias Schneck
As AI technology is pushing into IT I was wondering myself, as an “infrastructure container kubernetes guy”, how get this fancy AI technology get managed from an infrastructure operational view? Is it possible to apply our lovely cloud native principals as well? What benefit’s both technologies could bring to each other?
Let me take this questions and provide you a short journey through existing deployment models and use cases for AI software. On practical examples, we discuss what cloud/on-premise strategy we may need for applying it to our own infrastructure to get it to work from an enterprise perspective. I want to give an overview about infrastructure requirements and technologies, what could be beneficial or limiting your AI use cases in an enterprise environment. An interactive Demo will give you some insides, what approaches I got already working for real.
Neuro-symbolic is not enough, we need neuro-*semantic*Frank van Harmelen
Neuro-symbolic (NeSy) AI is on the rise. However, simply machine learning on just any symbolic structure is not sufficient to really harvest the gains of NeSy. These will only be gained when the symbolic structures have an actual semantics. I give an operational definition of semantics as “predictable inference”.
All of this illustrated with link prediction over knowledge graphs, but the argument is general.
Connector Corner: Automate dynamic content and events by pushing a buttonDianaGray10
Here is something new! In our next Connector Corner webinar, we will demonstrate how you can use a single workflow to:
Create a campaign using Mailchimp with merge tags/fields
Send an interactive Slack channel message (using buttons)
Have the message received by managers and peers along with a test email for review
But there’s more:
In a second workflow supporting the same use case, you’ll see:
Your campaign sent to target colleagues for approval
If the “Approve” button is clicked, a Jira/Zendesk ticket is created for the marketing design team
But—if the “Reject” button is pushed, colleagues will be alerted via Slack message
Join us to learn more about this new, human-in-the-loop capability, brought to you by Integration Service connectors.
And...
Speakers:
Akshay Agnihotri, Product Manager
Charlie Greenberg, Host
Transcript: Selling digital books in 2024: Insights from industry leaders - T...BookNet Canada
The publishing industry has been selling digital audiobooks and ebooks for over a decade and has found its groove. What’s changed? What has stayed the same? Where do we go from here? Join a group of leading sales peers from across the industry for a conversation about the lessons learned since the popularization of digital books, best practices, digital book supply chain management, and more.
Link to video recording: https://bnctechforum.ca/sessions/selling-digital-books-in-2024-insights-from-industry-leaders/
Presented by BookNet Canada on May 28, 2024, with support from the Department of Canadian Heritage.
DevOps and Testing slides at DASA ConnectKari Kakkonen
My and Rik Marselis slides at 30.5.2024 DASA Connect conference. We discuss about what is testing, then what is agile testing and finally what is Testing in DevOps. Finally we had lovely workshop with the participants trying to find out different ways to think about quality and testing in different parts of the DevOps infinity loop.
LF Energy Webinar: Electrical Grid Modelling and Simulation Through PowSyBl -...DanBrown980551
Do you want to learn how to model and simulate an electrical network from scratch in under an hour?
Then welcome to this PowSyBl workshop, hosted by Rte, the French Transmission System Operator (TSO)!
During the webinar, you will discover the PowSyBl ecosystem as well as handle and study an electrical network through an interactive Python notebook.
PowSyBl is an open source project hosted by LF Energy, which offers a comprehensive set of features for electrical grid modelling and simulation. Among other advanced features, PowSyBl provides:
- A fully editable and extendable library for grid component modelling;
- Visualization tools to display your network;
- Grid simulation tools, such as power flows, security analyses (with or without remedial actions) and sensitivity analyses;
The framework is mostly written in Java, with a Python binding so that Python developers can access PowSyBl functionalities as well.
What you will learn during the webinar:
- For beginners: discover PowSyBl's functionalities through a quick general presentation and the notebook, without needing any expert coding skills;
- For advanced developers: master the skills to efficiently apply PowSyBl functionalities to your real-world scenarios.
GraphRAG is All You need? LLM & Knowledge GraphGuy Korland
Guy Korland, CEO and Co-founder of FalkorDB, will review two articles on the integration of language models with knowledge graphs.
1. Unifying Large Language Models and Knowledge Graphs: A Roadmap.
https://arxiv.org/abs/2306.08302
2. Microsoft Research's GraphRAG paper and a review paper on various uses of knowledge graphs:
https://www.microsoft.com/en-us/research/blog/graphrag-unlocking-llm-discovery-on-narrative-private-data/
Software Delivery At the Speed of AI: Inflectra Invests In AI-Powered QualityInflectra
In this insightful webinar, Inflectra explores how artificial intelligence (AI) is transforming software development and testing. Discover how AI-powered tools are revolutionizing every stage of the software development lifecycle (SDLC), from design and prototyping to testing, deployment, and monitoring.
Learn about:
• The Future of Testing: How AI is shifting testing towards verification, analysis, and higher-level skills, while reducing repetitive tasks.
• Test Automation: How AI-powered test case generation, optimization, and self-healing tests are making testing more efficient and effective.
• Visual Testing: Explore the emerging capabilities of AI in visual testing and how it's set to revolutionize UI verification.
• Inflectra's AI Solutions: See demonstrations of Inflectra's cutting-edge AI tools like the ChatGPT plugin and Azure Open AI platform, designed to streamline your testing process.
Whether you're a developer, tester, or QA professional, this webinar will give you valuable insights into how AI is shaping the future of software delivery.
Epistemic Interaction - tuning interfaces to provide information for AI supportAlan Dix
Paper presented at SYNERGY workshop at AVI 2024, Genoa, Italy. 3rd June 2024
https://alandix.com/academic/papers/synergy2024-epistemic/
As machine learning integrates deeper into human-computer interactions, the concept of epistemic interaction emerges, aiming to refine these interactions to enhance system adaptability. This approach encourages minor, intentional adjustments in user behaviour to enrich the data available for system learning. This paper introduces epistemic interaction within the context of human-system communication, illustrating how deliberate interaction design can improve system understanding and adaptation. Through concrete examples, we demonstrate the potential of epistemic interaction to significantly advance human-computer interaction by leveraging intuitive human communication strategies to inform system design and functionality, offering a novel pathway for enriching user-system engagements.
3. HTML Tables
• Tables are defined with the <table> tag.
• A table is divided into rows (with the <tr> tag), and
each row is divided into data cells (with the <td>
tag). td stands for "table data," and holds the content
of a data cell. A <td> tag can contain text, links,
images, lists, forms, other tables, etc.
5. Continuing the Table Example
How the HTML code above looks in a browser:
row 1, cell 1 row 1, cell 2
row 2, cell 1 row 2, cell 2
6. HTML Tables and the Border Attribute
• If you do not specify a border attribute, the table will
be displayed without borders. Sometimes this can be
useful, but most of the time, we want the borders to
show.
• To display a table with borders, specify the border
attribute:
<table border="1">
<tr>
<td>Row 1, cell 1</td>
<td>Row 1, cell 2</td>
</tr>
</table>
7. HTML Table Headers
• Header information in a table are defined with the <th> tag.
• All major browsers will display the text in the <th> element as
bold and centered.
<table border="1">
<tr>
<th>Header 1</th>
<th>Header 2</th>
</tr>
<tr>
<td>row 1, cell 1</td>
<td>row 1, cell 2</td>
</tr>
<tr>
<td>row 2, cell 1</td>
<td>row 2, cell 2</td>
</tr>
</table>
8. Continuing the HTML Table Headers
How the HTML code above looks in your browser:
Header 1 Header 2
row 1, cell 1 row 1, cell 2
row 2, cell 1 row 2, cell 2
9. HTML Table Tags
Tag Description
<table> Defines a table
<th> Defines a table header
<tr> Defines a table row
<td> Defines a table cell
<caption> Defines a table caption
<colgroup> Defines a group of columns
in a table, for formatting
<col /> Defines attribute values for
one or more columns in a
table
<thead> Groups the header content
in a table
<tbody> Groups the body content in a
table
<tfoot> Groups the footer content in
a table