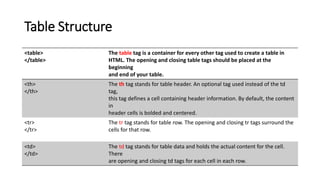
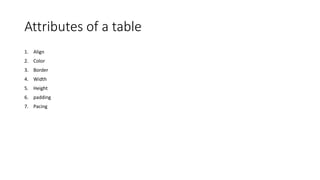
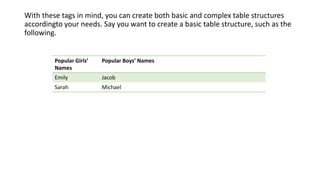
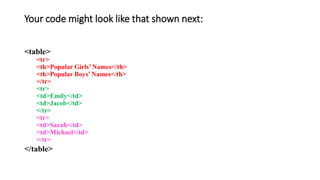
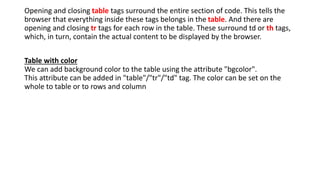
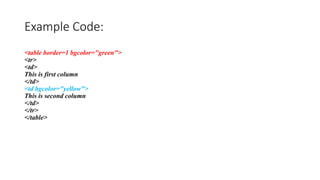
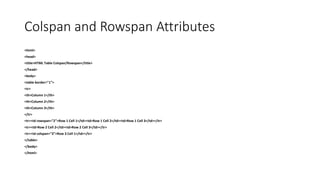
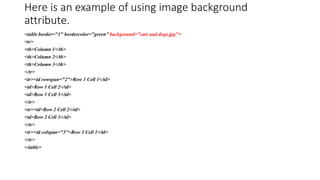
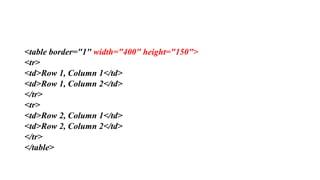
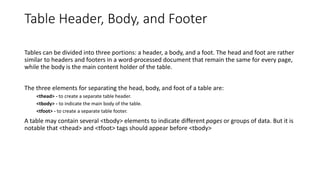
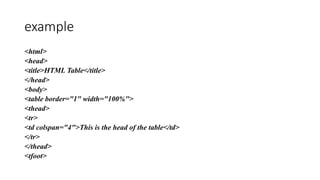
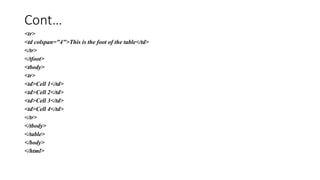
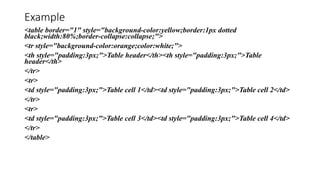
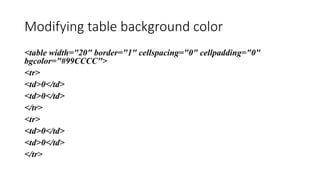
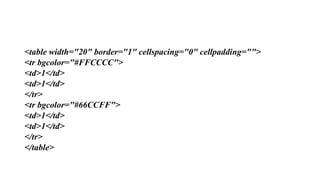
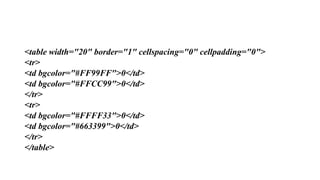
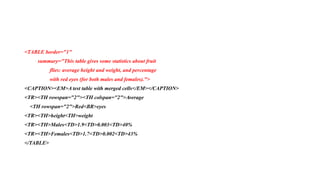
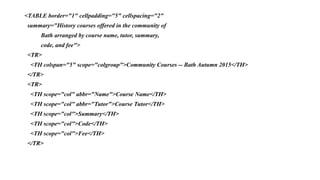
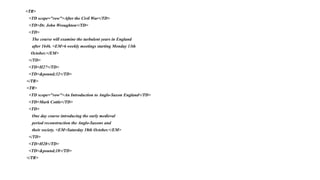
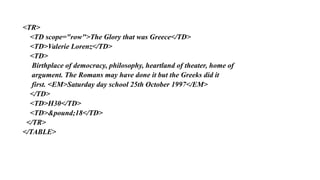
The document provides information on HTML table structure and formatting. It describes the basic table tags (<table>, <tr>, <th>, <td>), attributes that can be applied to tables (align, color, border, width, height, padding), and more advanced formatting options like colspan, rowspan, thead, tbody, tfoot. It also discusses using CSS to style tables and creating nested tables within table cells. The overall purpose is to teach the reader how to properly structure and format HTML tables.
Web Visualization with HTML5, CSS3, and JavaScript is the course with the rapidly changing web
development technologies, it has become important to stay in line with them to progress within the industry,
which is why this course in web virtualization has been brought to you to spruce up your web designing and
animating skills using HTML5, CSS3 and JavaScript. The latest features of HTML5, CSS3 and JavaScript is set
to be provided to you through this course, hence, it is desired that you have basic knowledge on these
programming languages for a smoother learning experience.
This course will start off by walking you through the CSS3 virtualization techniques to design and
animate webs. You will be taught how to create a 3D element using CSS transition and to transform animates
into 2D and 3D, along with an insight into the elements of scalable vector graphics which is needed to create basic
images and polygons and to animate.
Our tutors will further take you through the canvas aspects of HTML5 to start drawing grids and
animations using it. You will also get to learn how to create a callback and create and activate a queue that is
needed in animating and the animation libraries that will be essential to your web designing projects. By the end
of this course, you will have an outstanding knowledge of web visualization using HTML5, CSS3 and
JavaScript to secure yourself a prominent place within the web development industry.
This presentation is regarding HTML table.In this it is briefly explained about the HTML table from which we can get good knowledge about how to use Tables in HTML.
HTML tables, table tag, element of a HTML table, attribute of table tag, more tags on table, attributes of <td> tag, example for table tag, adding pictures to table,
This is Part 2 of a two-lecture series on implementing HTML. I created this lecture in an effort to keep my design students from "fearing the code" they encounter in an introductory level course to Dreamweaver and Web Site design.
Std 10 Computer Chapter 4 List and Table Handling in HTML (Part 2 Table in HTML)Nuzhat Memon
Std 10 Computer Chapter 4 List and Table Handling in HTML (Part 2 Table in HTML) by Nuzhat Memon
Table in HTML
Four tags in Table (<table>, <tr>, <th> and <td>)
Attributes of table tag
Cellpadding and cellspacing
Attribute of tr tag
align attribute
valign attribute
Attribute of th and td tag
rowspan in table and colspan in table
nowrap in table
height and width of the table
caption to table
As Europe's leading economic powerhouse and the fourth-largest hashtag#economy globally, Germany stands at the forefront of innovation and industrial might. Renowned for its precision engineering and high-tech sectors, Germany's economic structure is heavily supported by a robust service industry, accounting for approximately 68% of its GDP. This economic clout and strategic geopolitical stance position Germany as a focal point in the global cyber threat landscape.
In the face of escalating global tensions, particularly those emanating from geopolitical disputes with nations like hashtag#Russia and hashtag#China, hashtag#Germany has witnessed a significant uptick in targeted cyber operations. Our analysis indicates a marked increase in hashtag#cyberattack sophistication aimed at critical infrastructure and key industrial sectors. These attacks range from ransomware campaigns to hashtag#AdvancedPersistentThreats (hashtag#APTs), threatening national security and business integrity.
🔑 Key findings include:
🔍 Increased frequency and complexity of cyber threats.
🔍 Escalation of state-sponsored and criminally motivated cyber operations.
🔍 Active dark web exchanges of malicious tools and tactics.
Our comprehensive report delves into these challenges, using a blend of open-source and proprietary data collection techniques. By monitoring activity on critical networks and analyzing attack patterns, our team provides a detailed overview of the threats facing German entities.
This report aims to equip stakeholders across public and private sectors with the knowledge to enhance their defensive strategies, reduce exposure to cyber risks, and reinforce Germany's resilience against cyber threats.
Explore our comprehensive data analysis project presentation on predicting product ad campaign performance. Learn how data-driven insights can optimize your marketing strategies and enhance campaign effectiveness. Perfect for professionals and students looking to understand the power of data analysis in advertising. for more details visit: https://bostoninstituteofanalytics.org/data-science-and-artificial-intelligence/
Data Centers - Striving Within A Narrow Range - Research Report - MCG - May 2...pchutichetpong
M Capital Group (“MCG”) expects to see demand and the changing evolution of supply, facilitated through institutional investment rotation out of offices and into work from home (“WFH”), while the ever-expanding need for data storage as global internet usage expands, with experts predicting 5.3 billion users by 2023. These market factors will be underpinned by technological changes, such as progressing cloud services and edge sites, allowing the industry to see strong expected annual growth of 13% over the next 4 years.
Whilst competitive headwinds remain, represented through the recent second bankruptcy filing of Sungard, which blames “COVID-19 and other macroeconomic trends including delayed customer spending decisions, insourcing and reductions in IT spending, energy inflation and reduction in demand for certain services”, the industry has seen key adjustments, where MCG believes that engineering cost management and technological innovation will be paramount to success.
MCG reports that the more favorable market conditions expected over the next few years, helped by the winding down of pandemic restrictions and a hybrid working environment will be driving market momentum forward. The continuous injection of capital by alternative investment firms, as well as the growing infrastructural investment from cloud service providers and social media companies, whose revenues are expected to grow over 3.6x larger by value in 2026, will likely help propel center provision and innovation. These factors paint a promising picture for the industry players that offset rising input costs and adapt to new technologies.
According to M Capital Group: “Specifically, the long-term cost-saving opportunities available from the rise of remote managing will likely aid value growth for the industry. Through margin optimization and further availability of capital for reinvestment, strong players will maintain their competitive foothold, while weaker players exit the market to balance supply and demand.”
Levelwise PageRank with Loop-Based Dead End Handling Strategy : SHORT REPORT ...Subhajit Sahu
Abstract — Levelwise PageRank is an alternative method of PageRank computation which decomposes the input graph into a directed acyclic block-graph of strongly connected components, and processes them in topological order, one level at a time. This enables calculation for ranks in a distributed fashion without per-iteration communication, unlike the standard method where all vertices are processed in each iteration. It however comes with a precondition of the absence of dead ends in the input graph. Here, the native non-distributed performance of Levelwise PageRank was compared against Monolithic PageRank on a CPU as well as a GPU. To ensure a fair comparison, Monolithic PageRank was also performed on a graph where vertices were split by components. Results indicate that Levelwise PageRank is about as fast as Monolithic PageRank on the CPU, but quite a bit slower on the GPU. Slowdown on the GPU is likely caused by a large submission of small workloads, and expected to be non-issue when the computation is performed on massive graphs.
Techniques to optimize the pagerank algorithm usually fall in two categories. One is to try reducing the work per iteration, and the other is to try reducing the number of iterations. These goals are often at odds with one another. Skipping computation on vertices which have already converged has the potential to save iteration time. Skipping in-identical vertices, with the same in-links, helps reduce duplicate computations and thus could help reduce iteration time. Road networks often have chains which can be short-circuited before pagerank computation to improve performance. Final ranks of chain nodes can be easily calculated. This could reduce both the iteration time, and the number of iterations. If a graph has no dangling nodes, pagerank of each strongly connected component can be computed in topological order. This could help reduce the iteration time, no. of iterations, and also enable multi-iteration concurrency in pagerank computation. The combination of all of the above methods is the STICD algorithm. [sticd] For dynamic graphs, unchanged components whose ranks are unaffected can be skipped altogether.
2. A table is a data structure that organizes information into rows and columns. It can be used to both
store and display data in a structured format. For example, databases store data in tables so that
information can be quickly accessed from specific rows.
3. Table Structure
<table>
</table>
The table tag is a container for every other tag used to create a table in
HTML. The opening and closing table tags should be placed at the
beginning
and end of your table.
<th>
</th>
The th tag stands for table header. An optional tag used instead of the td
tag,
this tag defines a cell containing header information. By default, the content
in
header cells is bolded and centered.
<tr>
</tr>
The tr tag stands for table row. The opening and closing tr tags surround the
cells for that row.
<td>
</td>
The td tag stands for table data and holds the actual content for the cell.
There
are opening and closing td tags for each cell in each row.
4. Attributes of a table
1. Align
2. Color
3. Border
4. Width
5. Height
6. padding
7. Pacing
5. With these tags in mind, you can create both basic and complex table structures
accordingto your needs. Say you want to create a basic table structure, such as the
following.
Popular Girls’
Names
Popular Boys’ Names
Emily Jacob
Sarah Michael
6. Your code might look like that shown next:
<table>
<tr>
<th>Popular Girls’ Names</th>
<th>Popular Boys’ Names</th>
</tr>
<tr>
<td>Emily</td>
<td>Jacob</td>
</tr>
<tr>
<td>Sarah</td>
<td>Michael</td>
</tr>
</table>
7. Opening and closing table tags surround the entire section of code. This tells the
browser that everything inside these tags belongs in the table. And there are
opening and closing tr tags for each row in the table. These surround td or th tags,
which, in turn, contain the actual content to be displayed by the browser.
Table with color
We can add background color to the table using the attribute "bgcolor".
This attribute can be added in "table"/"tr"/"td" tag. The color can be set on the
whole to table or to rows and column
8. Example Code:
<table border=1 bgcolor="green">
<tr>
<td>
This is first column
</td>
<td bgcolor="yellow">
This is second column
</td>
</tr>
</table>
9. CAPTION
<CAPTION> and </CAPTION> places a caption over your table. The caption will be bolded and
centered. Okay, it's a pretty dull caption. Use it if you'd like or feel free to forget it right here. I just
thought I'd show it to you. Heck, you're here aren't you?
10. Cellpadding and Cellspacing Attributes
There are two attributes called cellpadding and cellspacing which you will use to adjust the white
space in your table cells. The cellspacing attribute defines the width of the border, while cellpadding
represents the distance between cell borders and the content within a cell.
12. Colspan and Rowspan Attributes
You will use colspan attribute if you want to merge two or more
columns into a single column. Similar way you will use rowspan if you
want to merge two or more rows.
14. Here is an example of using image background
attribute.
<table border="1" bordercolor="green" background="cats and dogs.jpg">
<tr>
<th>Column 1</th>
<th>Column 2</th>
<th>Column 3</th>
</tr>
<tr><td rowspan="2">Row 1 Cell 1</td>
<td>Row 1 Cell 2</td>
<td>Row 1 Cell 3</td>
</tr>
<tr><td>Row 2 Cell 2</td>
<td>Row 2 Cell 3</td>
</tr>
<tr><td colspan="3">Row 3 Cell 1</td>
</tr>
</table>
15. Table Height and Width
You can set a table width and height using width and height attributes.
You can specify table width or height in terms of pixels or in terms of
percentage of available screen area
17. Table Header, Body, and Footer
Tables can be divided into three portions: a header, a body, and a foot. The head and foot are rather
similar to headers and footers in a word-processed document that remain the same for every page,
while the body is the main content holder of the table.
The three elements for separating the head, body, and foot of a table are:
<thead> - to create a separate table header.
<tbody> - to indicate the main body of the table.
<tfoot> - to create a separate table footer.
A table may contain several <tbody> elements to indicate different pages or groups of data. But it is
notable that <thead> and <tfoot> tags should appear before <tbody>
19. Cont…
<tr>
<td colspan="4">This is the foot of the table</td>
</tr>
</tfoot>
<tbody>
<tr>
<td>Cell 1</td>
<td>Cell 2</td>
<td>Cell 3</td>
<td>Cell 4</td>
</tr>
</tbody>
</table>
</body>
</html>
20. Adding CSS to tables
You can format your tables using Cascading Style Sheets (CSS). Using
CSS, you can specify background colors, border colors, border styles
etc.
25. <TABLE border="1"
summary="This table gives some statistics about fruit
flies: average height and weight, and percentage
with red eyes (for both males and females).">
<CAPTION><EM>A test table with merged cells</EM></CAPTION>
<TR><TH rowspan="2"><TH colspan="2">Average
<TH rowspan="2">Red<BR>eyes
<TR><TH>height<TH>weight
<TR><TH>Males<TD>1.9<TD>0.003<TD>40%
<TR><TH>Females<TD>1.7<TD>0.002<TD>43%
</TABLE>
26. <TABLE border="1" cellpadding="5" cellspacing="2"
summary="History courses offered in the community of
Bath arranged by course name, tutor, summary,
code, and fee">
<TR>
<TH colspan="5" scope="colgroup">Community Courses -- Bath Autumn 2015</TH>
</TR>
<TR>
<TH scope="col" abbr="Name">Course Name</TH>
<TH scope="col" abbr="Tutor">Course Tutor</TH>
<TH scope="col">Summary</TH>
<TH scope="col">Code</TH>
<TH scope="col">Fee</TH>
</TR>
27. <TR>
<TD scope="row">After the Civil War</TD>
<TD>Dr. John Wroughton</TD>
<TD>
The course will examine the turbulent years in England
after 1646. <EM>6 weekly meetings starting Monday 13th
October.</EM>
</TD>
<TD>H27</TD>
<TD>£32</TD>
</TR>
<TR>
<TD scope="row">An Introduction to Anglo-Saxon England</TD>
<TD>Mark Cottle</TD>
<TD>
One day course introducing the early medieval
period reconstruction the Anglo-Saxons and
their society. <EM>Saturday 18th October.</EM>
</TD>
<TD>H28</TD>
<TD>£18</TD>
</TR>
28. <TR>
<TD scope="row">The Glory that was Greece</TD>
<TD>Valerie Lorenz</TD>
<TD>
Birthplace of democracy, philosophy, heartland of theater, home of
argument. The Romans may have done it but the Greeks did it
first. <EM>Saturday day school 25th October 1997</EM>
</TD>
<TD>H30</TD>
<TD>£18</TD>
</TR>
</TABLE>
29. Inner Tables
a) How to create tables inside table columns?
b) How to control space between table cells?
30. Table inside table
Many a times we will be using table inside tables Now we will create two row with three columns.
The 2nd row, 2nd column will be split again to a table with two rows, two cols. Also we will be using
the attributes cellpadding and cellspacing to handle table space.