Download as PDF, PPTX


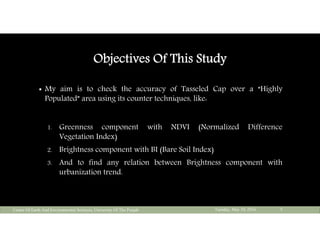
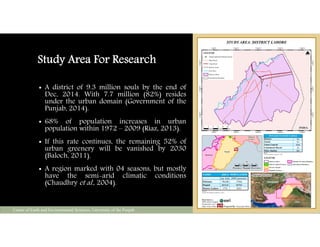

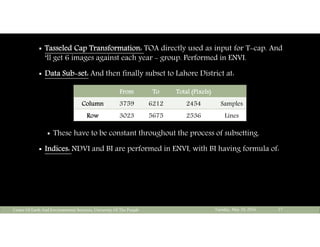

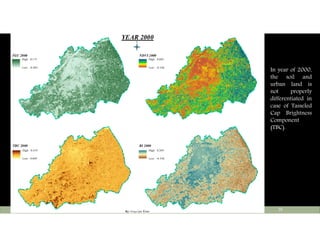
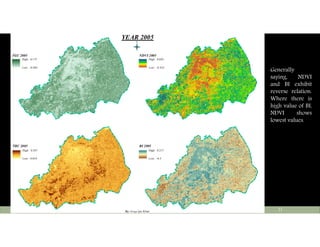
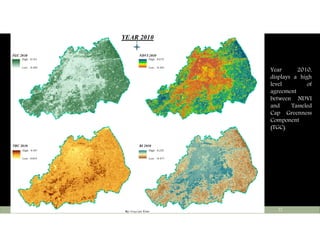
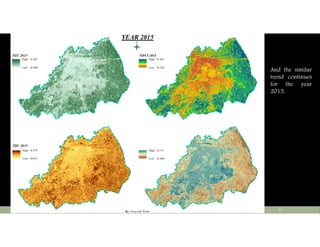
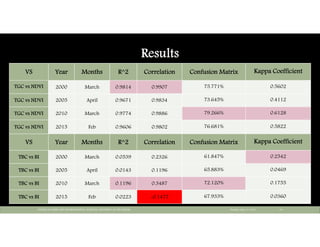
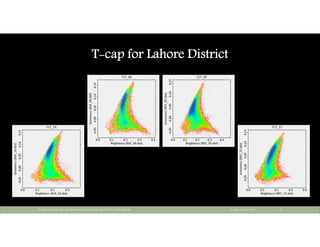
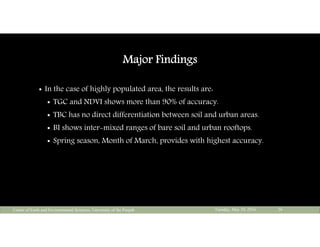
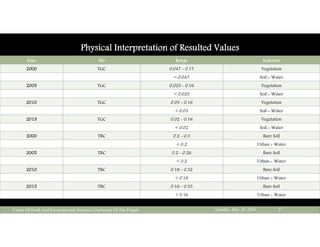
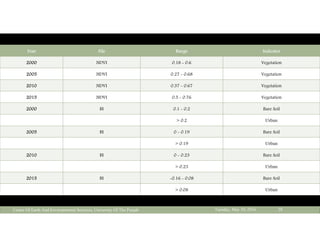
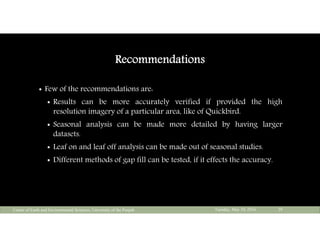


The document presents an M.Phil. thesis defense on the application of the Tasseled Cap Transformation (TCT) for remote sensing change detection in Lahore District, Pakistan. The study aims to assess the accuracy of TCT in a highly populated area and evaluates its correlation with various indices such as NDVI and BI over different years. Key findings indicate that TCT shows high accuracy for NDVI, but has limited differentiation between soil and urban areas, with recommendations for improved analysis through high-resolution imagery and larger datasets.