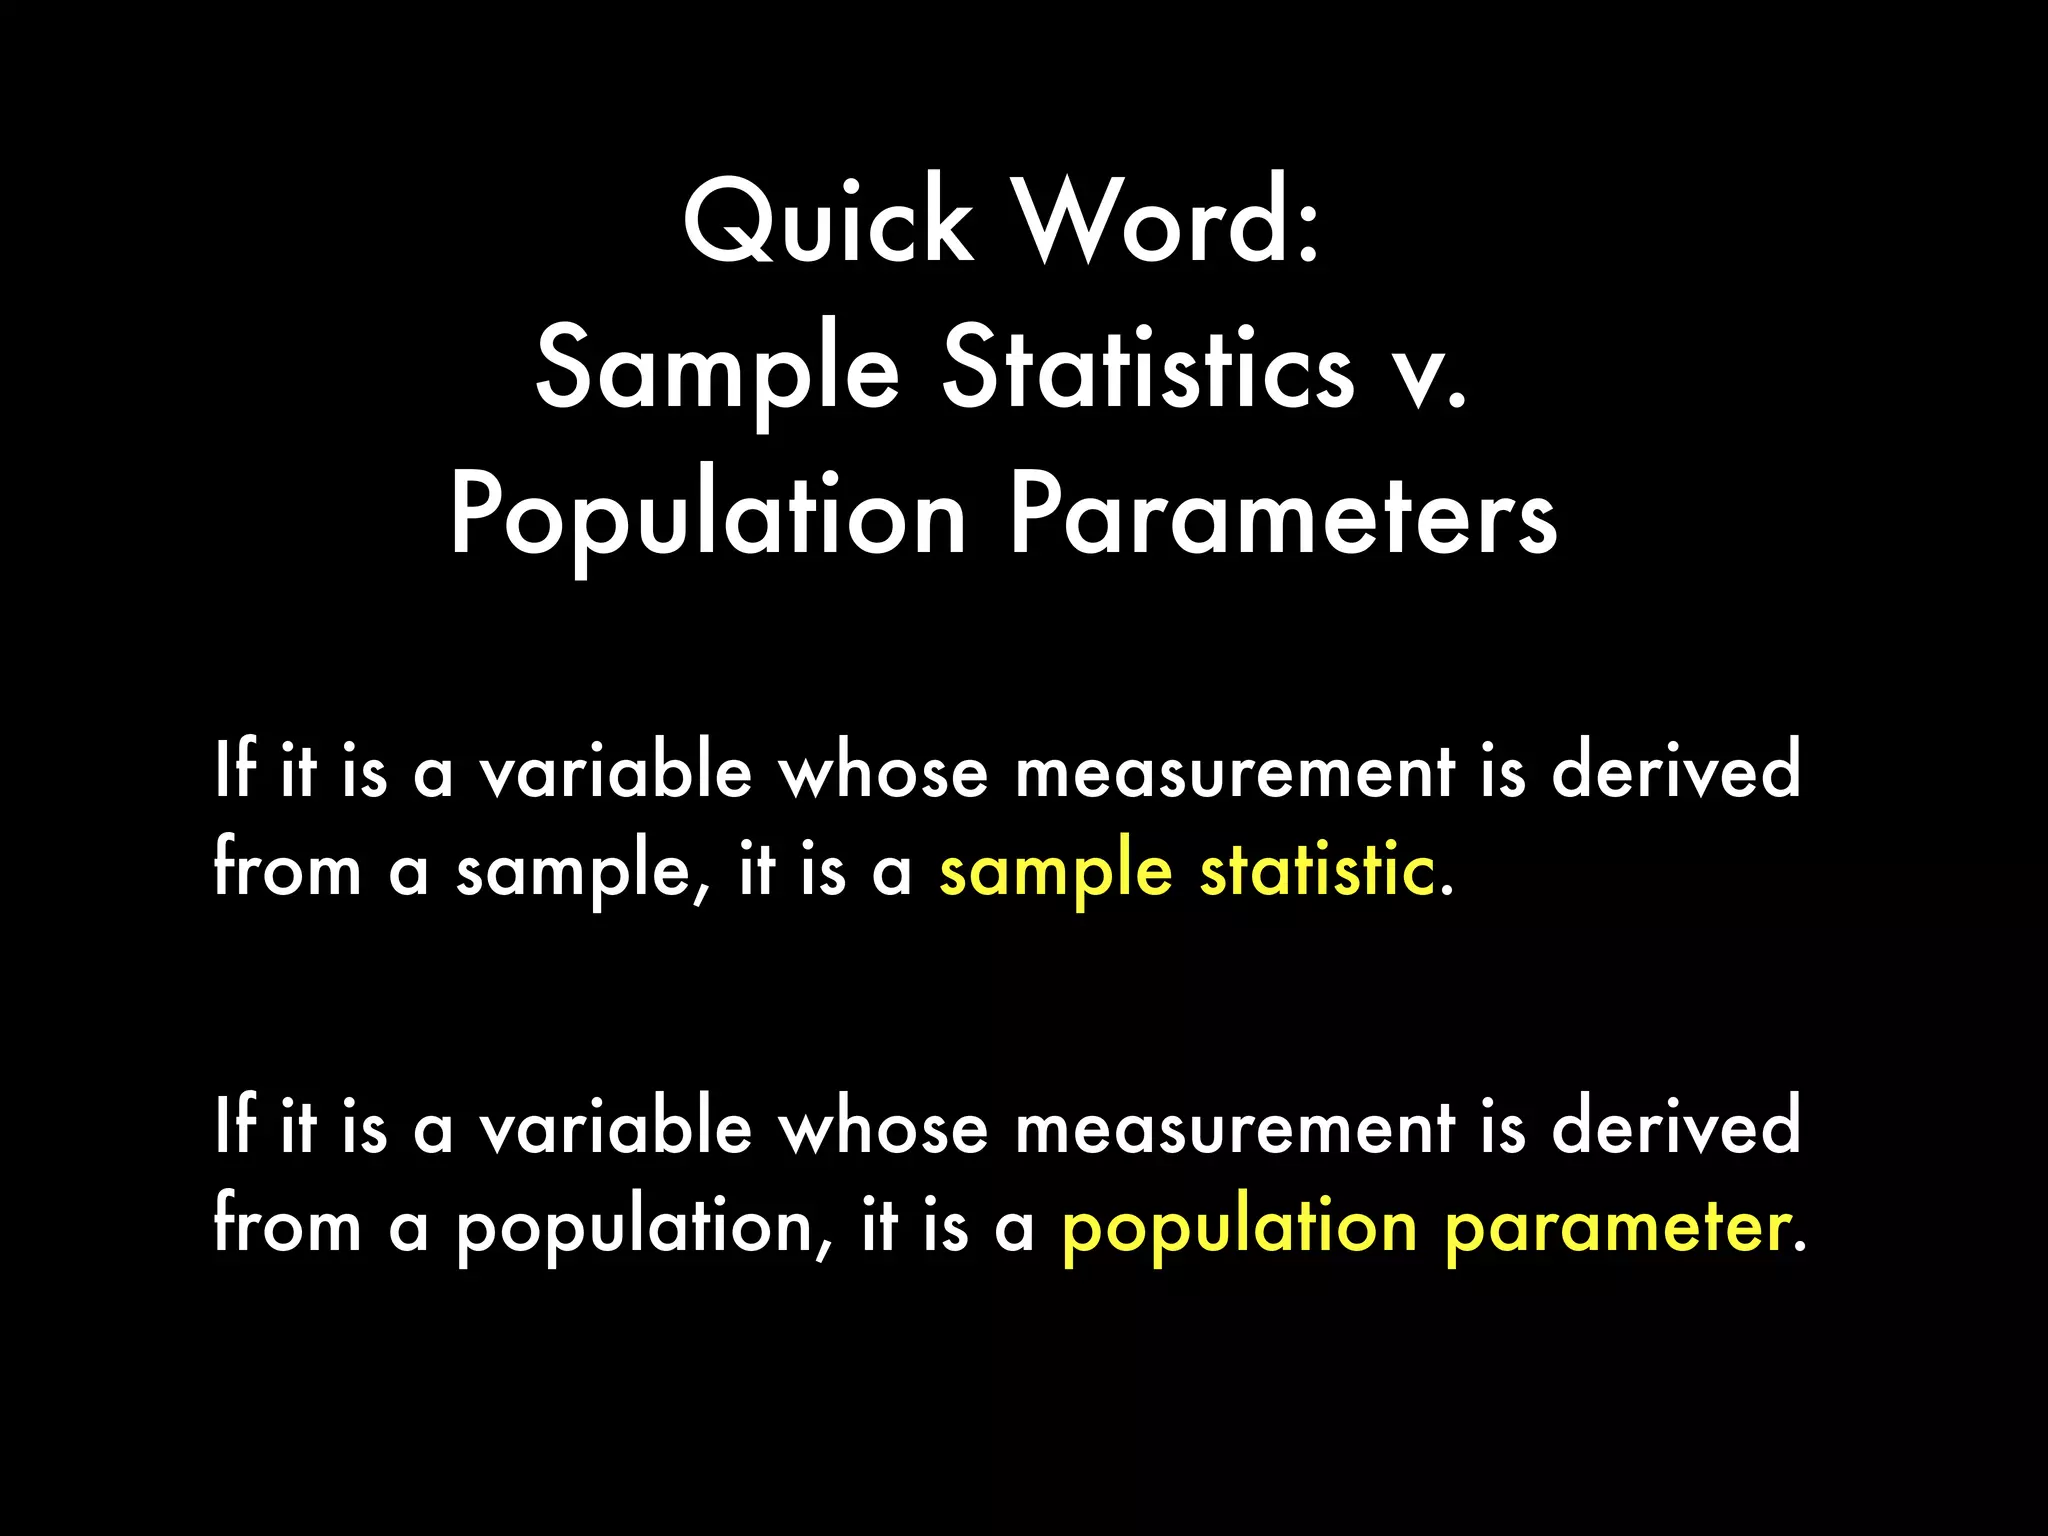
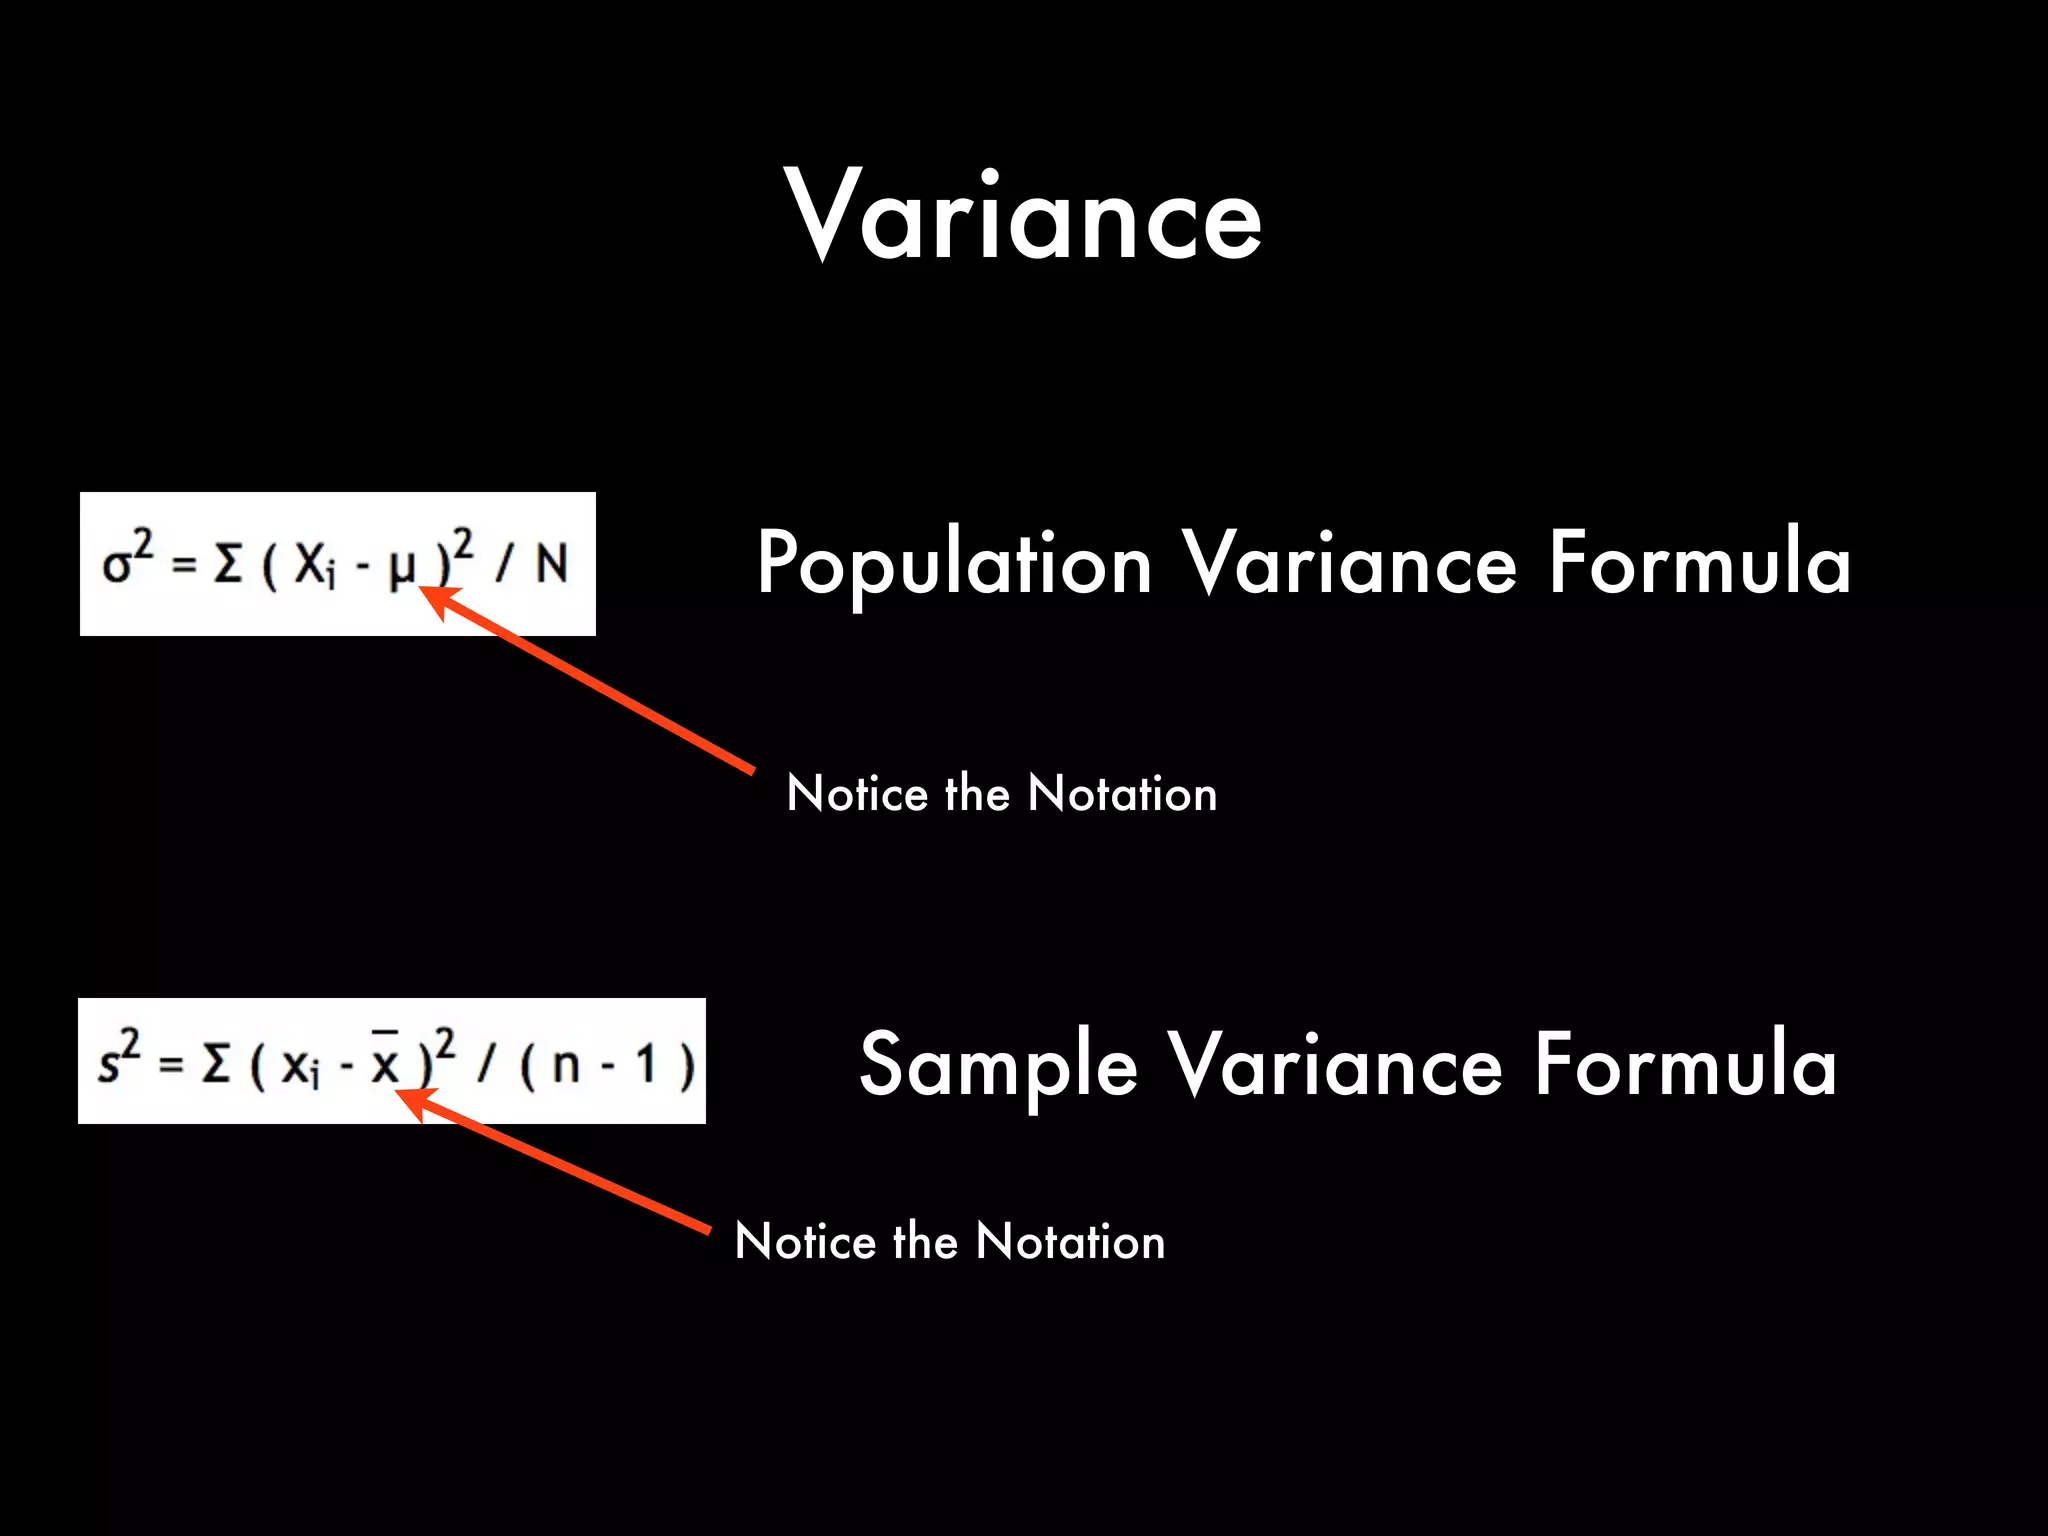
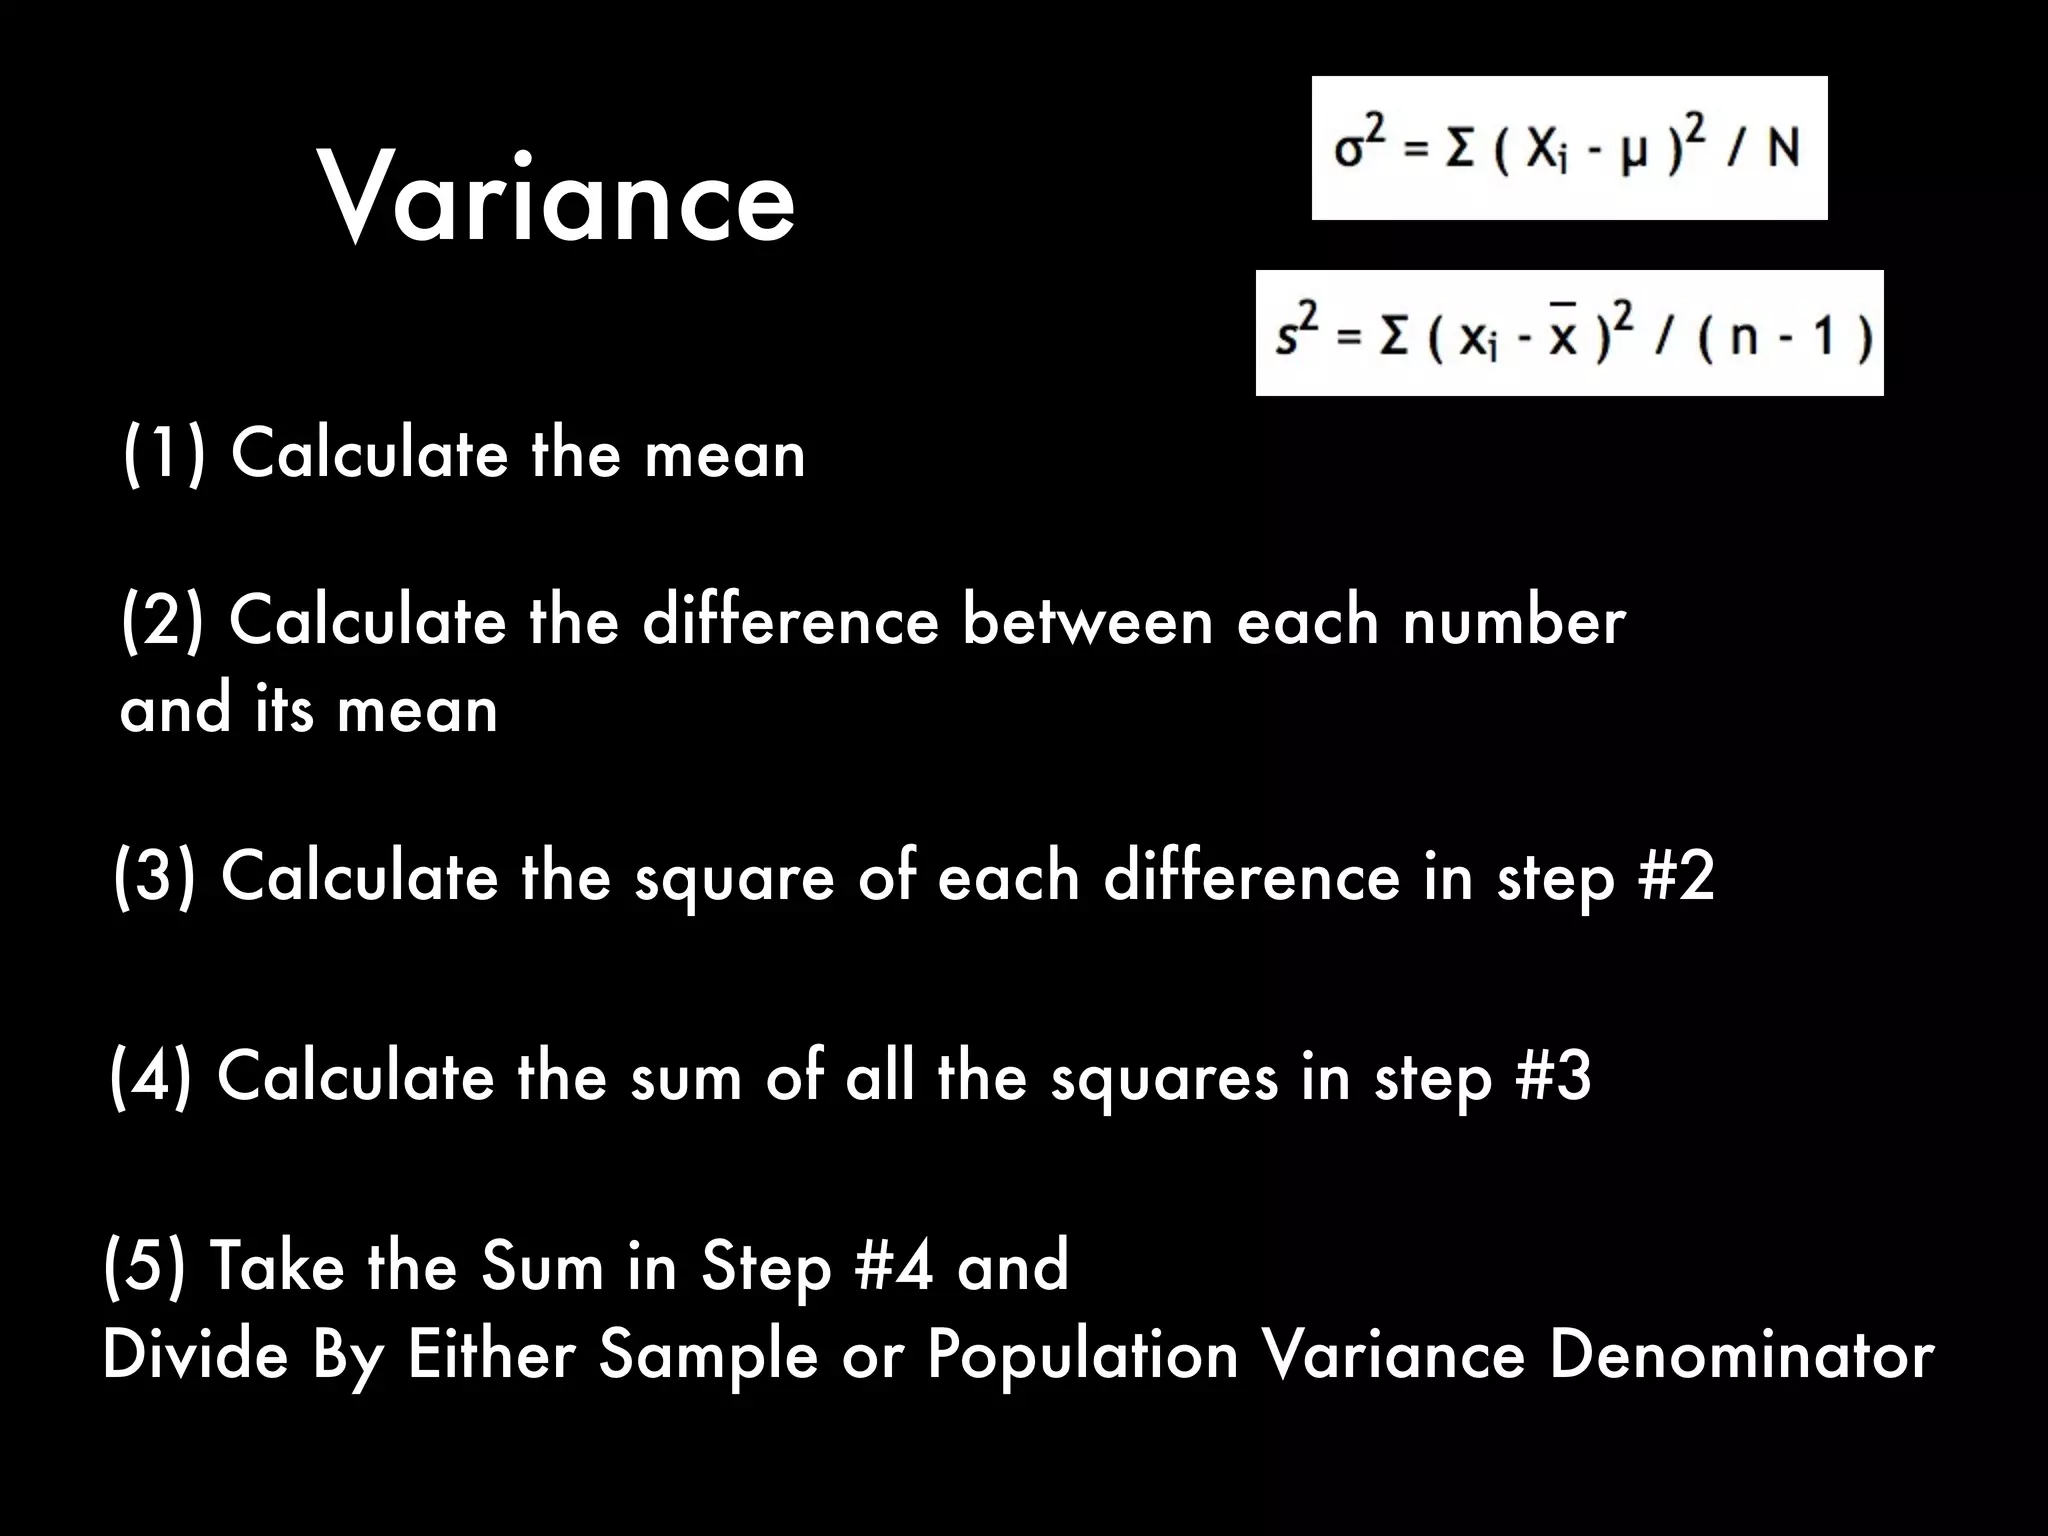
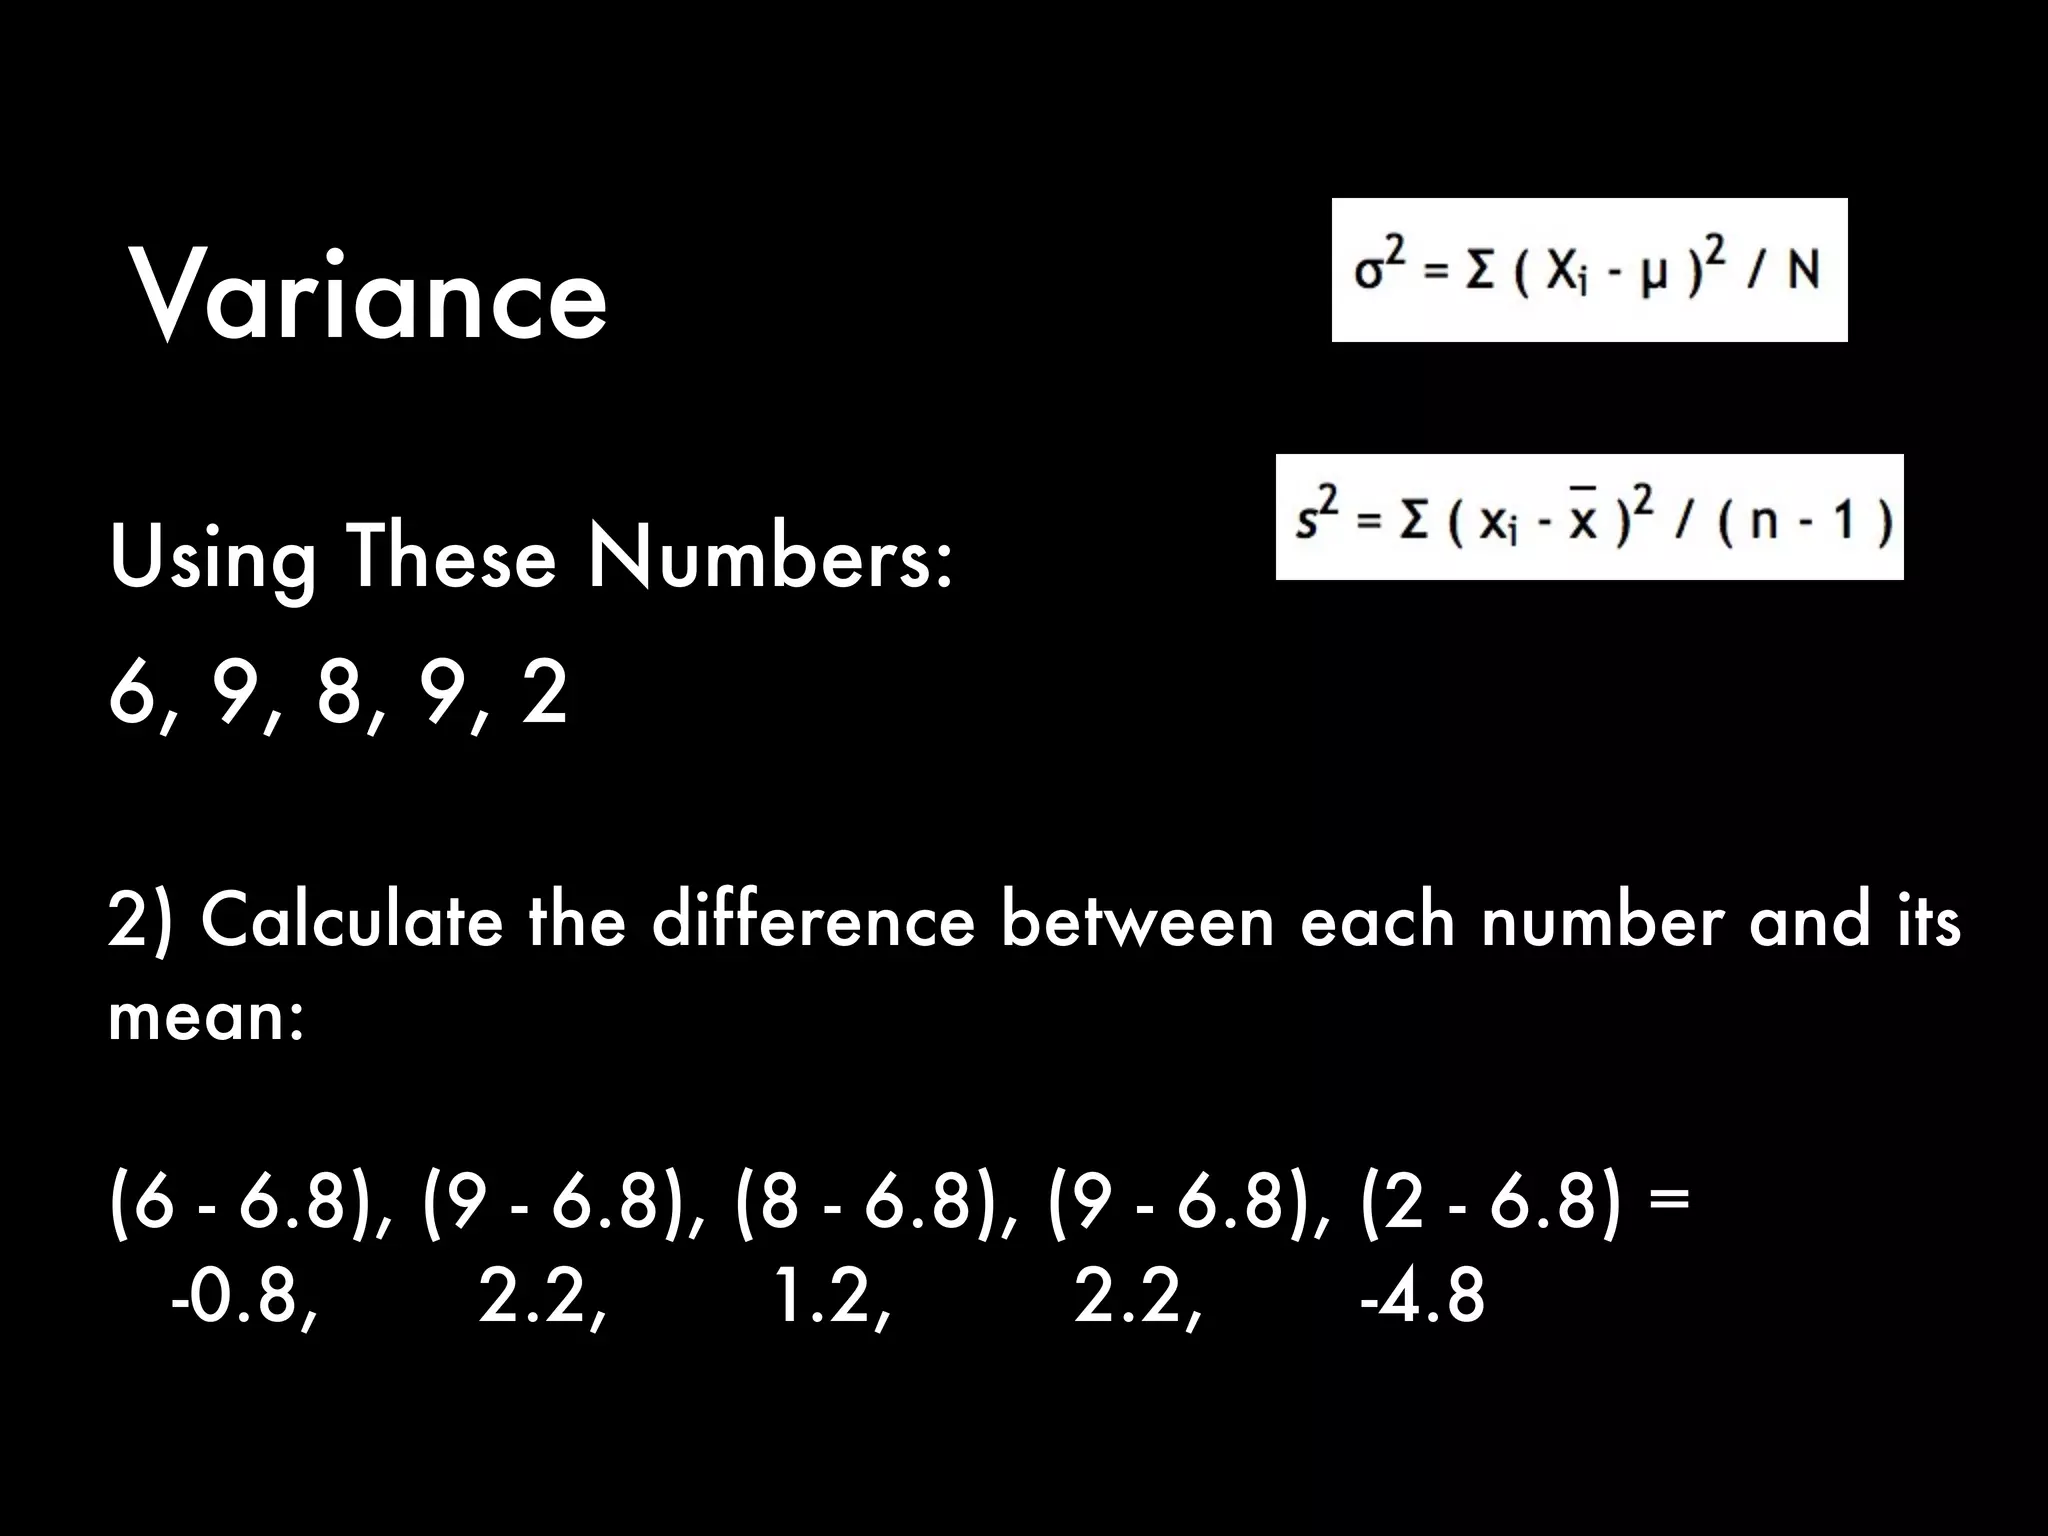
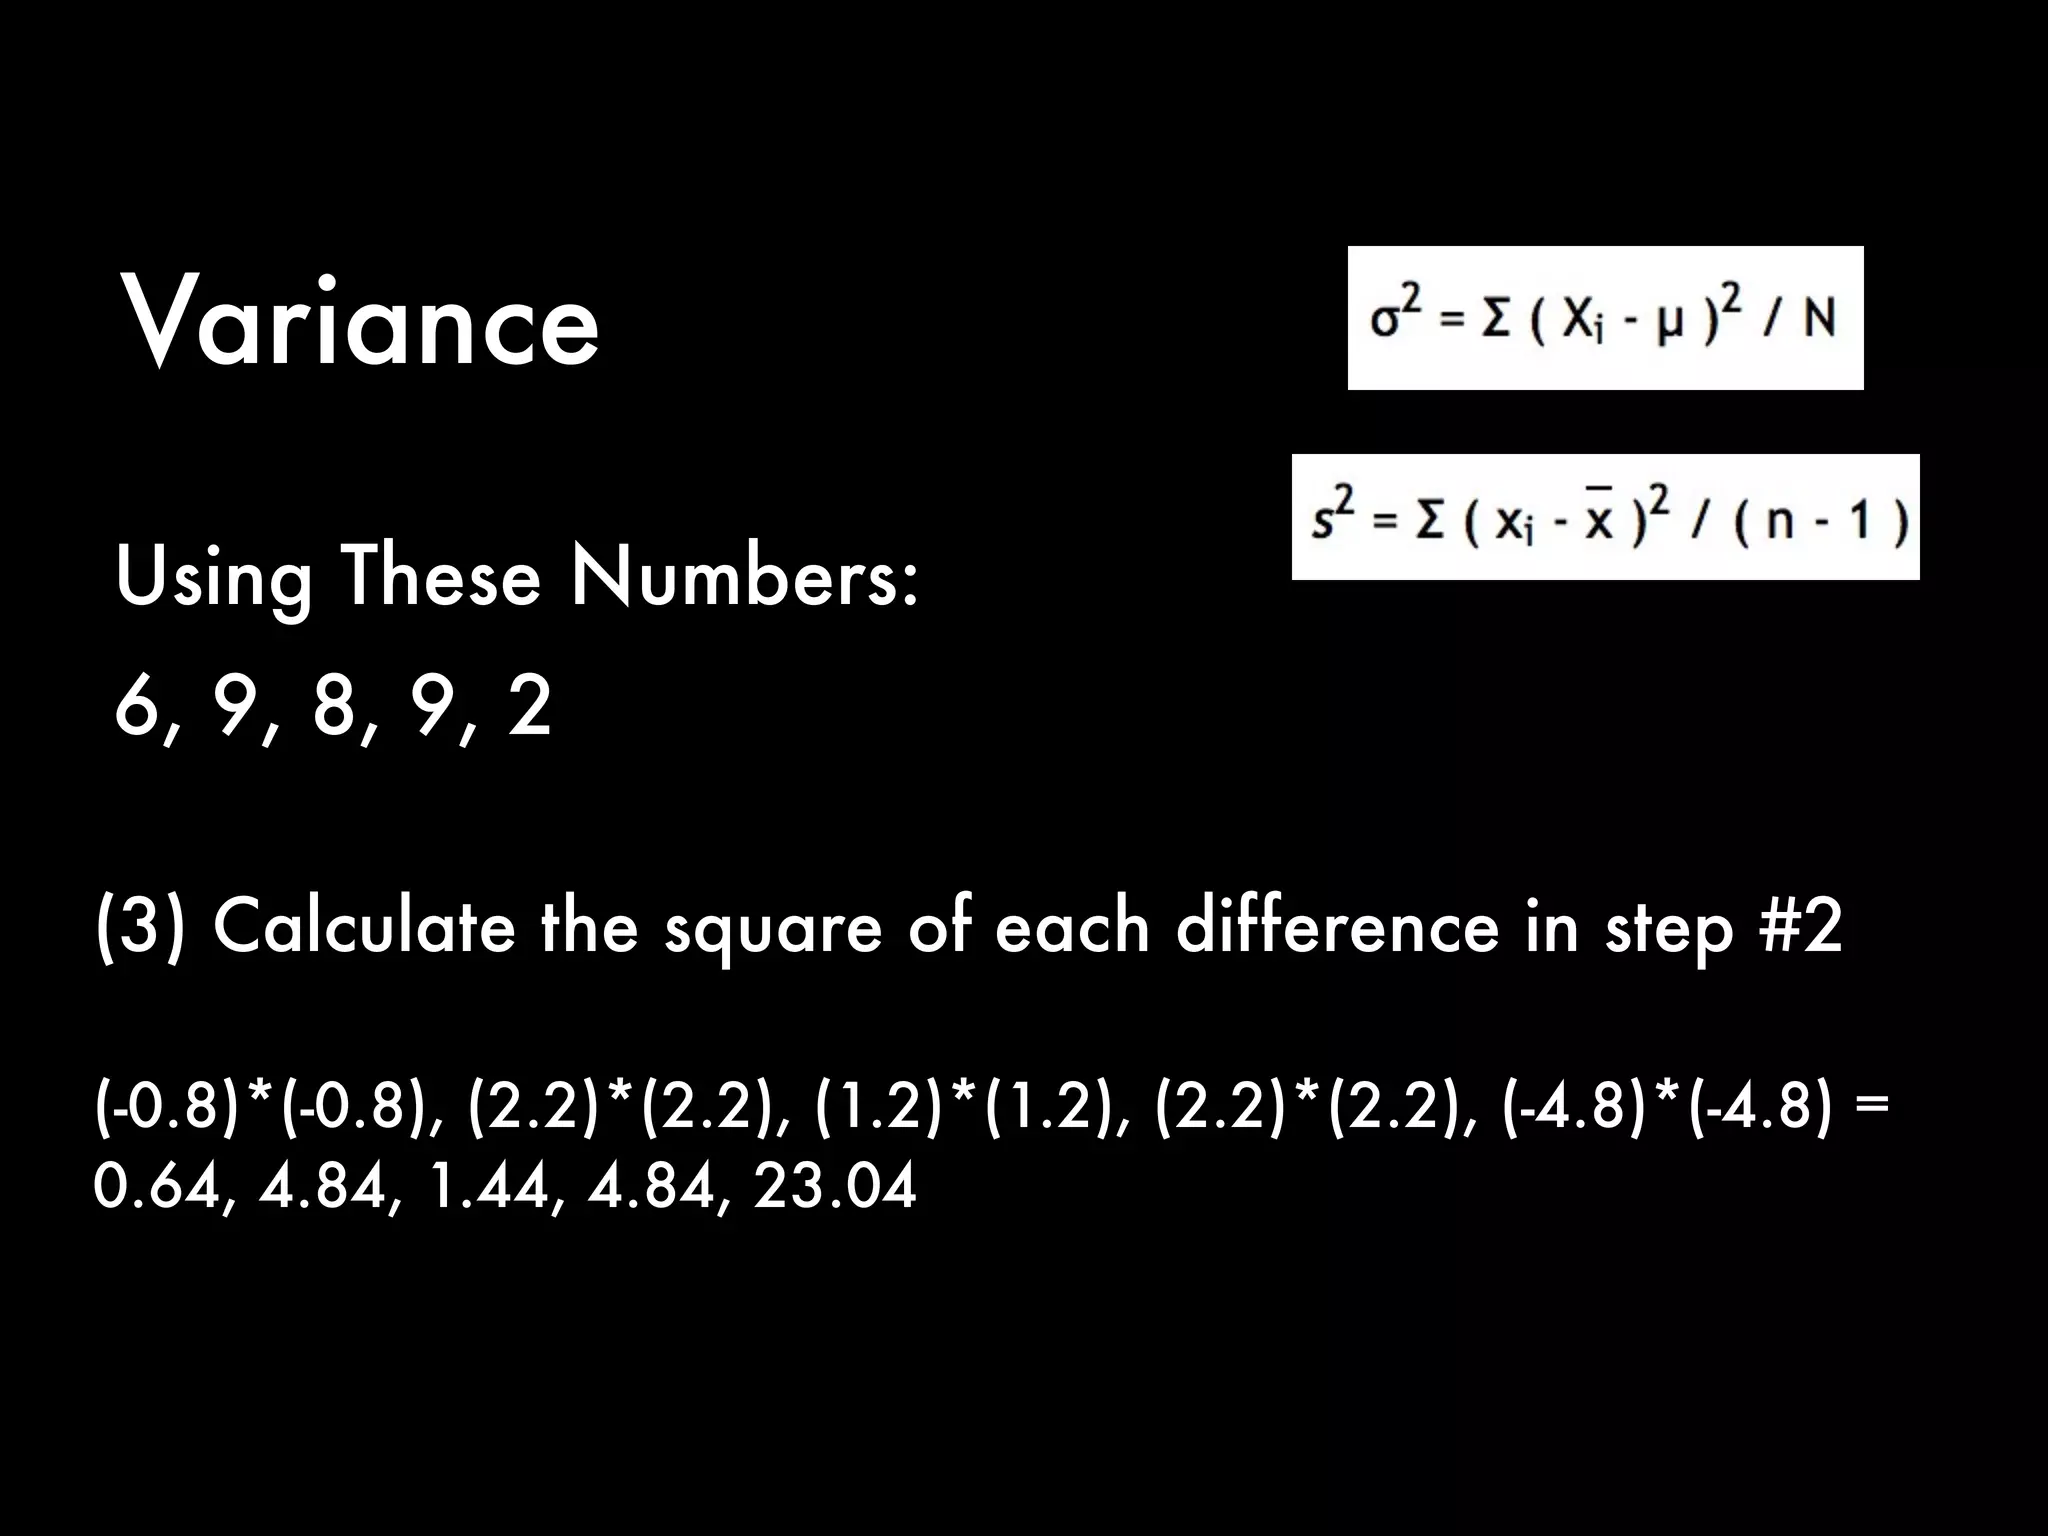
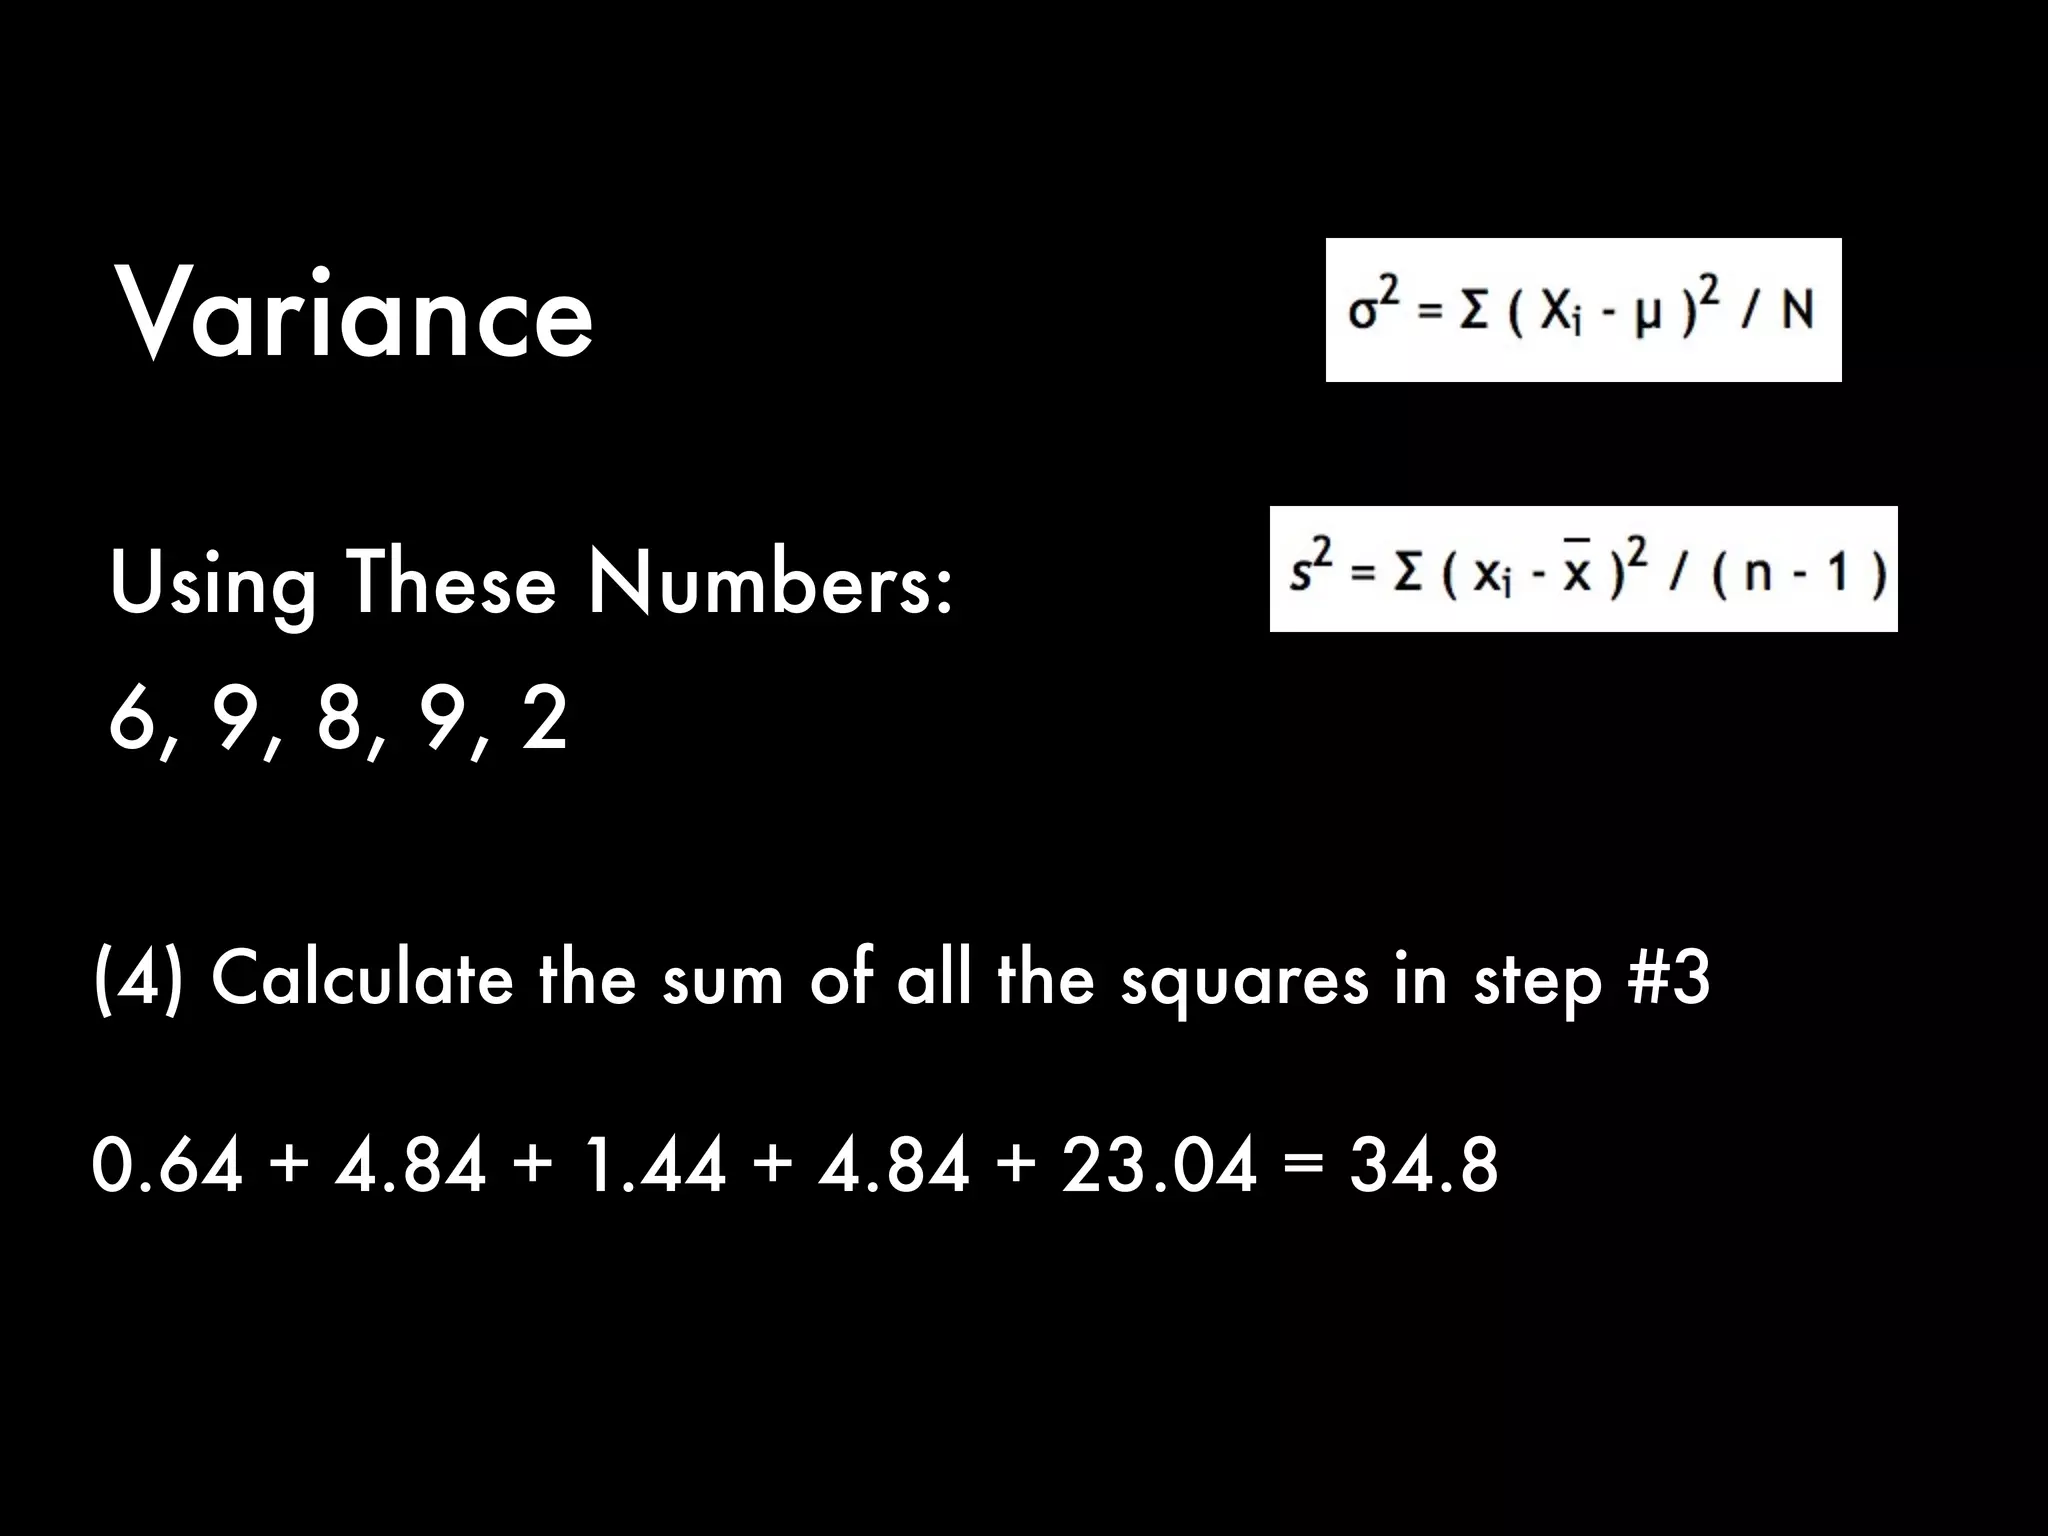
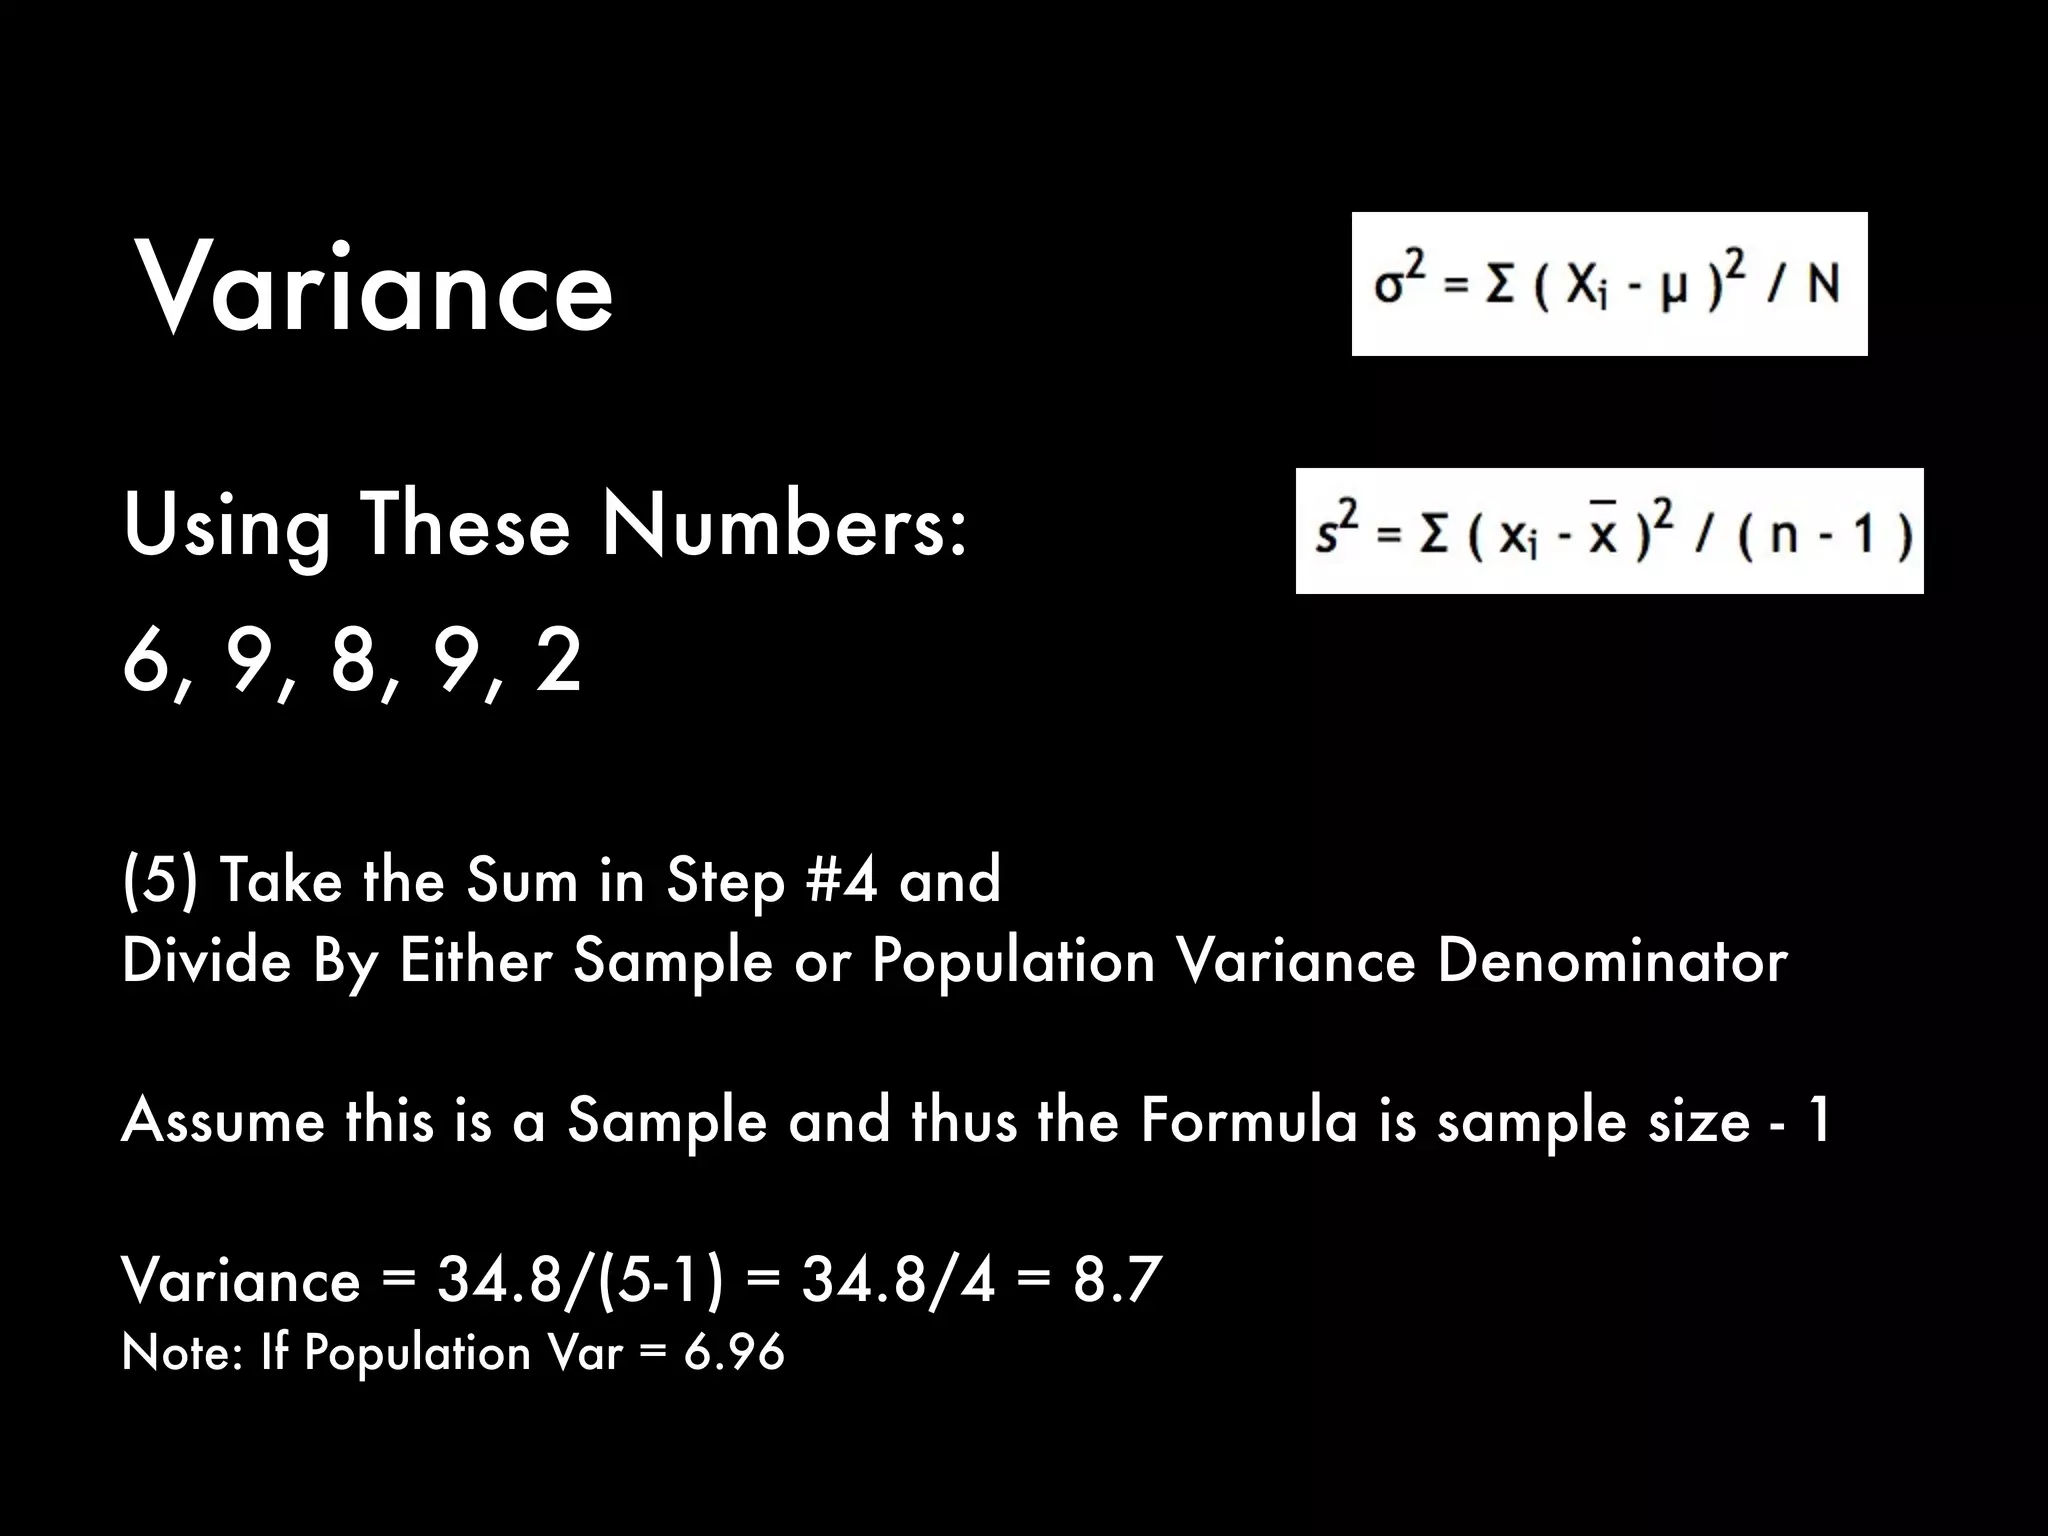
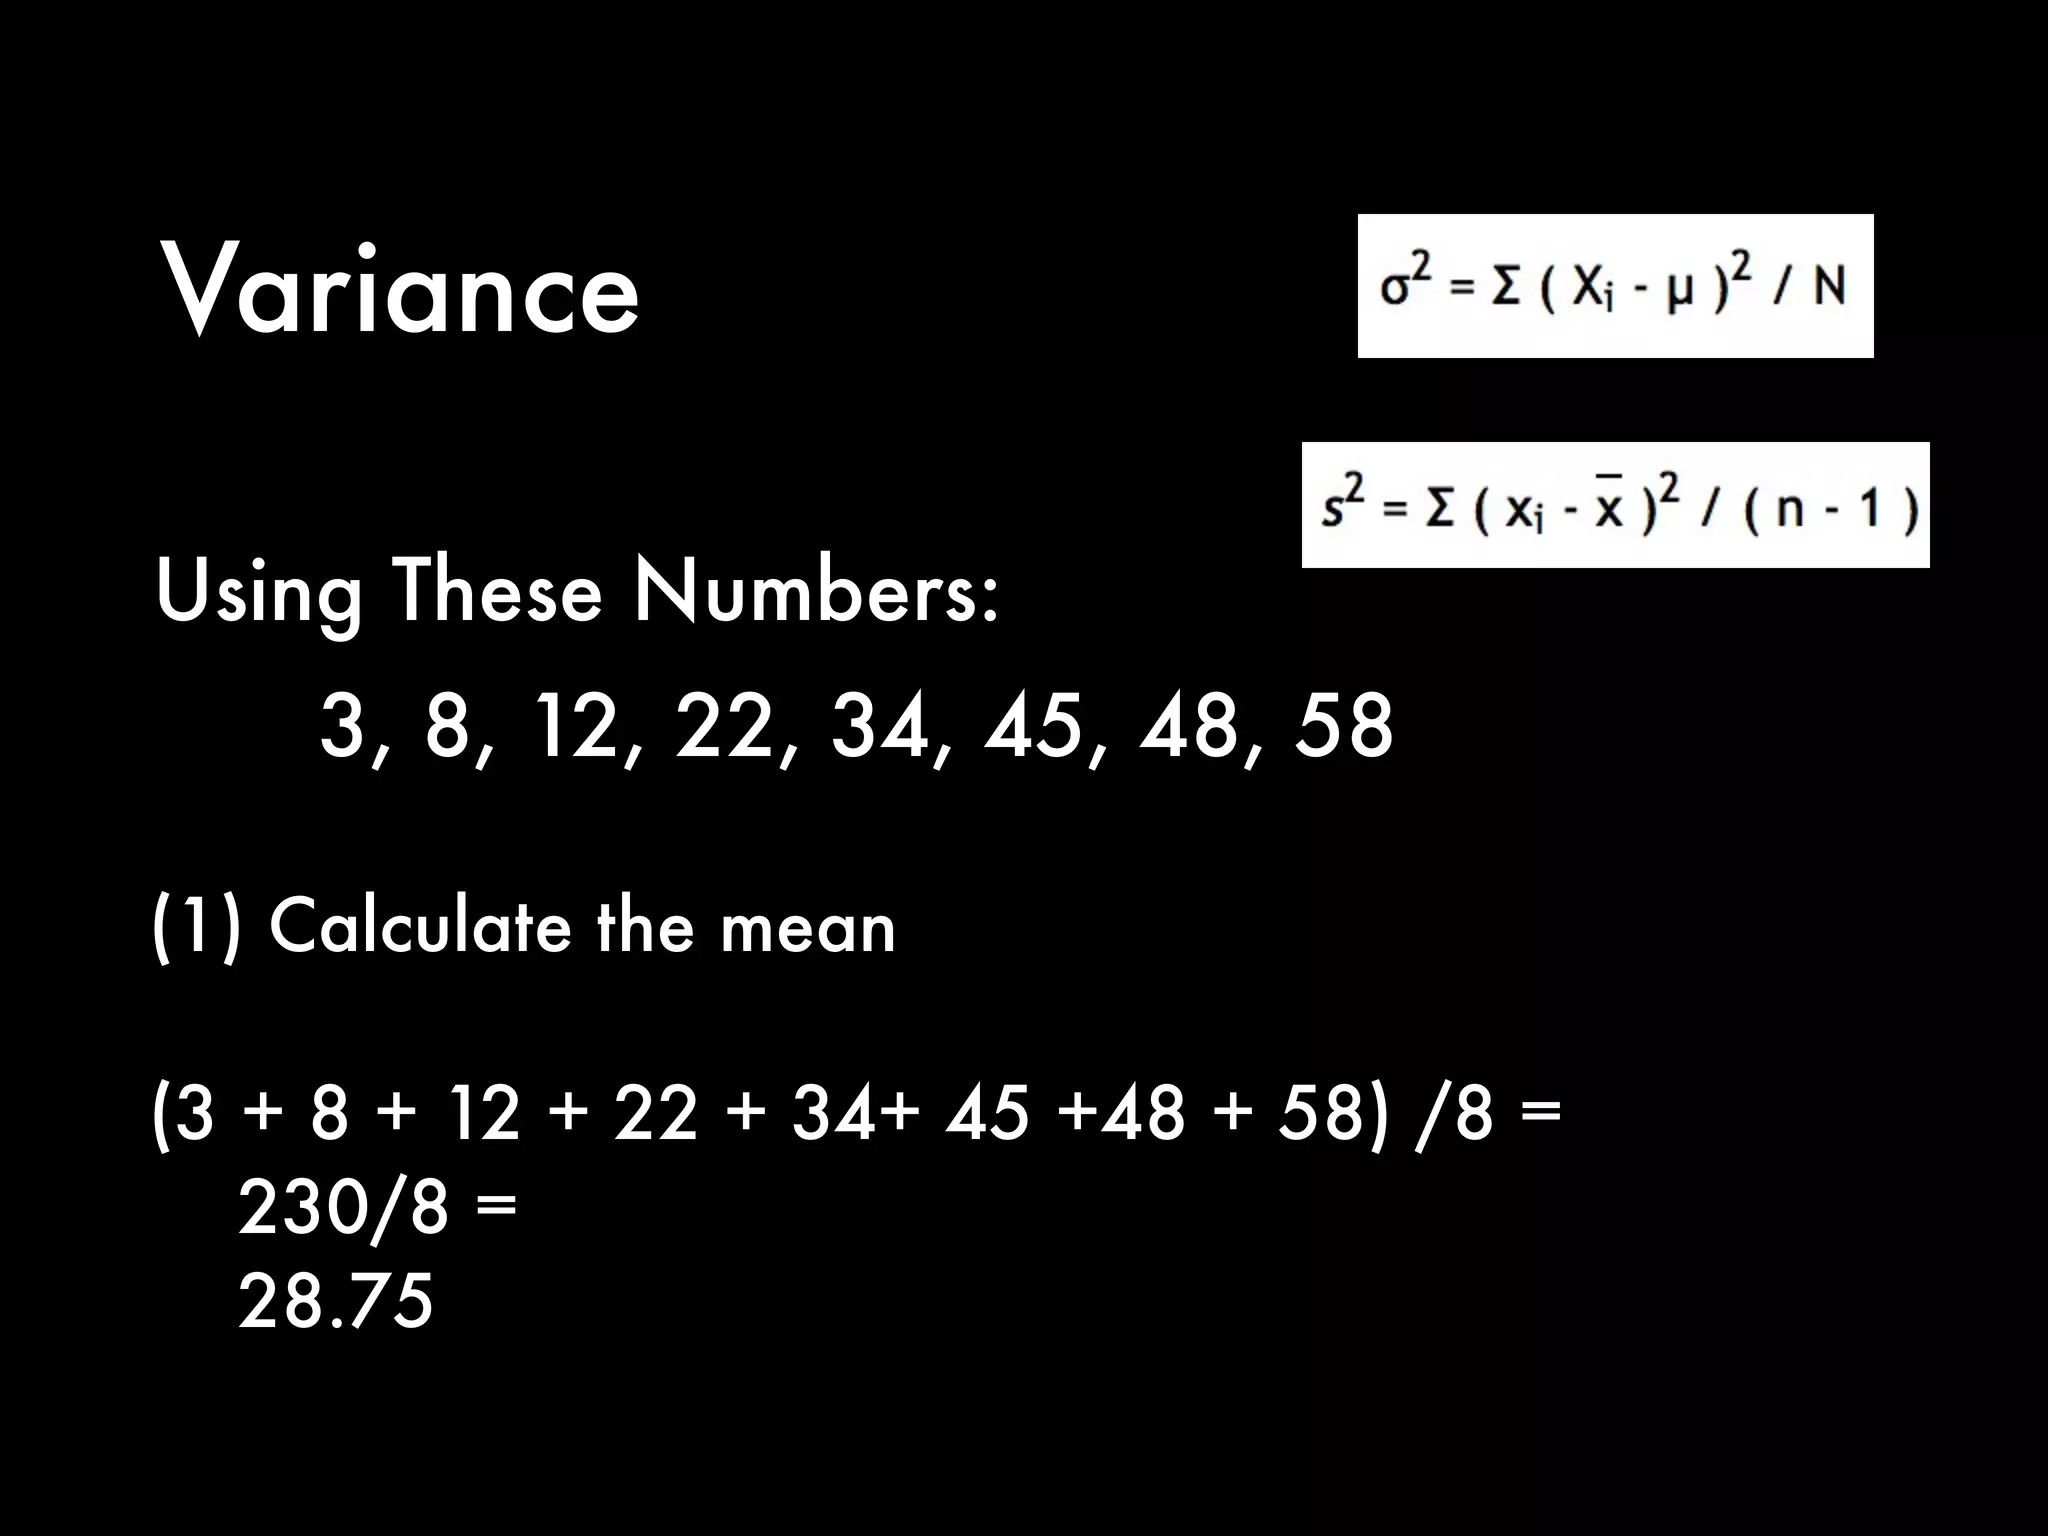
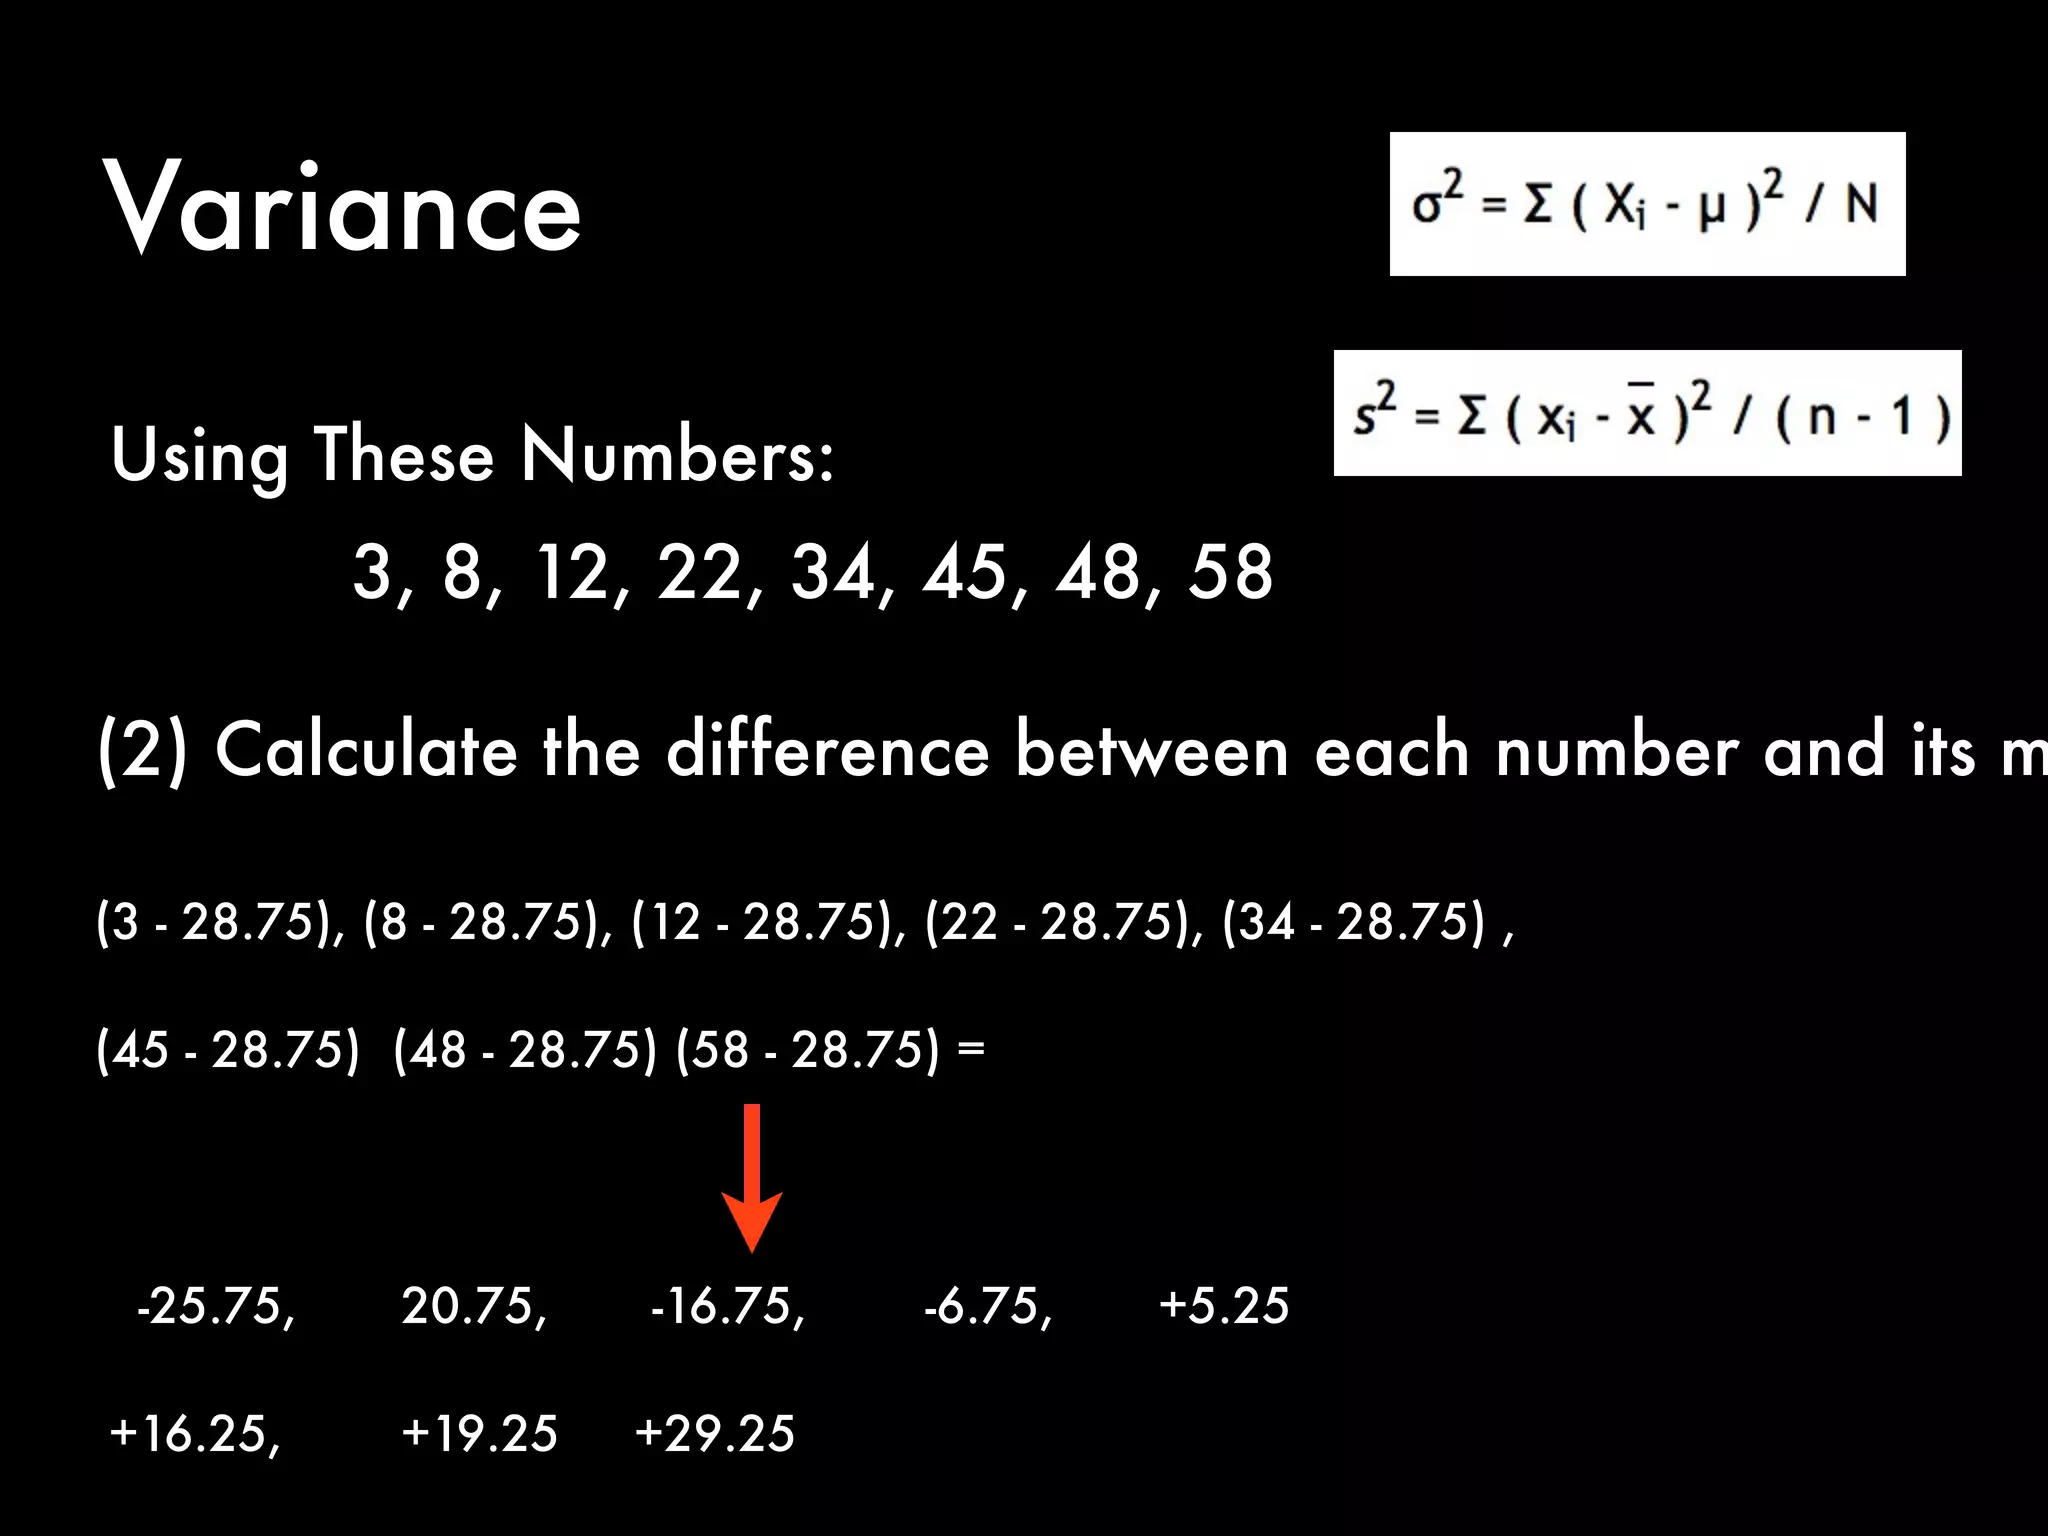
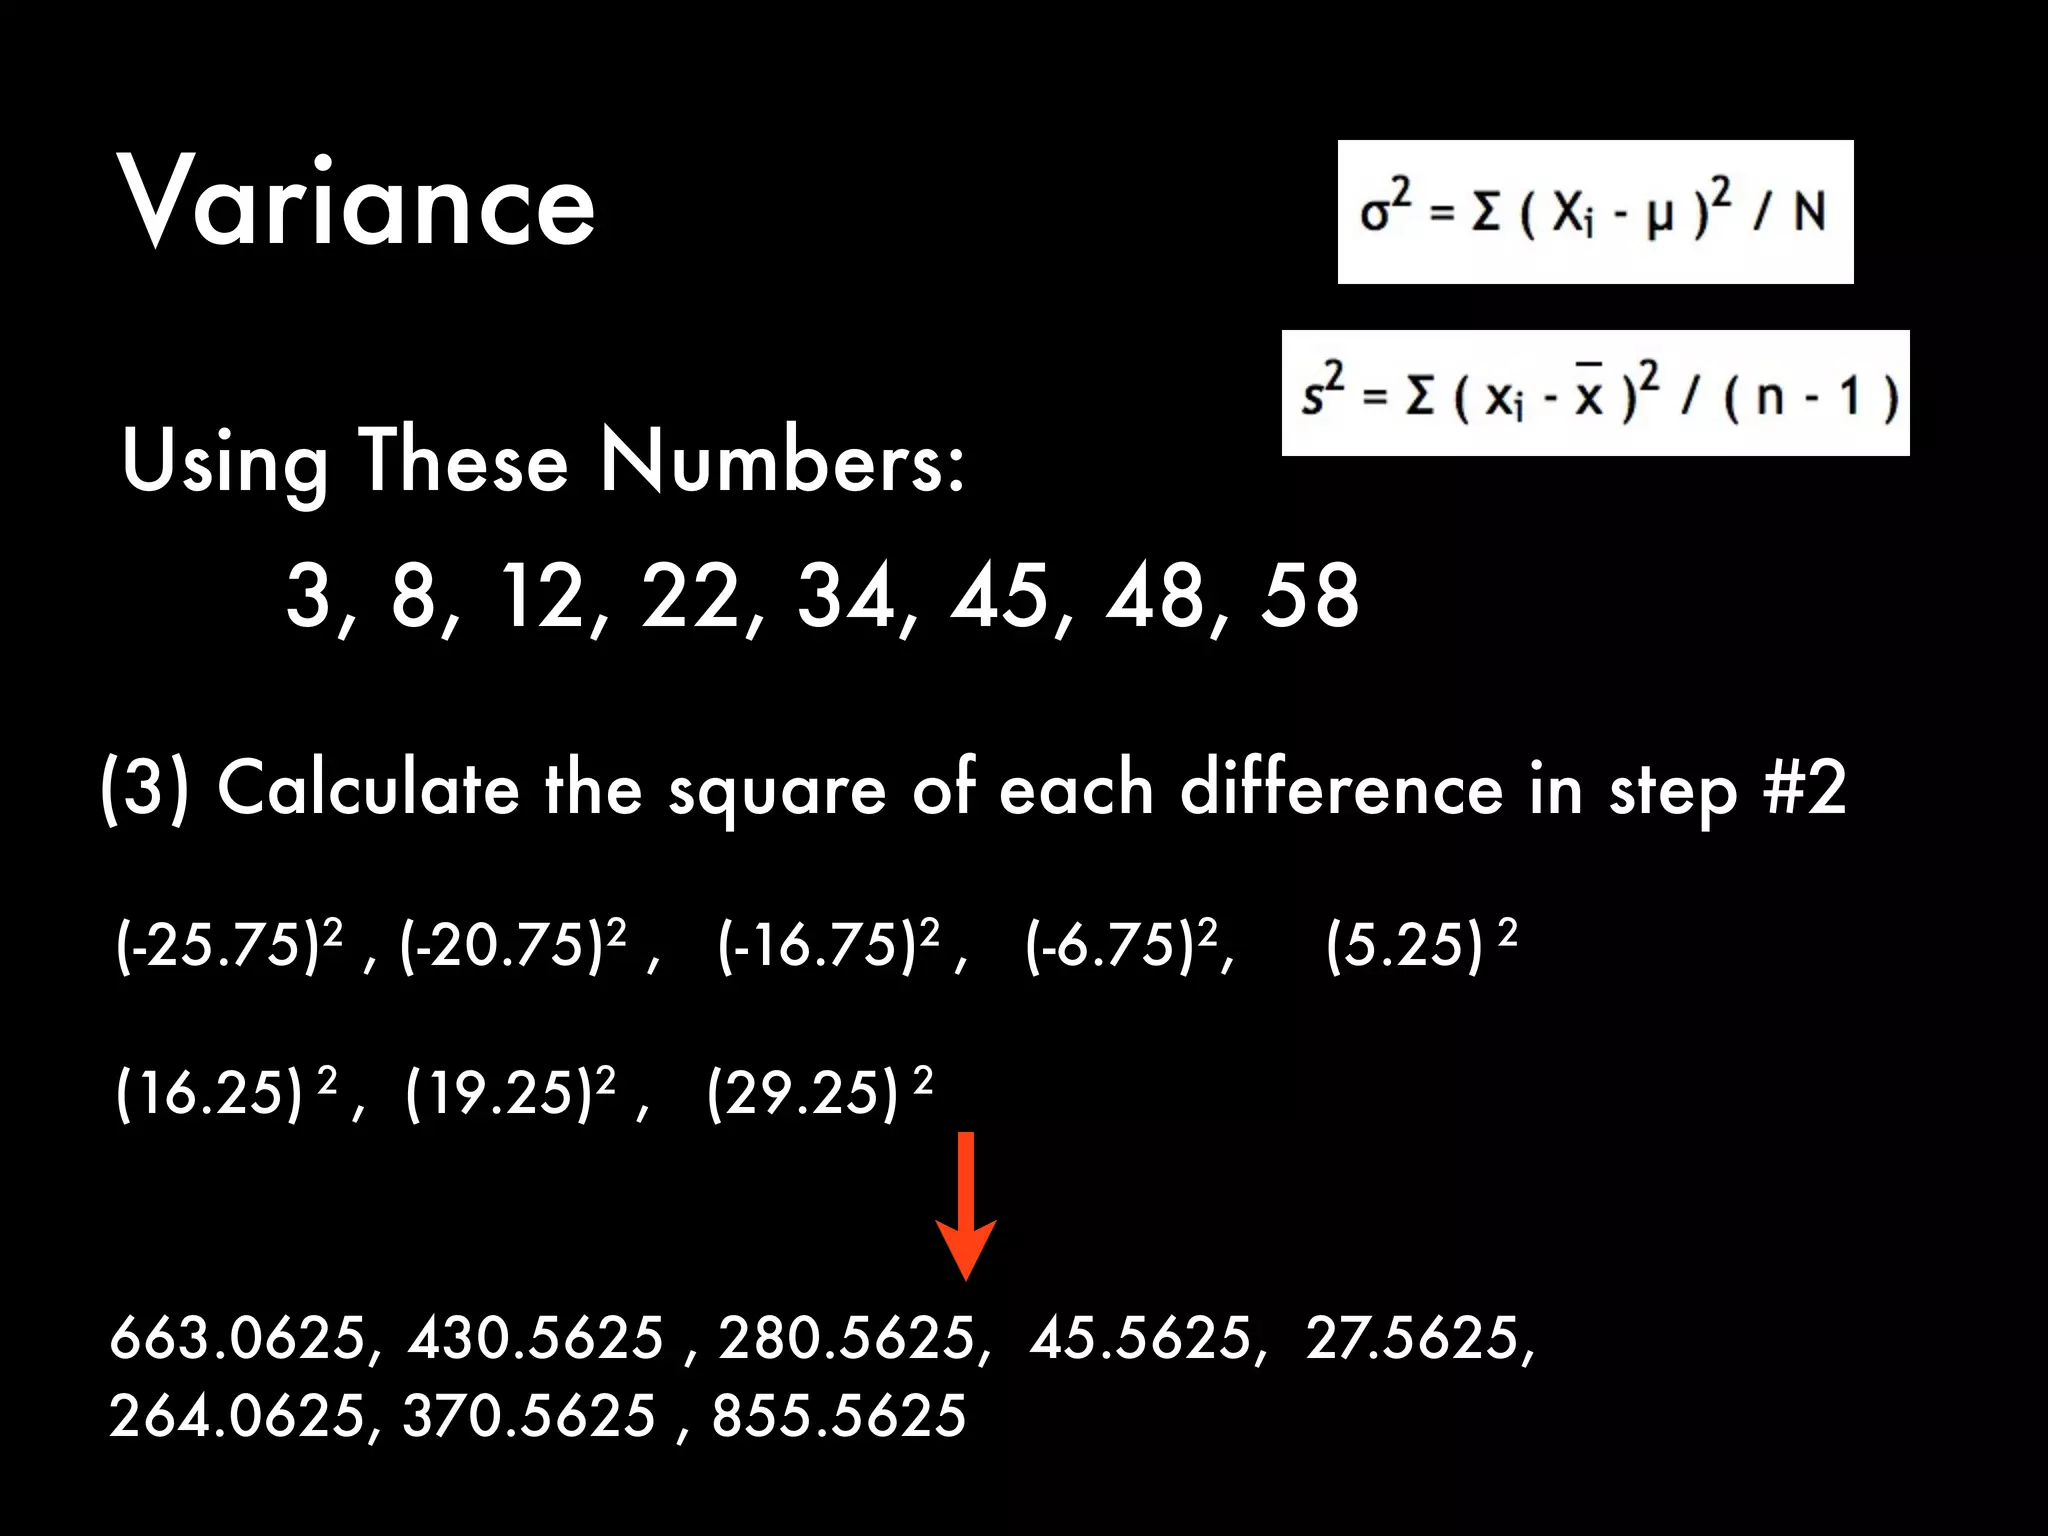
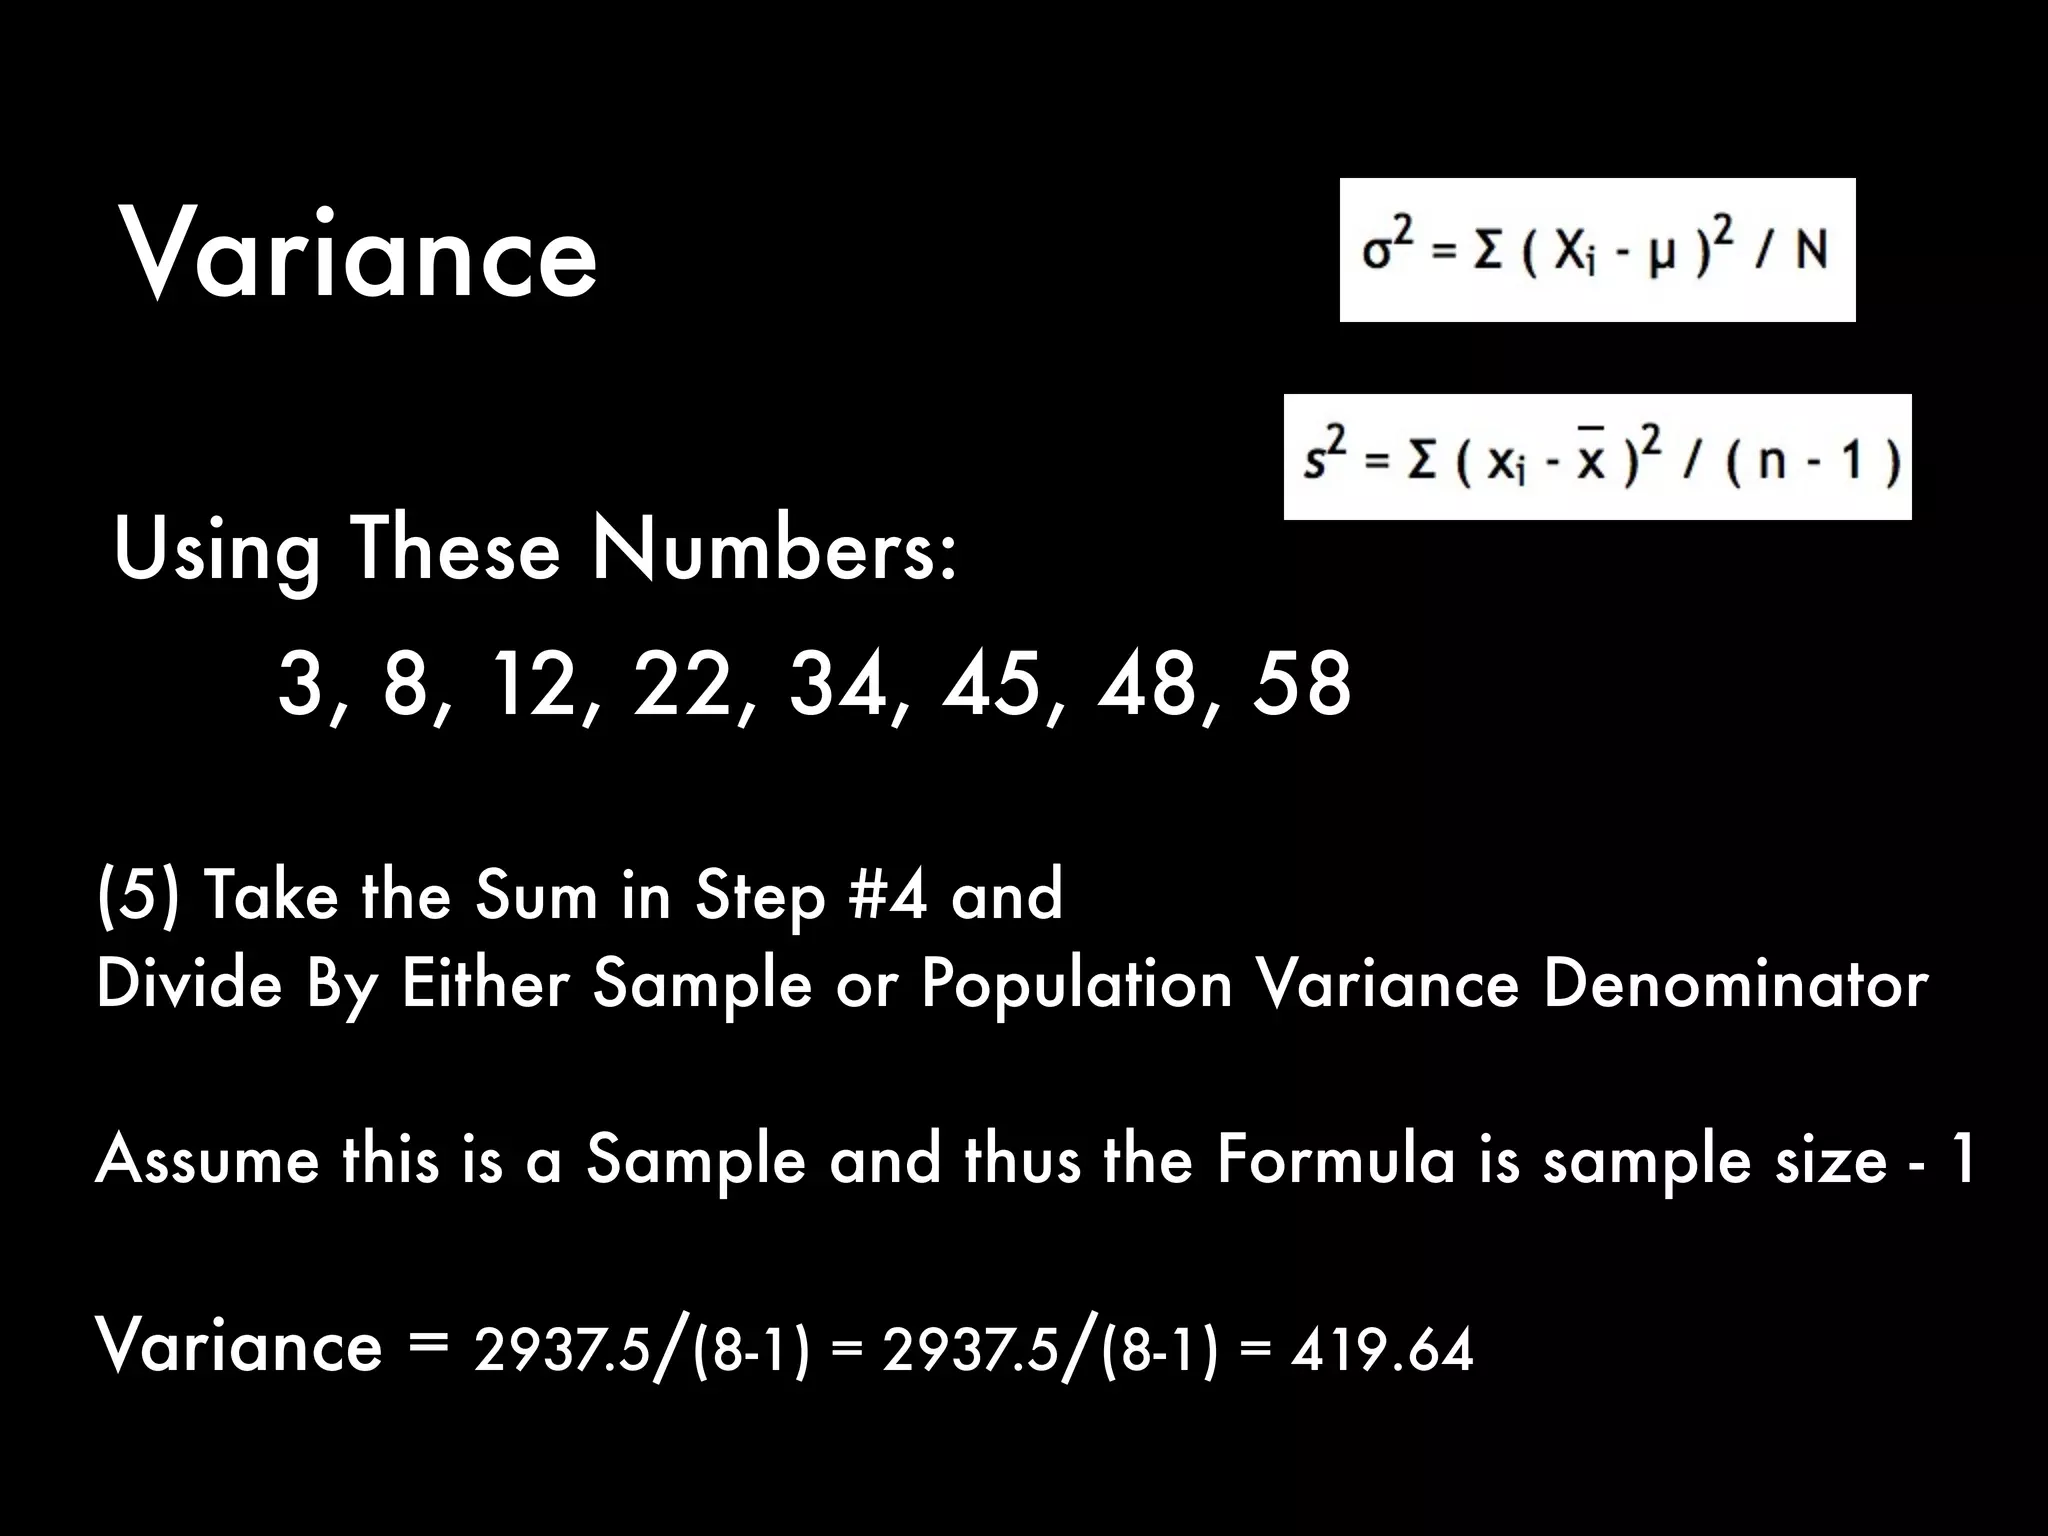
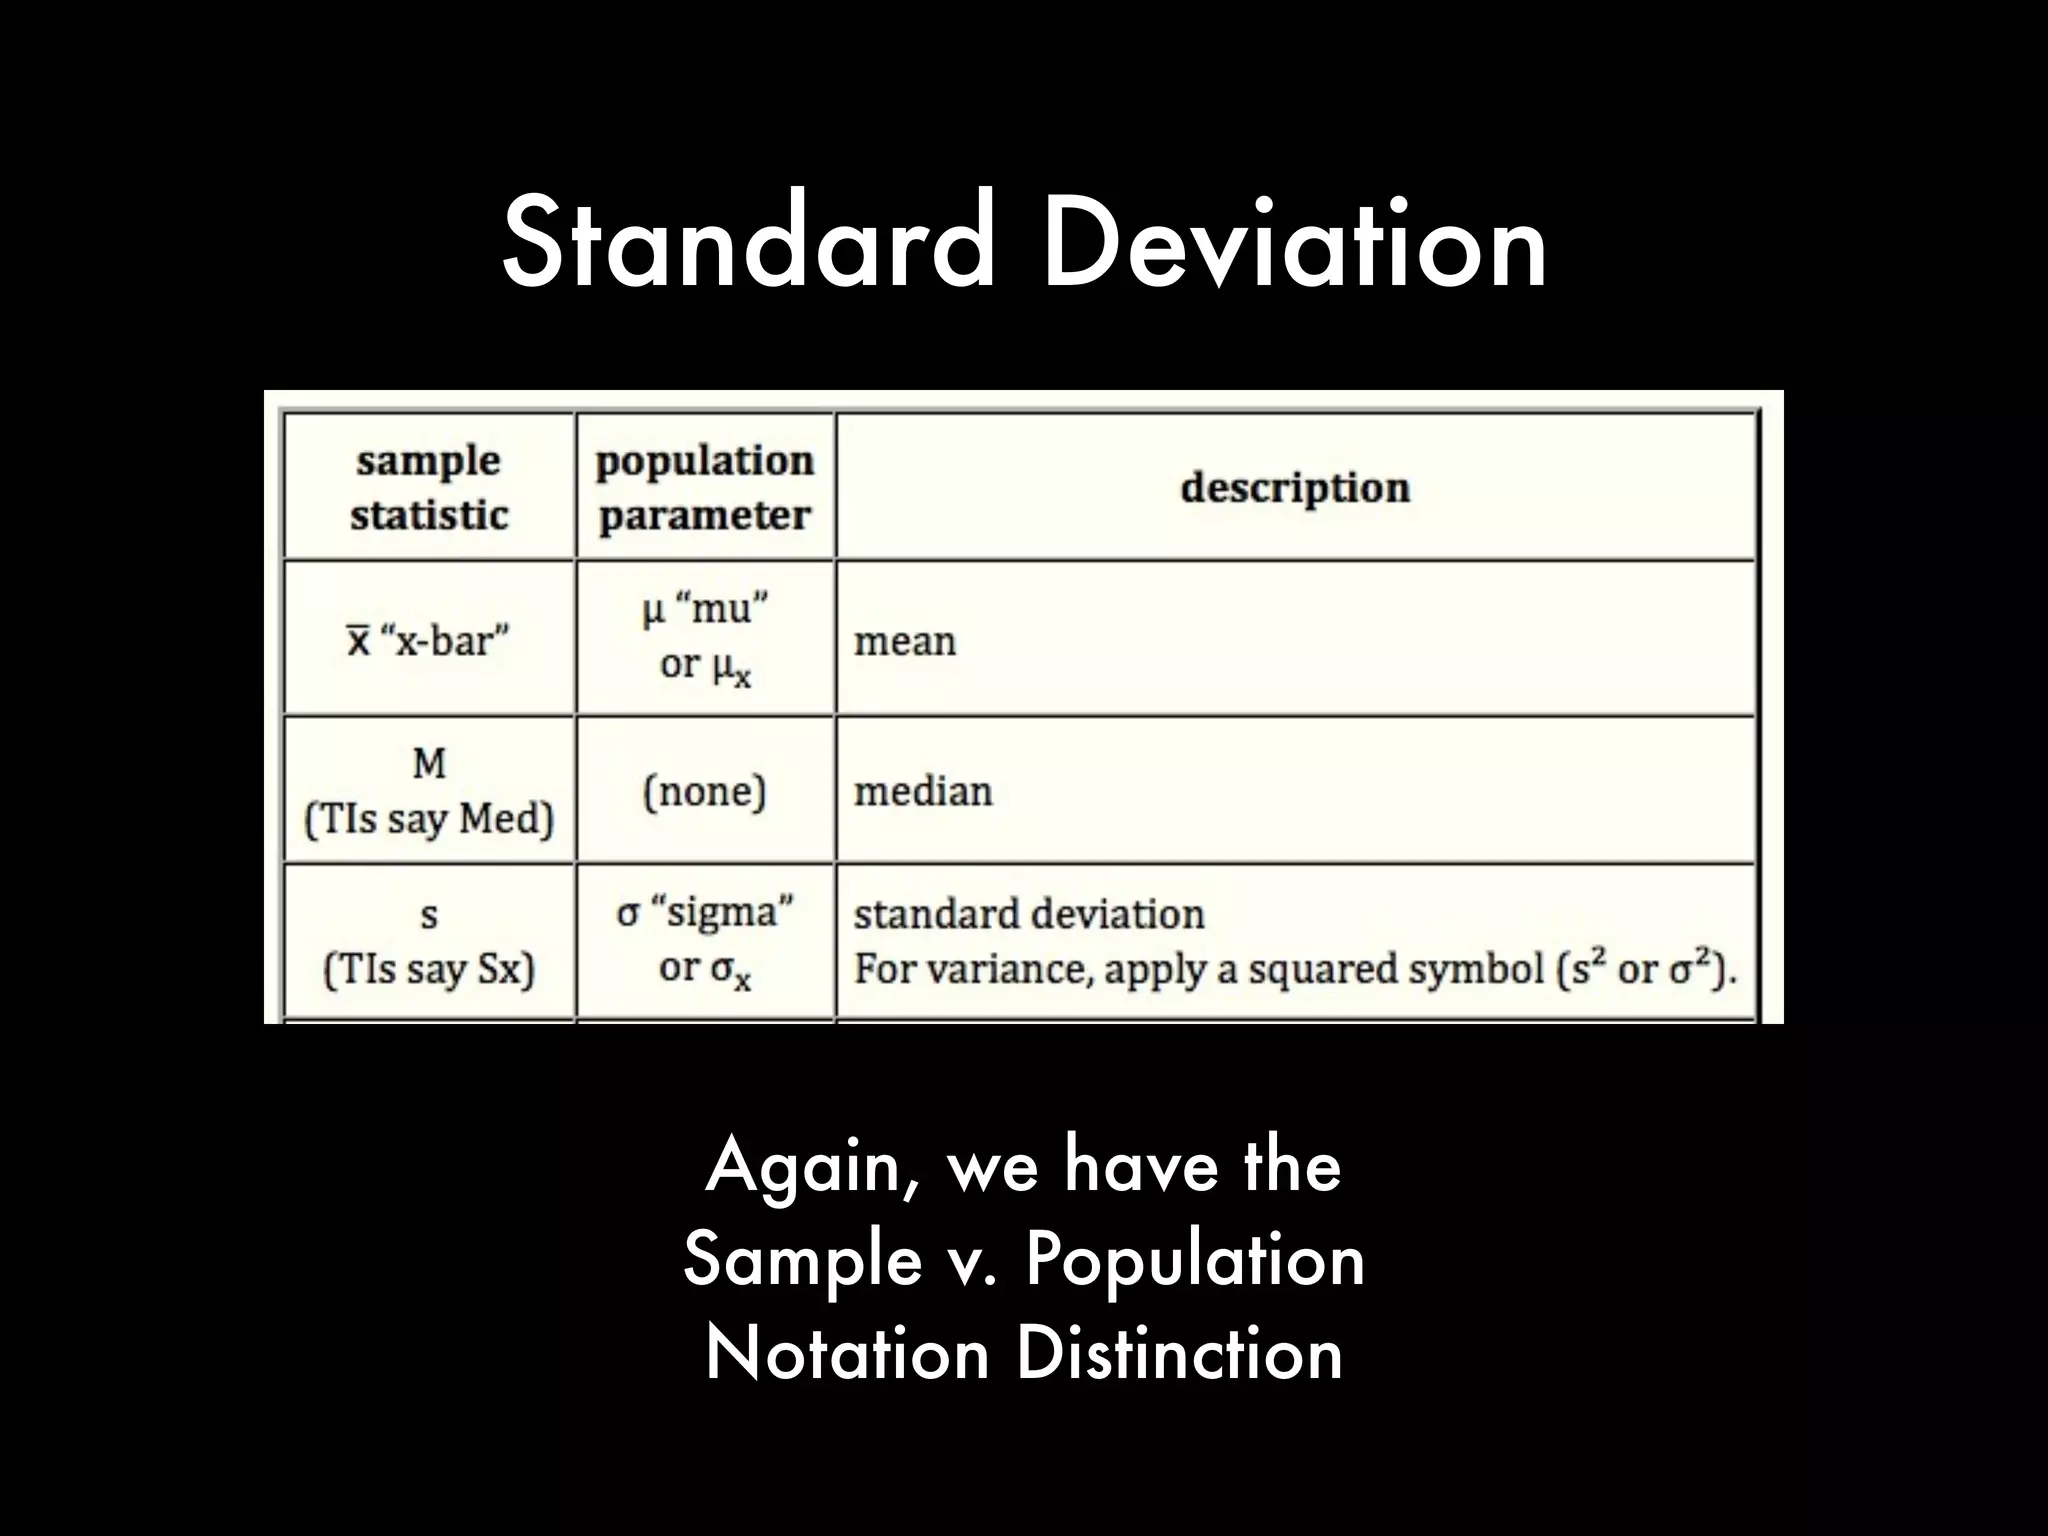
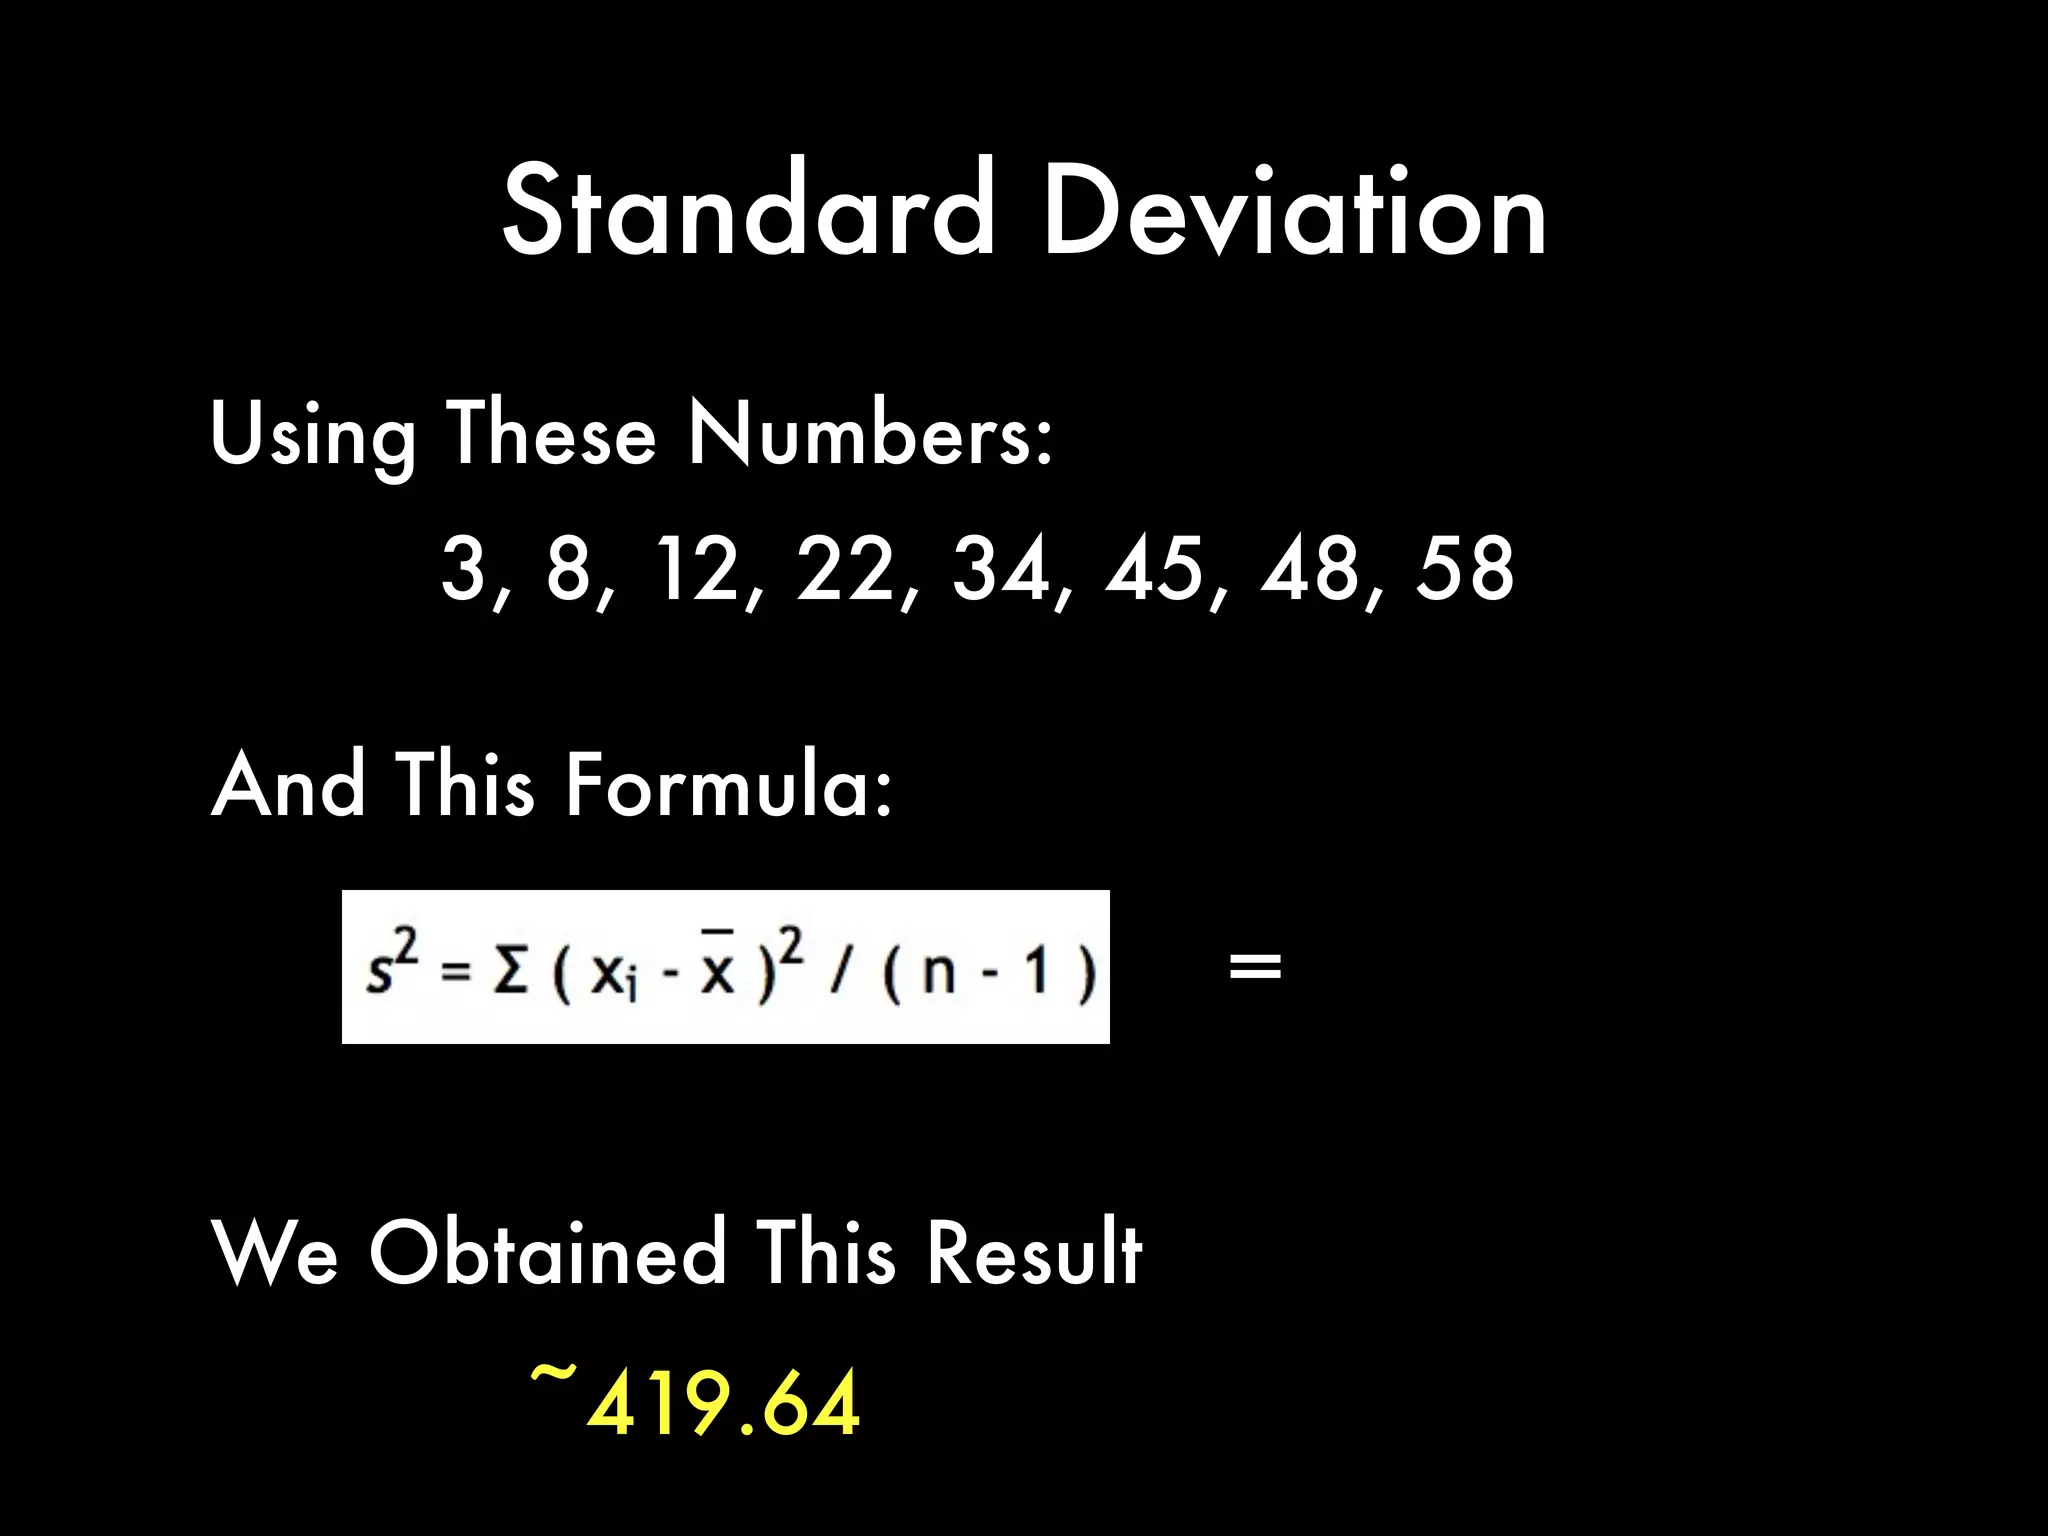
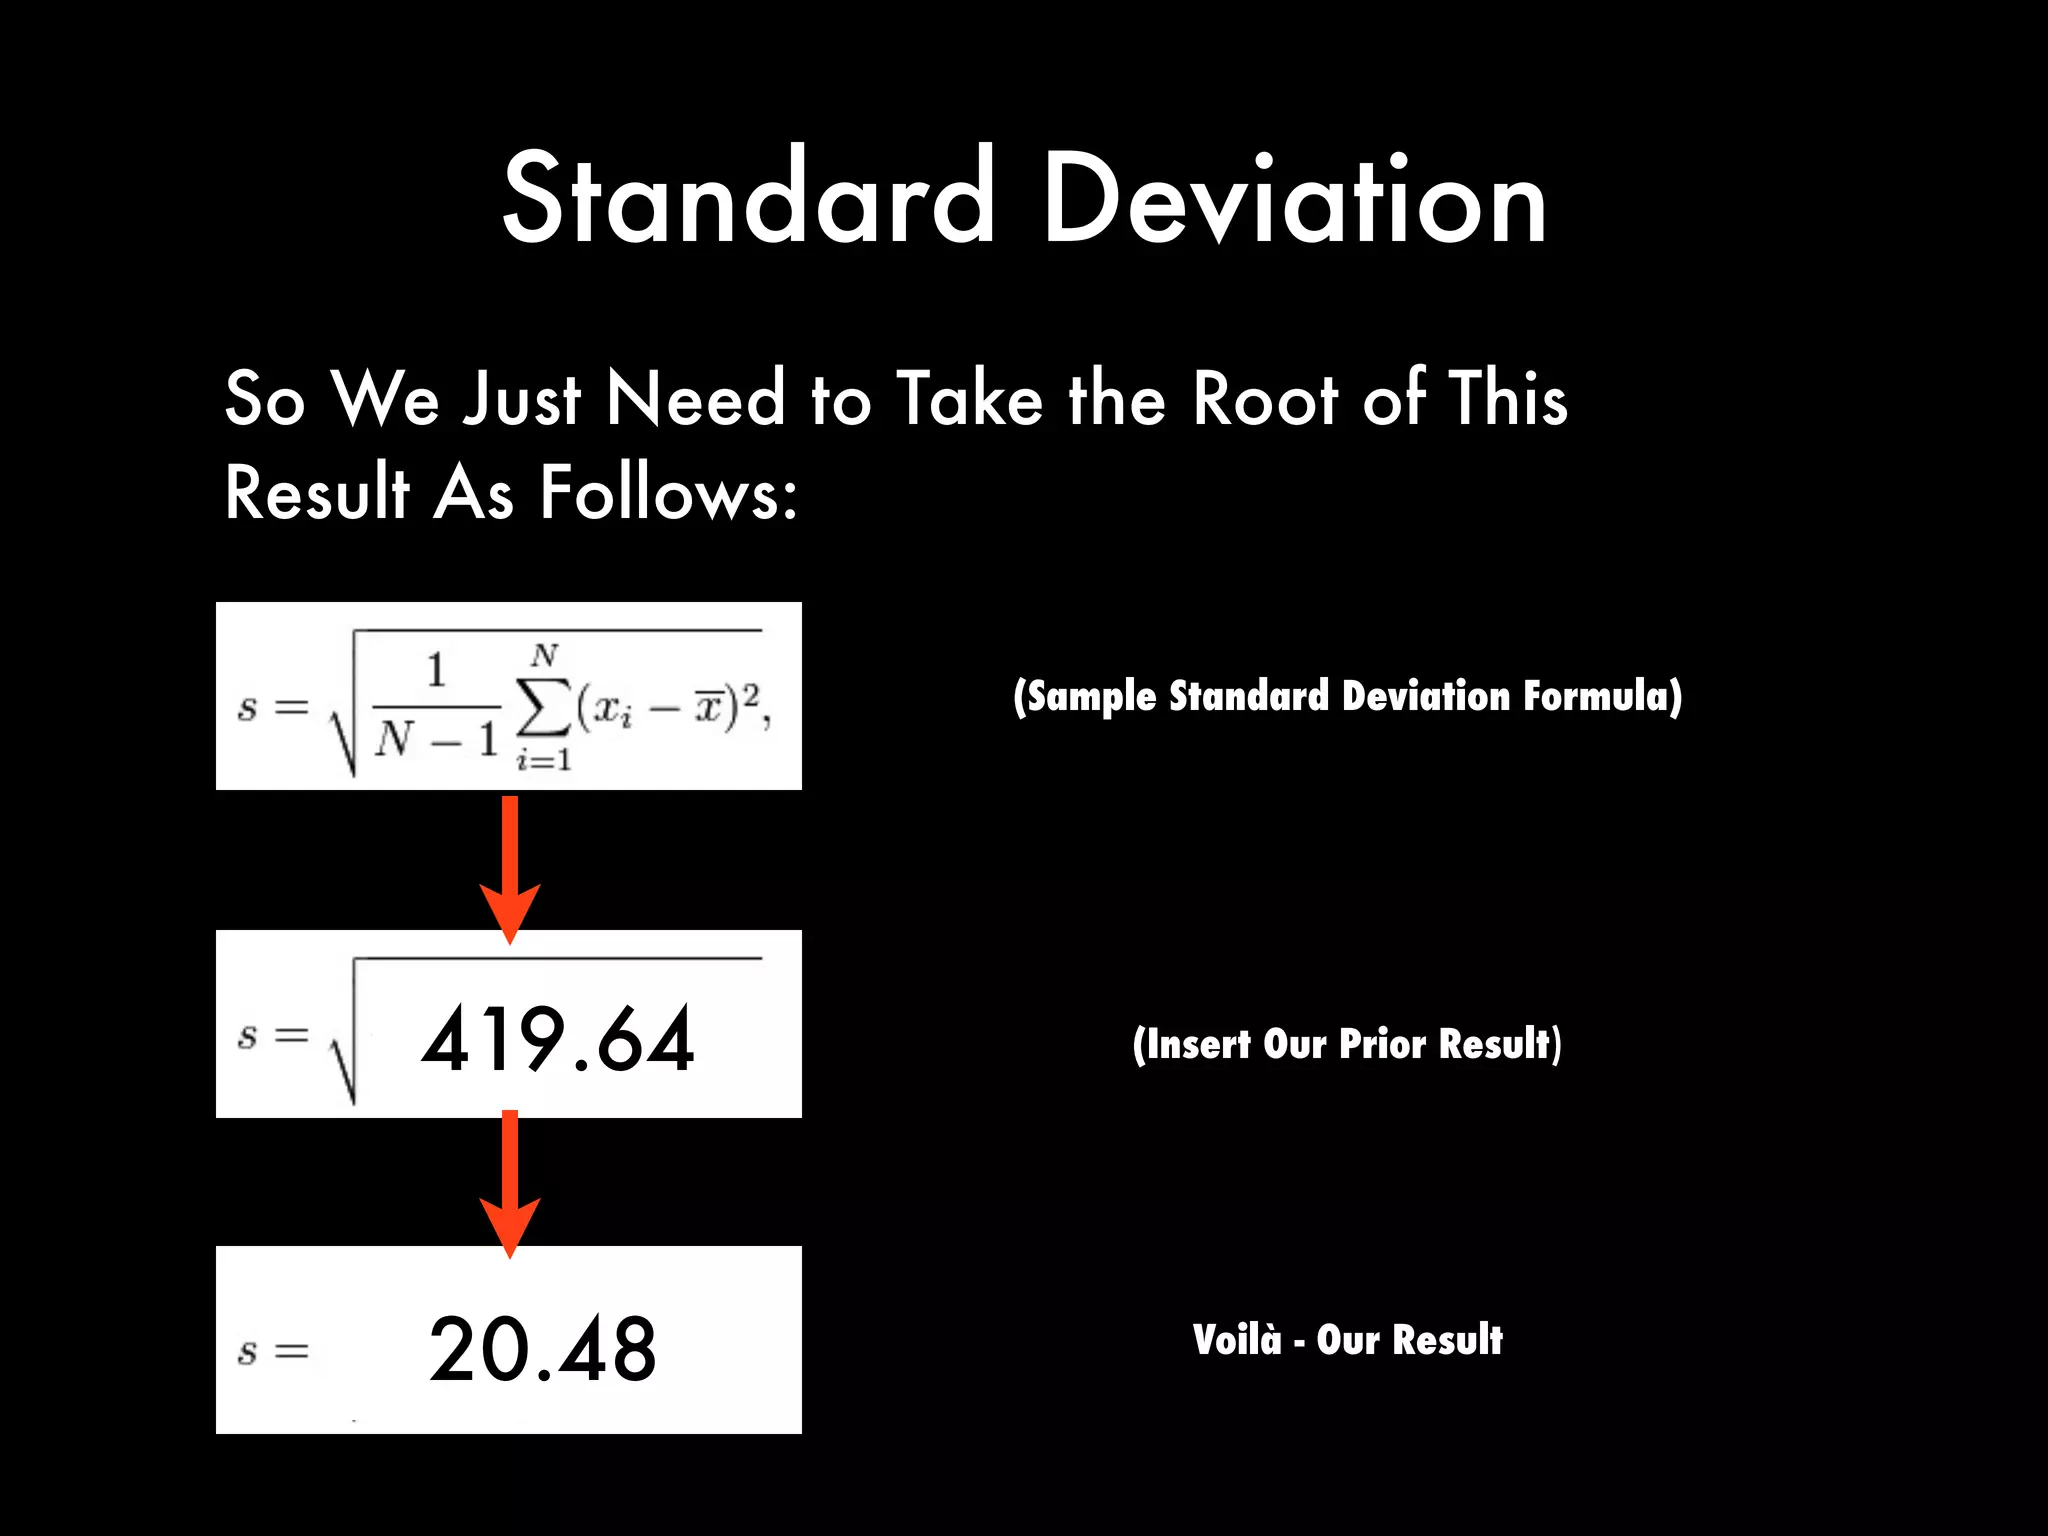
Quantitative
Methods
for
Lawyers
Probability &
Basic Statistics (Part 2)
Class #7
@ computational
computationallegalstudies.com
professor daniel martin katz danielmartinkatz.com
lexpredict.com slideshare.net/DanielKatz
Quick Word:
Sample Statistics v.
Population Parameters
If it is a variable whose measurement is derived
from a sample, it is a sample statistic.
If it is a variable whose measurement is derived
from a population, it is a population parameter.
Last Time We Saw “X Bar”
Technically this is the Notation for a Sample Mean
But I wanted to wait to Discuss this until now ...
Quick Word:
Sample Statistics v.
Population Parameters
Variance
Population Variance Formula
Sample Variance Formula
Variance
Mean is the First Moment of a Distribution
Variance is the Second Moment of a Distribution
Variance
Population Variance Formula
Sample Variance Formula
Notice the Notation
Notice the Notation
Variance
(1) Calculate the mean
(2) Calculate the difference between each number
and its mean
(3) Calculate the square of each difference in step #2
(4) Calculate the sum of all the squares in step #3
(5) Take the Sum in Step #4 and
Divide By Either Sample or Population Variance Denominator
Variance
(1) Calculate the mean
(6+ 9+ 8 + 9 + 2)/5 = 34/5 = 6.8
Using These Numbers:
6, 9, 8, 9, 2
Variance
2) Calculate the difference between each number and its
mean:
(6 - 6.8), (9 - 6.8), (8 - 6.8), (9 - 6.8), (2 - 6.8) =
-0.8, 2.2, 1.2, 2.2, -4.8
Using These Numbers:
6, 9, 8, 9, 2
Variance
Using These Numbers:
6, 9, 8, 9, 2
(3) Calculate the square of each difference in step #2
(-0.8)*(-0.8), (2.2)*(2.2), (1.2)*(1.2), (2.2)*(2.2), (-4.8)*(-4.8) =
0.64, 4.84, 1.44, 4.84, 23.04
Variance
(4) Calculate the sum of all the squares in step #3
0.64 + 4.84 + 1.44 + 4.84 + 23.04 = 34.8
Using These Numbers:
6, 9, 8, 9, 2
Variance
(5) Take the Sum in Step #4 and
Divide By Either Sample or Population Variance Denominator
Assume this is a Sample and thus the Formula is sample size - 1
Variance = 34.8/(5-1) = 34.8/4 = 8.7
Note: If Population Var = 6.96
Using These Numbers:
6, 9, 8, 9, 2
Variance
Please Get in Small Groups and
Calculate the Sample Variance By Hand
for the Following Data Set:
3, 8, 12, 22, 34, 45, 48, 58
Variance
(1) Calculate the mean
(3 + 8 + 12 + 22 + 34+ 45 +48 + 58) /8 =
230/8 =
28.75
Using These Numbers:
3, 8, 12, 22, 34, 45, 48, 58
Variance
(2) Calculate the difference between each number and its m
(3 - 28.75), (8 - 28.75), (12 - 28.75), (22 - 28.75), (34 - 28.75) ,
(45 - 28.75) (48 - 28.75) (58 - 28.75) =
-25.75, 20.75, -16.75, -6.75, +5.25
+16.25, +19.25 +29.25
Using These Numbers:
3, 8, 12, 22, 34, 45, 48, 58
Variance
(3) Calculate the square of each difference in step #2
(-25.75)2
, (-20.75)2
, (-16.75)2
, (-6.75)2
, (5.25) 2
(16.25) 2
, (19.25)2
, (29.25) 2
Using These Numbers:
3, 8, 12, 22, 34, 45, 48, 58
663.0625, 430.5625 , 280.5625, 45.5625, 27.5625,
264.0625, 370.5625 , 855.5625
Variance
(4) Calculate the sum of all the squares in step #3
663.0625 +430.5625 + 280.5625 + 45.5625 + 27.5625+
264.0625 + 370.5625 + 855.5625 =
2937.5
Using These Numbers:
3, 8, 12, 22, 34, 45, 48, 58
Variance
(5) Take the Sum in Step #4 and
Divide By Either Sample or Population Variance Denominator
Assume this is a Sample and thus the Formula is sample size - 1
Variance = 2937.5/(8-1) = 2937.5/(8-1) = 419.64
Using These Numbers:
3, 8, 12, 22, 34, 45, 48, 58
Variance
Please Get in Small Groups and
Calculate the Sample Variance By Hand
for the Following Data Set:
3, 8, 12, 22, 34, 45, 48, 58
~419.6
Standard Deviation
Again, we have the
Sample v. Population
Notation Distinction
Standard Deviation
Standard deviation is a widely used measure of
variability or diversity used in statistics and probability
theory.
It shows how much variation or "dispersion" exists from
the average (mean, or expected value).
A low standard deviation indicates that the data points
tend to be very close to the mean, whereas high
standard deviation indicates that the data points are
spread out over a large range of values.
Visual Display of
Two Distributions
Again, Standard Deviation Captures the Spread /
dispersion from the Mean
Standard Deviation
Standard Deviation is the Square Root
of the Variance ...
Sample
Variance
Formula
Sample
Standard
deviation
Formula
Standard Deviation
Using These Numbers:
3, 8, 12, 22, 34, 45, 48, 58
~419.64
And This Formula:
=
We Obtained This Result
Standard Deviation
(Sample Standard Deviation Formula)
So We Just Need to Take the Root of This
Result As Follows:
419.64
Voilà - Our Result
20.48
(Insert Our Prior Result)
Standard Deviation
Standard deviation is only used to measure spread or
dispersion around the mean of a data set.
Standard deviation is never negative.
Standard deviation is sensitive to outliers. A single outlier
can raise the standard deviation and in turn, distort the
picture of spread.
For data with approximately the same mean, the greater the
spread, the greater the standard deviation.
Note: If all values of a data set are the same, the
standard deviation is zero (because each value is
equal to the mean).
Standard Deviation
In the Normal Distribution
68.2% of Data in +/- 1SD
95.4 of Data in +/- 2SD
99.7 of Data in +/- 3SD
Expected Value
Expected Value
the expected value (or expectation, or
mathematical expectation, or mean, or the first
moment) of a random variable is the weighted
average of all possible values that this random
variable can take on.
The weights used in computing this average
correspond to the probabilities.
Expected Value
The expected value may be intuitively understood
by the law of large numbers:
the expected value, when it exists, is almost surely
the limit of the sample mean as sample size grows
to infinity.
Expected Value
It can be interpreted as the long-run average of
the results of many independent repetitions of an
experiment
(e.g. a dice roll, Coin Flip, etc).
Note: the value may not be expected in the ordinary sense—the "expected
value" itself may be unlikely or even impossible (such as having 2.5
children), just like the sample mean.
Why Is Expected
Value Useful?
Do NOT PLAY GAMES WITH A
NEGATIVE EXPECTED VALUE AS YOU WILL
EVENTUALLY LOSE AS
N > +∞-
Expected Value for Dice
What is the Expected # of Pips?
What is xi in this Case?
What is pi in this Case?
Expected Value for Dice
What is the Expected # of Pips?
What is xi in this Case?
What is pi in this Case?
Each Pip
Expected Value for Dice
What is the Expected # of Pips?
What is xi in this Case?
What is pi in this Case?
Each Pip
Prob of Each Pip
Expected Value for Dice
What is the Expected # of Pips?
What is xi in this Case?
What is pi in this Case?
Each Pip
Prob of Each Pip
Expected Value for Dice
Simulation of Long Expected Value
(Expectation) for Dice Value
Expected Value for Dice
Notice It Takes A Number of Trials Before
Rough Convergence on the Expected Value
Expected Value
For Roulette
Expected Value
For Roulette
What is the Expected Value for
Betting 0 if the Payout is 35to1?
Work Through this Problem
Out Your Own
Expected Value
For Roulette
What is the Expected Value for
Betting 0 if the Payout is 35to1?
Now Try This Problem
Expected Value
For Roulette
What is the Expected Value for
Betting 0 if the Payout is 35to1?
Expected Value
For Roulette
What is the Expected Value for
Betting 0 if the Payout is 35to1?
Expected Value
For Roulette
What is the Expected Value for
Betting 0 if the Payout is 35to1?
Daniel Martin Katz
@ computational
computationallegalstudies.com
lexpredict.com
danielmartinkatz.com
illinois tech - chicago kent college of law@

Quantitative Methods for Lawyers - Class #7 - Probability & Basic Statistics (Part II) - Professor Daniel Martin Katz

  • 1.
    Quantitative Methods for Lawyers Probability & Basic Statistics(Part 2) Class #7 @ computational computationallegalstudies.com professor daniel martin katz danielmartinkatz.com lexpredict.com slideshare.net/DanielKatz
  • 2.
    Quick Word: Sample Statisticsv. Population Parameters If it is a variable whose measurement is derived from a sample, it is a sample statistic. If it is a variable whose measurement is derived from a population, it is a population parameter.
  • 3.
    Last Time WeSaw “X Bar” Technically this is the Notation for a Sample Mean But I wanted to wait to Discuss this until now ... Quick Word: Sample Statistics v. Population Parameters
  • 4.
  • 5.
    Variance Mean is theFirst Moment of a Distribution Variance is the Second Moment of a Distribution
  • 6.
    Variance Population Variance Formula SampleVariance Formula Notice the Notation Notice the Notation
  • 7.
    Variance (1) Calculate themean (2) Calculate the difference between each number and its mean (3) Calculate the square of each difference in step #2 (4) Calculate the sum of all the squares in step #3 (5) Take the Sum in Step #4 and Divide By Either Sample or Population Variance Denominator
  • 8.
    Variance (1) Calculate themean (6+ 9+ 8 + 9 + 2)/5 = 34/5 = 6.8 Using These Numbers: 6, 9, 8, 9, 2
  • 9.
    Variance 2) Calculate thedifference between each number and its mean: (6 - 6.8), (9 - 6.8), (8 - 6.8), (9 - 6.8), (2 - 6.8) = -0.8, 2.2, 1.2, 2.2, -4.8 Using These Numbers: 6, 9, 8, 9, 2
  • 10.
    Variance Using These Numbers: 6,9, 8, 9, 2 (3) Calculate the square of each difference in step #2 (-0.8)*(-0.8), (2.2)*(2.2), (1.2)*(1.2), (2.2)*(2.2), (-4.8)*(-4.8) = 0.64, 4.84, 1.44, 4.84, 23.04
  • 11.
    Variance (4) Calculate thesum of all the squares in step #3 0.64 + 4.84 + 1.44 + 4.84 + 23.04 = 34.8 Using These Numbers: 6, 9, 8, 9, 2
  • 12.
    Variance (5) Take theSum in Step #4 and Divide By Either Sample or Population Variance Denominator Assume this is a Sample and thus the Formula is sample size - 1 Variance = 34.8/(5-1) = 34.8/4 = 8.7 Note: If Population Var = 6.96 Using These Numbers: 6, 9, 8, 9, 2
  • 13.
    Variance Please Get inSmall Groups and Calculate the Sample Variance By Hand for the Following Data Set: 3, 8, 12, 22, 34, 45, 48, 58
  • 14.
    Variance (1) Calculate themean (3 + 8 + 12 + 22 + 34+ 45 +48 + 58) /8 = 230/8 = 28.75 Using These Numbers: 3, 8, 12, 22, 34, 45, 48, 58
  • 15.
    Variance (2) Calculate thedifference between each number and its m (3 - 28.75), (8 - 28.75), (12 - 28.75), (22 - 28.75), (34 - 28.75) , (45 - 28.75) (48 - 28.75) (58 - 28.75) = -25.75, 20.75, -16.75, -6.75, +5.25 +16.25, +19.25 +29.25 Using These Numbers: 3, 8, 12, 22, 34, 45, 48, 58
  • 16.
    Variance (3) Calculate thesquare of each difference in step #2 (-25.75)2 , (-20.75)2 , (-16.75)2 , (-6.75)2 , (5.25) 2 (16.25) 2 , (19.25)2 , (29.25) 2 Using These Numbers: 3, 8, 12, 22, 34, 45, 48, 58 663.0625, 430.5625 , 280.5625, 45.5625, 27.5625, 264.0625, 370.5625 , 855.5625
  • 17.
    Variance (4) Calculate thesum of all the squares in step #3 663.0625 +430.5625 + 280.5625 + 45.5625 + 27.5625+ 264.0625 + 370.5625 + 855.5625 = 2937.5 Using These Numbers: 3, 8, 12, 22, 34, 45, 48, 58
  • 18.
    Variance (5) Take theSum in Step #4 and Divide By Either Sample or Population Variance Denominator Assume this is a Sample and thus the Formula is sample size - 1 Variance = 2937.5/(8-1) = 2937.5/(8-1) = 419.64 Using These Numbers: 3, 8, 12, 22, 34, 45, 48, 58
  • 19.
    Variance Please Get inSmall Groups and Calculate the Sample Variance By Hand for the Following Data Set: 3, 8, 12, 22, 34, 45, 48, 58 ~419.6
  • 20.
    Standard Deviation Again, wehave the Sample v. Population Notation Distinction
  • 21.
    Standard Deviation Standard deviationis a widely used measure of variability or diversity used in statistics and probability theory. It shows how much variation or "dispersion" exists from the average (mean, or expected value). A low standard deviation indicates that the data points tend to be very close to the mean, whereas high standard deviation indicates that the data points are spread out over a large range of values.
  • 22.
    Visual Display of TwoDistributions Again, Standard Deviation Captures the Spread / dispersion from the Mean
  • 23.
    Standard Deviation Standard Deviationis the Square Root of the Variance ... Sample Variance Formula Sample Standard deviation Formula
  • 24.
    Standard Deviation Using TheseNumbers: 3, 8, 12, 22, 34, 45, 48, 58 ~419.64 And This Formula: = We Obtained This Result
  • 25.
    Standard Deviation (Sample StandardDeviation Formula) So We Just Need to Take the Root of This Result As Follows: 419.64 Voilà - Our Result 20.48 (Insert Our Prior Result)
  • 26.
    Standard Deviation Standard deviationis only used to measure spread or dispersion around the mean of a data set. Standard deviation is never negative. Standard deviation is sensitive to outliers. A single outlier can raise the standard deviation and in turn, distort the picture of spread. For data with approximately the same mean, the greater the spread, the greater the standard deviation. Note: If all values of a data set are the same, the standard deviation is zero (because each value is equal to the mean).
  • 27.
    Standard Deviation In theNormal Distribution 68.2% of Data in +/- 1SD 95.4 of Data in +/- 2SD 99.7 of Data in +/- 3SD
  • 28.
  • 29.
    Expected Value the expectedvalue (or expectation, or mathematical expectation, or mean, or the first moment) of a random variable is the weighted average of all possible values that this random variable can take on. The weights used in computing this average correspond to the probabilities.
  • 30.
    Expected Value The expectedvalue may be intuitively understood by the law of large numbers: the expected value, when it exists, is almost surely the limit of the sample mean as sample size grows to infinity.
  • 31.
    Expected Value It canbe interpreted as the long-run average of the results of many independent repetitions of an experiment (e.g. a dice roll, Coin Flip, etc). Note: the value may not be expected in the ordinary sense—the "expected value" itself may be unlikely or even impossible (such as having 2.5 children), just like the sample mean.
  • 32.
    Why Is Expected ValueUseful? Do NOT PLAY GAMES WITH A NEGATIVE EXPECTED VALUE AS YOU WILL EVENTUALLY LOSE AS N > +∞-
  • 33.
    Expected Value forDice What is the Expected # of Pips? What is xi in this Case? What is pi in this Case?
  • 34.
    Expected Value forDice What is the Expected # of Pips? What is xi in this Case? What is pi in this Case? Each Pip
  • 35.
    Expected Value forDice What is the Expected # of Pips? What is xi in this Case? What is pi in this Case? Each Pip Prob of Each Pip
  • 36.
    Expected Value forDice What is the Expected # of Pips? What is xi in this Case? What is pi in this Case? Each Pip Prob of Each Pip
  • 37.
    Expected Value forDice Simulation of Long Expected Value (Expectation) for Dice Value
  • 38.
    Expected Value forDice Notice It Takes A Number of Trials Before Rough Convergence on the Expected Value
  • 39.
  • 40.
    Expected Value For Roulette Whatis the Expected Value for Betting 0 if the Payout is 35to1?
  • 41.
    Work Through thisProblem Out Your Own
  • 42.
    Expected Value For Roulette Whatis the Expected Value for Betting 0 if the Payout is 35to1?
  • 43.
    Now Try ThisProblem
  • 44.
    Expected Value For Roulette Whatis the Expected Value for Betting 0 if the Payout is 35to1?
  • 45.
    Expected Value For Roulette Whatis the Expected Value for Betting 0 if the Payout is 35to1?
  • 46.
    Expected Value For Roulette Whatis the Expected Value for Betting 0 if the Payout is 35to1?
  • 47.
    Daniel Martin Katz @computational computationallegalstudies.com lexpredict.com danielmartinkatz.com illinois tech - chicago kent college of law@