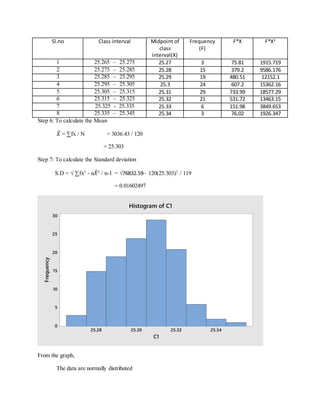
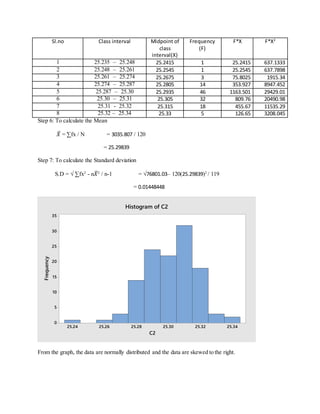
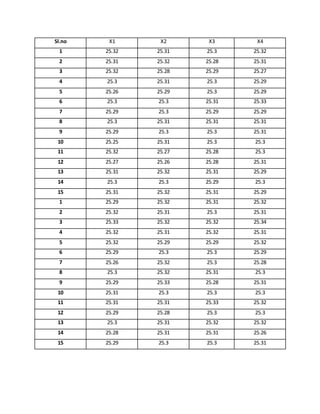
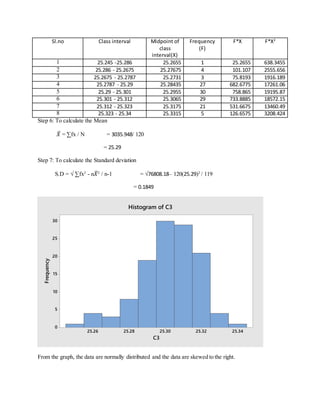
The document contains a table with 15 observations of 4 variables (X1, X2, X3, X4) measured for each of 3 datasets (a total of 120 observations). The mean, standard deviation, and distribution of the data were calculated for each dataset. For all datasets, the data were found to be normally distributed. Datasets 2 and 3 were skewed slightly to the right. The standard deviations ranged from 0.01 to 0.18, indicating little variance among the observations within each dataset.