Downloaded 565 times


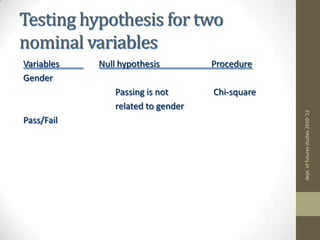


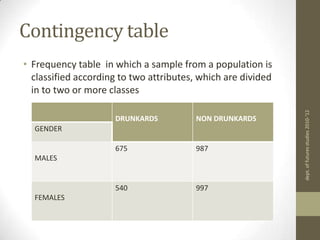
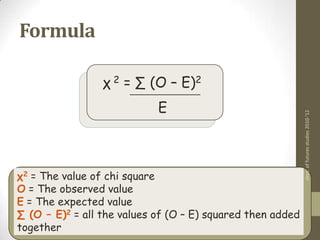
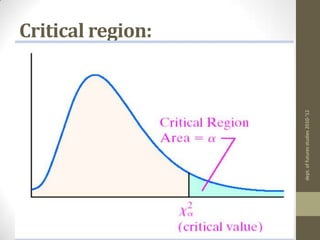
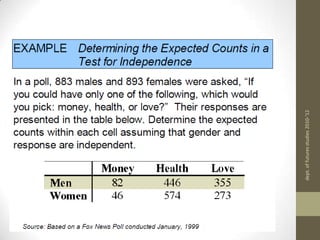
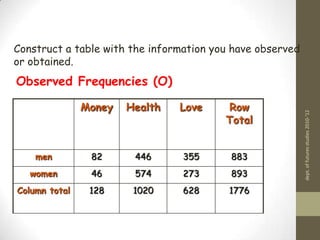
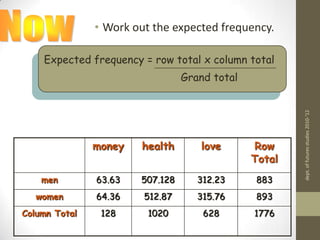
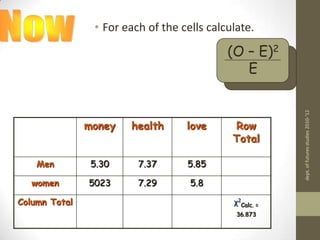
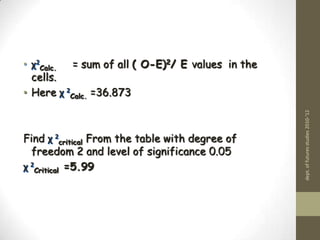
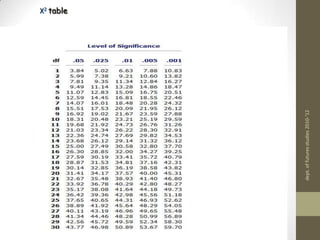


1) The chi-square test of independence is used to determine if there is a relationship between two categorical variables. It compares observed frequencies to expected frequencies if the null hypothesis of independence is true. 2) A contingency table is constructed with the observed frequencies. Expected frequencies are calculated for each cell based on row and column totals and the grand total. 3) The chi-square statistic is calculated by summing the squared differences between observed and expected frequencies divided by the expected frequency for each cell. This value is then compared to a critical value from the chi-square distribution to determine if the null hypothesis should be rejected.