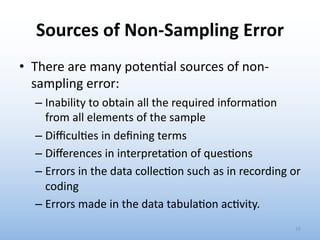
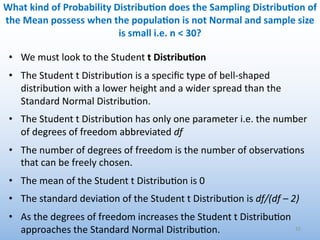
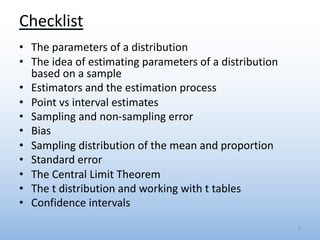
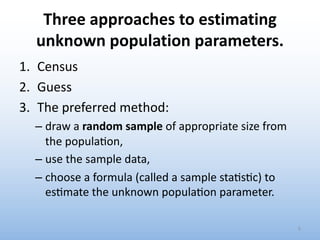
The document provides an overview of key concepts related to estimation in statistics, including:
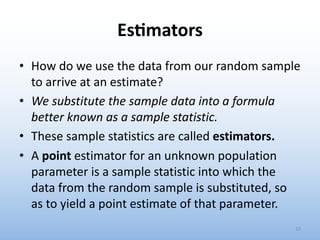
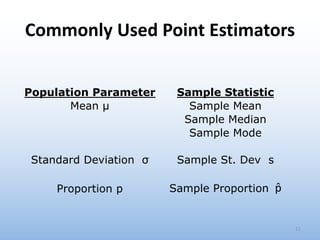
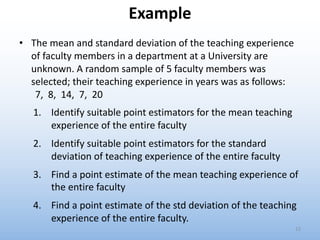
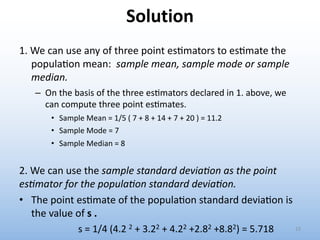
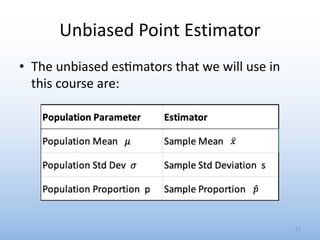
- Estimation involves using sample data to estimate unknown population parameters. Common estimators include the sample mean, proportion, and standard deviation.
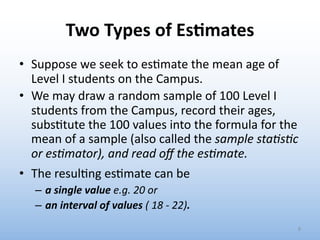
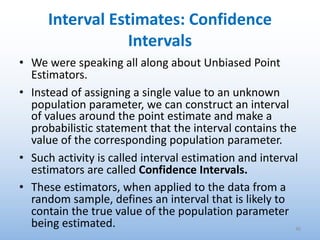
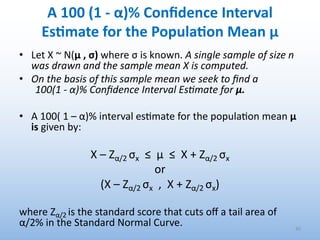
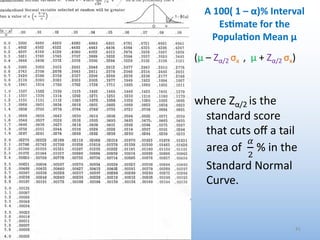
- There are two main types of estimates - point estimates and interval estimates. Point estimates are single values while interval estimates specify a range.
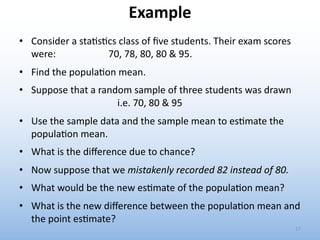
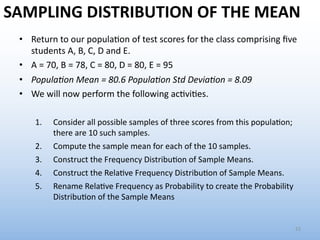
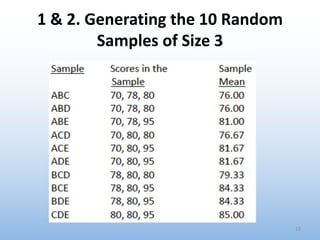
- The process of estimation involves identifying the parameter, selecting a random sample, choosing an estimator, and calculating the estimate.
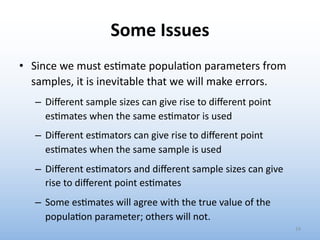
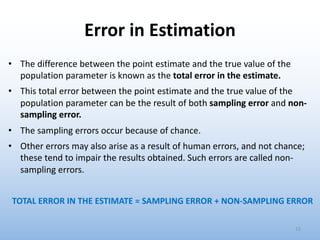
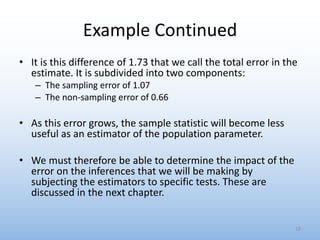
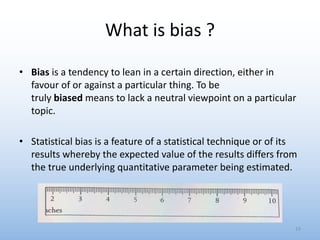
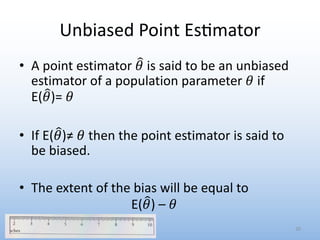
- Estimates can differ from the true population value due to sampling error and non-sampling error. Bias occurs when the expected value of the estimate differs from the true parameter value.
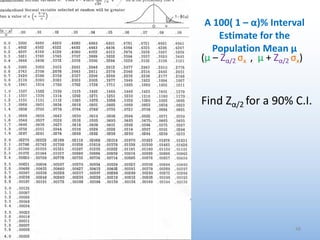
This document provides an introduction to biostatistics. It outlines several key objectives of a biostatistics course including understanding descriptive statistics, statistical inference, common tests and their assumptions. It defines important statistical concepts like population, sample, parameters, statistics, variables, and types of statistical analysis. Descriptive statistics are used to summarize data, while inferential statistics allow generalizing from samples to populations. Examples of potential statistical abuses are also provided.
Statistical Learning and Model Selection (1).pptxrajalakshmi5921
This document discusses statistical learning and model selection. It introduces statistical learning problems, statistical models, the need for statistical modeling, and issues around evaluating models. Key points include: statistical learning involves using data to build a predictive model; a good model balances bias and variance to minimize prediction error; cross-validation is described as the ideal procedure for evaluating models without overfitting to the test data.
This ppt includes basic concepts about data types, levels of measurements. It also explains which descriptive measure, graph and tests should be used for different types of data. A brief of Pivot tables and charts is also included.
This document summarizes quantitative data analysis techniques for summarizing data from samples and generalizing to populations. It discusses variables, simple and effect statistics, statistical models, and precision of estimates. Key points covered include describing data distribution through plots and statistics, common effect statistics for different variable types and models, ensuring model fit, and interpreting precision, significance, and probability to generalize from samples.
Census
Everyone in population
Eg. All Cambodian residents
Population
is a set of persons (or objects) having a common observable characteristic.
the entire collection of units about which we would like information
Sample
is a representative subject (subgroup) of a population.
the collection of units we actually measure
Example:
If we want to know many persons in a community
have quit smoking or
have health insurance or
plan to vote for a certain candidate,
Sample
is a representative subject (subgroup) of a population.
the collection of units we actually measure
Example:
If we want to know many persons in a community
have quit smoking or
have health insurance or
plan to vote for a certain candidate,
Sample
is a representative subject (subgroup) of a population.
the collection of units we actually measure
Example:
If we want to know many persons in a community
have quit smoking or
have health insurance or
plan to vote for a certain candidate,
Sample
is a representative subject (subgroup) of a population.
the collection of units we actually measure
Example:
If we want to know many persons in a community
have quit smoking or
have health insurance or
plan to vote for a certain candidate,
Sample
is a representative subject (subgroup) of a population.
the collection of units we actually measure
Example:
If we want to know many persons in a community
have quit smoking or
have health insurance or
plan to vote for a certain candidate,
Sample
is a representative subject (subgroup) of a population.
the collection of units we actually measure
Example:
If we want to know many persons in a community
have quit smoking or
have health insurance or
plan to vote for a certain candidate,
Sample
is a representative subject (subgroup) of a population.
the collection of units we actually measure
Example:
If we want to know many persons in a community
have quit smoking or
have health insurance or
plan to vote for a certain candidate,
Sample
is a representative subject (subgroup) of a population.
the collection of units we actually measure
Example:
If we want to know many persons in a community
have quit smoking or
have health insurance or
plan to vote for a certain candidate,
Statistical inference is the process by which we draw conclusions about a population from data collected on a sample.
In medical research
Population
All patients candidate for treatment
Sample
All patients candidate for treatment who volunteer for your study
Infer results from volunteers (sample) to other candidates for the same treatment (population).
We usually obtain information on an appropriate sample of the community and generalize from it to the entire population.
The way the sample is selected, not its size, determines whether we may draw appropriate inferences about a population.
The primary reason for selecting a sample from a population is to draw inferences about that population.
Statistical inference is the process by which we infer
We review important concepts from Chapters 1-5 of the statistics textbook.
1) Descriptive statistics summarize sample data, while inferential statistics make predictions about populations from samples.
2) Variables can be categorical (nominal, ordinal) or quantitative (continuous, discrete), which affects analysis methods.
3) Random sampling and random assignment in experiments reduce bias to obtain reliable data.
4) Probability distributions, the normal distribution, and the Central Limit Theorem are important concepts for statistical inference.
The document discusses various sampling techniques used in business research including probability and non-probability sampling. It explains different types of probability sampling such as simple random sampling, systematic sampling, stratified sampling, cluster sampling, and sampling with probability proportional to size. It also covers non-probability sampling techniques like convenience sampling, purposive sampling, quota sampling, and snowball sampling. The document provides guidelines on selecting appropriate sampling techniques based on factors like the type of research, relative magnitude of sampling and non-sampling errors, population homogeneity, and operational considerations.
This document provides an overview and summary of key concepts from chapters 10 and 11 of the book "How to Design and Evaluate Research in Education". It discusses both descriptive and inferential statistics. For descriptive statistics, it defines common measures like mean, median, standard deviation, and explains how they are used to summarize sample data. For inferential statistics, it outlines statistical techniques like hypothesis testing, confidence intervals, and parametric and nonparametric tests that allow researchers to generalize from samples to populations. It provides examples of how these statistical concepts are applied in educational research.
This document discusses several common problems with data handling and quality including building and testing models with the same data, confusion between biological and technical replicates, and identification and handling of outliers. It provides examples and explanations of key concepts such as experimental and sampling units, pseudo-replication, outliers versus high influence points, and leverage plots. The importance of proper data handling techniques like dividing data into training, test, and confirmation sets and using cross-validation is emphasized to avoid overfitting models and generating spurious findings.
This document discusses potential sources of missing data in meta-analyses, including studies not being found, outcomes not being fully reported, missing standard deviations or other information needed for the meta-analysis, and missing participants. It also covers concepts related to missing data like whether it is missing completely at random, missing at random, or informatively missing. Strategies for dealing with missing data include simple or multiple imputation as well as sensitivity analyses. Specific examples discussed include imputing missing standard deviations or correlation coefficients.
Statistical concepts and their applications in various fields:
- Statistics involves collecting and analyzing numerical data to draw valid conclusions. It requires careful research planning and design.
- Descriptive statistics summarize data through measures of central tendency (mean, median, mode) and variability (range, standard deviation).
- Inferential statistics test hypotheses and make estimates about populations based on samples.
- Biostatistics is applied in community medicine, public health, cancer research, pharmacology, and demography to study disease trends, treatment effectiveness, and population attributes. It is also used in advanced biomedical technologies and ecology.
1. An independent samples t-test was conducted to determine if there were differences in anxiety scores between male and female participants before a major competition.
2. The results of the t-test showed no significant difference between the mean anxiety scores of males (M=17, SD=4.58) and females (M=18, SD=3.16), t(8)=0.41, p>0.05.
3. Therefore, the null hypothesis that there is no difference between male and female anxiety scores before a major competition was not rejected.
Statistical Learning and Model Selection module 2.pptxnagarajan740445
Statistical learning theory was introduced in the 1960s as a problem of function estimation from data. In the 1990s, new learning algorithms like support vector machines were proposed based on the developed theory, making statistical learning theory a tool for both theoretical analysis and creating practical algorithms. Cross-validation techniques like k-fold and leave-one-out cross-validation help estimate a model's predictive performance and avoid overfitting by splitting data into training and test sets. The goal is to find the right balance between bias and variance to minimize prediction error on new data.
The document discusses methods for determining sample sizes in qualitative and quantitative studies. For qualitative studies, the sample size is usually small and taken until theoretical saturation is reached. Judgment sampling is most common. For quantitative studies, sample size is determined based on the level of precision, confidence level, population variability, and external validity. Formulas can be used to calculate sample sizes for proportions, with corrections for finite populations. Software can also assist with determining quantitative sample sizes based on study details.
This document discusses sampling techniques and concepts in statistics. It begins by outlining learning objectives related to sampling, errors, and statistical analysis. It then discusses reasons for sampling such as saving money and time compared to a census. The document contrasts random and non-random sampling methods. It provides examples of random sampling techniques including simple random sampling, systematic random sampling, stratified random sampling, and cluster sampling. It also discusses non-random convenience sampling and sources of non-sampling errors. Finally, it introduces the concepts of sampling distributions and the central limit theorem, and provides examples of using normal approximations.
This chapter introduces statistical inference and how it is used to make statements about population characteristics based on sample data. It discusses the differences between descriptive and inferential statistics, and how inferential statistics is used for estimation and hypothesis testing. It also explains key concepts like random sampling, sample statistics, population parameters, sampling distributions, sampling error, and how the central limit theorem allows inferring characteristics of the population from a sample as long as the sample size is at least 30.
This document provides an introduction to key concepts in data management and statistics. It discusses variables, levels of measurement, measures of central tendency (mean, median, mode), measures of variability (range, standard deviation, variance), and shapes of distributions. Descriptive and inferential statistics are introduced. The importance of understanding statistics in research and everyday life is highlighted. Proper data collection methods and potential misuses of statistics are also covered.
This document provides an overview of key statistical concepts for a regression analysis course, including:
- Distributions of sample data and how to visualize them with histograms.
- The difference between populations and samples, and how samples are used to make inferences about populations.
- Key terms like parameters, statistics, and estimators - where parameters are population values, statistics are calculated from samples, and estimators are used to estimate parameters.
- The importance of random sampling and how properties of estimators like unbiasedness, consistency, and minimum variance relate to how accurately they estimate population parameters.
GROUP 1 biostatistics ,sample size and epid.pptxEmma910932
The document discusses sample size determination in epidemiological studies. It defines key terms like sample, sample size, and reasons for determining sample size such as allowing for appropriate analysis and providing an accurate level of precision. Methods for determining sample size discussed include using the entire population (census), published sample sizes, and formulas. Several formulas are provided for estimating sample sizes needed for different study designs like descriptive studies and studies estimating a mean or proportion. Steps for using the formulas are outlined.
This document provides an overview of regression techniques in machine learning. It discusses:
1) Regression problems involve predicting numeric variables based on observed values. Different regression techniques make predictions based on the number and type of input variables and the shape of the regression line.
2) Simple linear regression uses one continuous input variable, multivariate linear regression uses multiple input variables, and polynomial regression models higher-order relationships between variables.
3) The document also discusses errors in machine learning models and concepts related to bias and variance, including how the bias-variance tradeoff optimizes model performance.
This document provides an overview of key concepts regarding the distribution of sample means. It discusses how the distribution of sample means approaches a normal shape as sample size increases based on the central limit theorem. The mean of this distribution is equal to the population mean, making the sample mean an unbiased statistic. The variability of the distribution is measured by the standard error, which decreases as sample size increases. The document shows how to calculate a z-score for a sample mean based on the standard error in order to determine the probability of obtaining a sample with a given mean. It previews how these concepts will be applied in inferential statistics.
This document discusses various concepts related to errors and accuracy in chemical analysis. It defines different types of errors like gross errors, systematic errors, and random errors. It explains how to classify errors based on their origin and how to minimize different types of errors. The document also covers key statistical concepts like mean, median, standard deviation, normal distribution, precision and accuracy that are important for understanding errors in chemical analysis.
This document discusses sample design and the t-test. It covers the sample design process which includes defining the population, sample frame, sample size, and sampling procedure. It also discusses probability and non-probability sampling techniques. The document then explains what a t-test is and how it can be used to test for differences between two group means. It covers the assumptions, procedures, hypotheses, and interpretation of t-test results.
Nazi ideology promoted the idea that Germans, or Aryans, were the master race, and that Jews and other non-Aryans were inferior. This led the Nazis to implement increasingly oppressive policies against Jews in Germany, including the Nuremberg Laws restricting their rights, Kristallnacht attacking Jewish businesses, and forcing Jews to wear badges and live in ghettos. Ultimately, the Nazis pursued the "Final Solution" of systematically exterminating Jews through concentration and death camps like Auschwitz, resulting in the deaths of approximately 6 million Jews during the Holocaust.
This document discusses consumer choice theory and the concept of indifference curves. It covers several key topics:
1) Consumers seek to maximize satisfaction by equalizing the marginal utility per unit of expenditure across all goods purchased, given prices and income constraints.
2) Indifference curves depict combinations of goods that provide equal satisfaction or utility to the consumer.
3) A budget constraint shows the combinations of goods that can be purchased given income levels. Consumers optimize by choosing the highest indifference curve possible within their budget set.
The document discusses supply and demand in economics. It defines demand as the desire, ability, and willingness to buy a product, and supply as the desire, ability, and willingness to offer products for sale. It describes the laws of supply and demand - as price increases, quantity demanded decreases and quantity supplied increases. Non-price factors can cause shifts in supply and demand curves. The goal of markets is to reach equilibrium where quantity supplied equals quantity demanded. Surpluses and shortages occur when supply and demand are not equal. Demand elasticity refers to how responsive quantity demanded is to price changes.
This document provides an overview of the British and American systems of government. It discusses the sources of authority in Britain, including constitutional conventions, acts of parliament, and opinions of judges. Key aspects of the British system covered include the supremacy of parliament, the monarchy, parliament, the cabinet and ministers, and the judiciary. For the American system, the document outlines the US Constitution and bill of rights, the presidency, the electoral college process, the congress, and the US Supreme Court.
This document defines key concepts related to sets, including:
- A set is a collection of distinct objects called elements. Capital letters denote sets and lowercase denote elements.
- The empty set, denoted Ø or {}, contains no elements. Finite sets can be counted, infinite sets cannot.
- Two sets are equal if they contain the same elements. A subset contains elements that also belong to another set.
- The union of sets contains elements in either set. The intersection contains elements common to both sets. The complement of a set contains all elements not in the original set.
- Venn diagrams use circles or ovals to represent sets visually and show relationships like intersections and unions.
This document provides an overview and introduction to an economics statistics course. It discusses key topics that will be covered in the course, including:
- Descriptive and inferential statistics
- Probability theory as the bridge between descriptive and inferential statistics
- The process of statistical investigation from designing experiments/surveys to making inferences and assessing reliability
- Examples of how statistics is used to analyze data and make decisions in various fields like government, business, and research.
Digital Marketing with a Focus on Sustainabilitysssourabhsharma
Digital Marketing best practices including influencer marketing, content creators, and omnichannel marketing for Sustainable Brands at the Sustainable Cosmetics Summit 2024 in New York
Best Competitive Marble Pricing in Dubai - ☎ 9928909666Stone Art Hub
Stone Art Hub offers the best competitive Marble Pricing in Dubai, ensuring affordability without compromising quality. With a wide range of exquisite marble options to choose from, you can enhance your spaces with elegance and sophistication. For inquiries or orders, contact us at ☎ 9928909666. Experience luxury at unbeatable prices.
SATTA MATKA SATTA FAST RESULT KALYAN TOP MATKA RESULT KALYAN SATTA MATKA FAST RESULT MILAN RATAN RAJDHANI MAIN BAZAR MATKA FAST TIPS RESULT MATKA CHART JODI CHART PANEL CHART FREE FIX GAME SATTAMATKA ! MATKA MOBI SATTA 143 spboss.in TOP NO1 RESULT FULL RATE MATKA ONLINE GAME PLAY BY APP SPBOSS
4 Benefits of Partnering with an OnlyFans Agency for Content Creators.pdfonlyfansmanagedau
In the competitive world of content creation, standing out and maximising revenue on platforms like OnlyFans can be challenging. This is where partnering with an OnlyFans agency can make a significant difference. Here are five key benefits for content creators considering this option:
Best practices for project execution and deliveryCLIVE MINCHIN
A select set of project management best practices to keep your project on-track, on-cost and aligned to scope. Many firms have don't have the necessary skills, diligence, methods and oversight of their projects; this leads to slippage, higher costs and longer timeframes. Often firms have a history of projects that simply failed to move the needle. These best practices will help your firm avoid these pitfalls but they require fortitude to apply.
Discover innovative uses of Revit in urban planning and design, enhancing city landscapes with advanced architectural solutions. Understand how architectural firms are using Revit to transform how processes and outcomes within urban planning and design fields look. They are supplementing work and putting in value through speed and imagination that the architects and planners are placing into composing progressive urban areas that are not only colorful but also pragmatic.
HR search is critical to a company's success because it ensures the correct people are in place. HR search integrates workforce capabilities with company goals by painstakingly identifying, screening, and employing qualified candidates, supporting innovation, productivity, and growth. Efficient talent acquisition improves teamwork while encouraging collaboration. Also, it reduces turnover, saves money, and ensures consistency. Furthermore, HR search discovers and develops leadership potential, resulting in a strong pipeline of future leaders. Finally, this strategic approach to recruitment enables businesses to respond to market changes, beat competitors, and achieve long-term success.
Storytelling is an incredibly valuable tool to share data and information. To get the most impact from stories there are a number of key ingredients. These are based on science and human nature. Using these elements in a story you can deliver information impactfully, ensure action and drive change.
Anny Serafina Love - Letter of Recommendation by Kellen Harkins, MS.AnnySerafinaLove
This letter, written by Kellen Harkins, Course Director at Full Sail University, commends Anny Love's exemplary performance in the Video Sharing Platforms class. It highlights her dedication, willingness to challenge herself, and exceptional skills in production, editing, and marketing across various video platforms like YouTube, TikTok, and Instagram.
[To download this presentation, visit:
https://www.oeconsulting.com.sg/training-presentations]
This PowerPoint compilation offers a comprehensive overview of 20 leading innovation management frameworks and methodologies, selected for their broad applicability across various industries and organizational contexts. These frameworks are valuable resources for a wide range of users, including business professionals, educators, and consultants.
Each framework is presented with visually engaging diagrams and templates, ensuring the content is both informative and appealing. While this compilation is thorough, please note that the slides are intended as supplementary resources and may not be sufficient for standalone instructional purposes.
This compilation is ideal for anyone looking to enhance their understanding of innovation management and drive meaningful change within their organization. Whether you aim to improve product development processes, enhance customer experiences, or drive digital transformation, these frameworks offer valuable insights and tools to help you achieve your goals.
INCLUDED FRAMEWORKS/MODELS:
1. Stanford’s Design Thinking
2. IDEO’s Human-Centered Design
3. Strategyzer’s Business Model Innovation
4. Lean Startup Methodology
5. Agile Innovation Framework
6. Doblin’s Ten Types of Innovation
7. McKinsey’s Three Horizons of Growth
8. Customer Journey Map
9. Christensen’s Disruptive Innovation Theory
10. Blue Ocean Strategy
11. Strategyn’s Jobs-To-Be-Done (JTBD) Framework with Job Map
12. Design Sprint Framework
13. The Double Diamond
14. Lean Six Sigma DMAIC
15. TRIZ Problem-Solving Framework
16. Edward de Bono’s Six Thinking Hats
17. Stage-Gate Model
18. Toyota’s Six Steps of Kaizen
19. Microsoft’s Digital Transformation Framework
20. Design for Six Sigma (DFSS)
To download this presentation, visit:
https://www.oeconsulting.com.sg/training-presentations
How are Lilac French Bulldogs Beauty Charming the World and Capturing Hearts....Lacey Max
“After being the most listed dog breed in the United States for 31
years in a row, the Labrador Retriever has dropped to second place
in the American Kennel Club's annual survey of the country's most
popular canines. The French Bulldog is the new top dog in the
United States as of 2022. The stylish puppy has ascended the
rankings in rapid time despite having health concerns and limited
color choices.”
IMPACT Silver is a pure silver zinc producer with over $260 million in revenue since 2008 and a large 100% owned 210km Mexico land package - 2024 catalysts includes new 14% grade zinc Plomosas mine and 20,000m of fully funded exploration drilling.
The Steadfast and Reliable Bull: Taurus Zodiac Signmy Pandit
Explore the steadfast and reliable nature of the Taurus Zodiac Sign. Discover the personality traits, key dates, and horoscope insights that define the determined and practical Taurus, and learn how their grounded nature makes them the anchor of the zodiac.
The Most Inspiring Entrepreneurs to Follow in 2024.pdfthesiliconleaders
In a world where the potential of youth innovation remains vastly untouched, there emerges a guiding light in the form of Norm Goldstein, the Founder and CEO of EduNetwork Partners. His dedication to this cause has earned him recognition as a Congressional Leadership Award recipient.
Industrial Tech SW: Category Renewal and CreationChristian Dahlen
Every industrial revolution has created a new set of categories and a new set of players.
Multiple new technologies have emerged, but Samsara and C3.ai are only two companies which have gone public so far.
Manufacturing startups constitute the largest pipeline share of unicorns and IPO candidates in the SF Bay Area, and software startups dominate in Germany.
Garments ERP Software in Bangladesh _ Pridesys IT Ltd.pdfPridesys IT Ltd.
Pridesys Garments ERP is one of the leading ERP solution provider, especially for Garments industries which is integrated with
different modules that cover all the aspects of your Garments Business. This solution supports multi-currency and multi-location
based operations. It aims at keeping track of all the activities including receiving an order from buyer, costing of order, resource
planning, procurement of raw materials, production management, inventory management, import-export process, order
reconciliation process etc. It’s also integrated with other modules of Pridesys ERP including finance, accounts, HR, supply-chain etc.
With this automated solution you can easily track your business activities and entire operations of your garments manufacturing
proces
2. Checklist
• The parameters of a distribution
• The idea of estimating parameters of a distribution
based on a sample
• Estimators and the estimation process
• Point vs interval estimates
• Sampling and non-sampling error
• Bias
• Sampling distribution of the mean and proportion
• Standard error
• The Central Limit Theorem
• The t distribution and working with t tables
• Confidence intervals
2
3. Introduc1on
• Inference
– “a conclusion reached on the
basis of evidence and reasoning.”
• Inferen0al sta0s0cs:
– Allows us to make decisions
about some characteris4cs of a
popula4on based on sample
informa4on.
– I.e. we draw conclusions about a
popula4on based on a sample. 3
4. Introduc1on
• We have discussed the characteris.cs and proper.es of
the probability distribu.ons of random variables
• These characteris.cs were the parameters:
– n and p for the Binomial Distribu4on
– λ for the Poisson Distribu4on
– μ and σ for the Normal Distribu4on
• In the real world we o;en don’t know the values of
these parameters and will have to es.mate them.
• Three key words:
–Es#ma#on(the process)
–Es#mate (the result)
–Es#mator (the facilitator)
4
5. Three approaches to estimating
unknown population parameters.
1. Census
2. Guess
3. The preferred method:
– draw a random sample of appropriate size from
the popula4on,
– use the sample data,
– choose a formula (called a sample sta4s4c) to
es4mate the unknown popula4on parameter.
5
6. Defini&on of Es&ma&on
Es#ma#on is the process by which we
es0mate the value of an unknown popula0on
parameter by making use of the data from a
random sample that was drawn from that
Popula0on.
6
7. THE ESTIMATION PROCESS
1. Iden'fy the Unknown Popula'on Parameter
2. Decide on the Size of the Random Sample: n
3. Select the Random Sample of Size n
4. Choose an Appropriate Sample Sta's'c [Es#mator]
5. Subs'tute the Sample Data into the Sample Sta's'c
6. Calculate the es'mate and interpret
7
8. Two Types of Es&mates
• Suppose we seek to es.mate the mean age of
Level I students on the Campus.
• We may draw a random sample of 100 Level I
students from the Campus, record their ages,
subs.tute the 100 values into the formula for the
mean of a sample (also called the sample sta)s)c
or es)mator), and read off the es)mate.
• The resul.ng es.mate can be
– a single value e.g. 20 or
– an interval of values ( 18 - 22).
8
9. Two Types of Es&mates
• Point es0mate
• Interval es0mate
of a popula4on parameter
9
10. Es&mators
• How do we use the data from our random sample
to arrive at an estimate?
• We substitute the sample data into a formula
better known as a sample statistic.
• These sample statistics are called estimators.
• A point estimator for an unknown population
parameter is a sample statistic into which the
data from the random sample is substituted, so
as to yield a point estimate of that parameter.
10
11. Commonly Used Point Estimators
Population Parameter Sample Statistic
Mean µ Sample Mean
Sample Median
Sample Mode
Standard Deviation σ Sample St. Dev s
Proportion p Sample Proportion p̂
11
12. Example
• The mean and standard deviation of the teaching experience
of faculty members in a department at a University are
unknown. A random sample of 5 faculty members was
selected; their teaching experience in years was as follows:
7, 8, 14, 7, 20
1. Identify suitable point estimators for the mean teaching
experience of the entire faculty
2. Identify suitable point estimators for the standard
deviation of teaching experience of the entire faculty
3. Find a point estimate of the mean teaching experience of
the entire faculty
4. Find a point estimate of the std deviation of the teaching
experience of the entire faculty.
12
13. Solution
1. We can use any of three point es'mators to es'mate the
popula'on mean: sample mean, sample mode or sample
median.
– On the basis of the three es.mators declared in 1. above, we
can compute three point es.mates.
• Sample Mean = 1/5 ( 7 + 8 + 14 + 7 + 20 ) = 11.2
• Sample Mode = 7
• Sample Median = 8
2. We can use the sample standard devia#on as the point
es#mator for the popula#on standard devia#on.
• The point es'mate of the popula'on standard devia'on is
the value of s .
s = 1/4 (4.2 2 + 3.22 + 4.22 +2.82 +8.82) = 5.718 13
14. Some Issues
• Since we must es?mate popula?on parameters from
samples, it is inevitable that we will make errors.
– Different sample sizes can give rise to different point
esRmates when the same esRmator is used
– Different esRmators can give rise to different point
esRmates when the same sample is used
– Different esRmators and different sample sizes can give
rise to different point esRmates
– Some esRmates will agree with the true value of the
populaRon parameter; others will not.
14
15. Error in Estimation
• The difference between the point estimate and the true value of the
population parameter is known as the total error in the estimate.
• This total error between the point estimate and the true value of the
population parameter can be the result of both sampling error and non-
sampling error.
• The sampling errors occur because of chance.
• Other errors may also arise as a result of human errors, and not chance;
these tend to impair the results obtained. Such errors are called non-
sampling errors.
TOTAL ERROR IN THE ESTIMATE = SAMPLING ERROR + NON-SAMPLING ERROR
15
16. Sources of Non-Sampling Error
• There are many poten0al sources of non-
sampling error:
– Inability to obtain all the required informa4on
from all elements of the sample
– Difficul4es in defining terms
– Differences in interpreta4on of ques4ons
– Errors in the data collec4on such as in recording or
coding
– Errors made in the data tabula4on ac4vity.
16
17. Example
• Consider a staRsRcs class of five students. Their exam scores
were: 70, 78, 80, 80 & 95.
• Find the populaRon mean.
• Suppose that a random sample of three students was drawn
i.e. 70, 80 & 95
• Use the sample data and the sample mean to esRmate the
populaRon mean.
• What is the difference due to chance?
• Now suppose that we mistakenly recorded 82 instead of 80.
• What would be the new esRmate of the populaRon mean?
• What is the new difference between the populaRon mean and
the point esRmate?
17
18. Example Continued
• It is this difference of 1.73 that we call the total error in the
estimate. It is subdivided into two components:
– The sampling error of 1.07
– The non-sampling error of 0.66
• As this error grows, the sample statistic will become less
useful as an estimator of the population parameter.
• We must therefore be able to determine the impact of the
error on the inferences that we will be making by
subjecting the estimators to specific tests. These are
discussed in the next chapter.
18
19. What is bias ?
• Bias is a tendency to lean in a certain direction, either in
favour of or against a particular thing. To be
truly biased means to lack a neutral viewpoint on a particular
topic.
• Statistical bias is a feature of a statistical technique or of its
results whereby the expected value of the results differs from
the true underlying quantitative parameter being estimated.
19
20. Unbiased Point Es7mator
• A point estimator !
𝜃 is said to be an unbiased
estimator of a population parameter 𝜃 if
E( !
𝜃)= 𝜃
• If E( !
𝜃)≠ 𝜃 then the point estimator is said to
be biased.
• The extent of the bias will be equal to
E( !
𝜃) – 𝜃
20
22. SAMPLING DISTRIBUTION OF THE MEAN
• Return to our popula.on of test scores for the class comprising five
students A, B, C, D and E.
• A = 70, B = 78, C = 80, D = 80, E = 95
• Popula'on Mean = 80.6 Popula'on Std Devia'on = 8.09
• We will now perform the following ac.vi.es.
1. Consider all possible samples of three scores from this popula6on;
there are 10 such samples.
2. Compute the sample mean for each of the 10 samples.
3. Construct the Frequency Distribu6on of Sample Means.
4. Construct the Rela6ve Frequency Distribu6on of Sample Means.
5. Rename Rela6ve Frequency as Probability to create the Probability
Distribu6on of the Sample Means
22
23. 1 & 2. Generating the 10 Random
Samples of Size 3
23
24. 3. The Frequency Distribution of
Sample Means
24
Sample
mean
Frequency
76.00 2
76.67 1
79.33 1
81.00 1
81.67 2
84.33 2
85.00 1
Σf= 10
25. 5. The Probability Distribu1on of
Sample Means (or The Sampling
Distribu1on of the Mean)
25
Sample
mean
Probability
76.00 0.2
76.67 0.1
79.33 0.1
81.00 0.1
81.67 0.2
84.33 0.2
85.00 0.1
Σ 1.00
Sample
mean
Frequency
76.00 2
76.67 1
79.33 1
81.00 1
81.67 2
84.33 2
85.00 1
Σf= 10
26. Sampling Distribu1ons in this Course
• In general, the probability distribu.on of a
Sample Sta.s.c is called its sampling distribu.on.
• We will focus on two sampling distribu3ons:
– Sampling Distribu0on of the Mean
– Sampling Distribu0on of the Propor0on
• In the Sampling Distribu.on of the Mean, the
random variable is the sample mean.
• In the Sampling Distribu.on of the Propor.on,
the random variable is the sample propor.on p̂
26
27. The Mean of the Sampling Distribution of the Mean
• The mean of the sampling distribution of the mean is
equal to the population mean μ.
Class Activity
• Compute the mean of the Sampling Distribution of the
Mean Score based on the ten random samples of size 3.
• Show that it is indeed equal to the population mean.
27
28. The Standard Devia1on of the
Sampling Distribu1on of the Mean
• The Standard Deviation of the Sampling Distribution of
Mean is given by σx where
• σx = σ/√n
• σx is also called the standard error.
• The spread of the Sampling Distribution of the Mean is
smaller than the spread of the corresponding
population distribution.
• The standard deviation of the Sampling Distribution of
Mean decreases as the sample size increases.
28
29. What kind of distribu2on will the Sampling Distribu2on of the Mean
have?
• If the population from which the samples are
drawn is normally distributed with mean μ and
standard deviation σ, then the Sampling
Distribution of the Mean will also be normally
distributed with mean μ and standard
deviation σx (irrespective of the sample size).
• Does the above result hold true if the
population is not normally distributed?
29
31. What kind of Probability Distribution does the Sampling Distribution
of the Mean possess when the population is not Normal ?
The Central Limit Theorem assures us that:
• If the sample size is large, the Sampling Distribution of
the Mean will be approximately normally distributed
with mean μ and standard deviation σx irrespective of
the distribution of the population.
• ‘Large’ is taken to mean n≥30
• What happens when the sample size is small i.e. n < 30?
31
32. What kind of Probability Distribu2on does the Sampling Distribu2on of
the Mean possess when the popula2on is not Normal and sample size
is small i.e. n < 30?
• We must look to the Student t Distribu2on
• The Student t DistribuRon is a specific type of bell-shaped
distribuRon with a lower height and a wider spread than the
Standard Normal DistribuRon.
• The Student t DistribuRon has only one parameter i.e. the number
of degrees of freedom abbreviated df
• The number of degrees of freedom is the number of observaRons
that can be freely chosen.
• The mean of the Student t DistribuRon is 0
• The standard deviaRon of the Student t DistribuRon is df/(df – 2)
• As the degrees of freedom increases the Student t DistribuRon
approaches the Standard Normal DistribuRon. 32
33. • If the popula0on from which the samples are
drawn is either of unknown distribu0on or not
normally distributed with mean μ and standard
devia0on σ, then the Sampling Distribu0on of the
Mean is specified by the Student t DistribuBon
with n - 1 degrees of freedom.
• The random variable of the Student t Distribu4on is given
by t where:
33
What kind of Probability Distribution does the Sampling Distribution
of the Mean possess when the population is not Normal and sample
size is small i.e. n < 30?
t =
!"#
$!
34. The Sampling Distribution of Proportion
The Sampling Distribu.on of Propor.on
• The probability distribu.on of the sample
propor.on is called the Sampling Distribu.on of
the Propor.on.
• The random variable of the Sampling Distribu.on
of the Propor.on is p̂
• The mean of the Sampling Distribu.on of the
Propor.on is the popula.on propor.on p.
• The standard devia.on of the Sampling
Distribu.on of the Propor.on is given by √(pq/n).
34
35. What is the shape of the Sampling
Distribution of the Proportion?
The Central Limit Theorem assures us that:
• If the sample size is sufficiently large, the
Sampling Distribu0on of the Propor0on will be
approximately normally distributed with mean
p and standard devia0on √(pq/n).
• Sufficiently Large means np > 5 and nq > 5.
35
36. Interval Estimates: Confidence
Intervals
• We were speaking all along about Unbiased Point
Estimators.
• Instead of assigning a single value to an unknown
population parameter, we can construct an interval
of values around the point estimate and make a
probabilistic statement that the interval contains the
value of the corresponding population parameter.
• Such activity is called interval estimation and interval
estimators are called Confidence Intervals.
• These estimators, when applied to the data from a
random sample, defines an interval that is likely to
contain the true value of the population parameter
being estimated. 36
39. Interval Estimates
• An interval that is constructed based on the confidence level is called a
confidence interval.
• A 90% Confidence Interval means a 10% significance level i.e. α = 10%
• A 95% Confidence Interval means a 5% significance level i.e. α = 5%
• Confidence Interval Estimates in this course are as follows:
– For the population mean based on large samples
– For the population mean based on small samples
– For the population mean based on large samples with σ unknown
– For the population mean based on small samples with σ unknown
– For the population proportion
39
40. A 100 (1 - α)% Confidence Interval
EsEmate for the PopulaEon Mean μ
• Let X ~ N(μ , σ) where σ is known. A single sample of size n
was drawn and the sample mean X is computed.
• On the basis of this sample mean we seek to find a
100(1 - α)% Confidence Interval Es#mate for μ.
• A 100( 1 – α)% interval es'mate for the popula'on mean μ
is given by:
X – Zα/2 σx ≤ μ ≤ X + Zα/2 σx
or
(X – Zα/2 σx , X + Zα/2 σx)
where Zα/2 is the standard score that cuts off a tail area of
α/2% in the Standard Normal Curve. 40
41. A 100( 1 – α)% Interval
Es2mate for the
Popula2on Mean μ
(μ – Zα/2 σx , μ + Zα/2 σx)
where Zα/2 is the
standard score
that cuts off a tail
area of
%
&
% in the
Standard Normal
Curve.
41
44. Example
• Find a 100( 1 – α)% Interval Estimate for the
Population mean μ using the following:
§ α = 5%
§ Sample mean = 52
§ σx= 4
CI = μ – Zα/2 σx to μ + Zα/2 σx
44
45. Example
• Find a 100( 1 – α)% Interval Es0mate for the
Popula0on mean μ using the following:
§ α = 5%
§ Sample mean = 52
§ σx= 4
CI = μ – Zα/2 σx to μ + Zα/2 σx
45
95% Confidence Interval=
μ – Zα/2 σx to μ + Zα/2 σx
52 – (1.96 x 4) to 52 + (1.96 x 4)
52 – 7.84 to 52 + 7.84
44.16 to 59.84
46. Example
• Find a 100( 1 – α)% Interval Es0mate for the
Popula0on mean μ using the following:
§ α = 5%
§ Sample mean = 52
§ σx= 4
CI = μ – Zα/2 σx to μ + Zα/2 σx
46
95% Confidence Interval=
μ – Zα/2 σx to μ + Zα/2 σx
52 – (1.96 x 4) to 52 + (1.96 x 4)
52 – 7.84 to 52 + 7.84
44.16 to 59.84
Find μ
Get Z from
tables (using
half of alpha)
Calculate σx
51. • Confidence level 99% or .99
• The sample size is large (n ≥ 30)
§ Therefore, we use the normal distribution
§ z = 2.58
§ Thus, we can state with 99% confidence that the current mean
annual cost to major U.S. banks of all individual checking
accounts is between $495.79 and $504.21
51
52. A 100 (1 - α)% Confidence Interval Estimate for the
Population Mean μ where σ is unknown
Let X ~ N(μ , σ) where σ is unknown. A single sample of
size n was drawn and the sample mean X was
computed. On the basis of this single sample mean, find
a 100(1 - α)% Confidence Interval EsMmate for μ.
• Here we subs4tute s for the unknown σ.
• However, it mamers whether n is large i.e. (n ≥ 30) or
small i.e. (n < 30)
– If n ≥ 30 the CLT allows us to use the Normal Distribu'on
N(μ , s/√n ) as the Sampling Distribu'on
– If n < 30 the CLT allows us to use the Student-t
Distribu'on with n – 1 df as the Sampling Distribu#on.
52
53. A 100 (1 - α)% Confidence Interval Estimate for the
Population Mean μ where σ is unknown and n ≥ 30
• A 100( 1 – α)% interval es.mate for the
popula.on mean μ when n ≥ 30 and σ is
unknown is given by
X – Zα/2 s/√n ≤ μ ≤ X+ Zα/2 s/√n
or
(X – Zα/2 s/√n, X+ Zα/2 s/√n)
• where Zα/2 comes from the Std Normal
Distribu.on and s is the sample standard
devia.on. 53
54. A 100 (1 - α)% Confidence Interval Estimate for the
Population Mean μ where σ is unknown and n ≤ 30
• A 100( 1 – α)% interval estimate for the
population mean μ when n < 30 and σ is
unknown is given by
X – tα/2 s/√n ≤ μ ≤ X + tα/2 s/√n
or
( X – tα/2 s/√n , X + tα/2 s/√n )
• where tα/2 comes from the Student-t Distribution
with (n – 1) degrees of freedom and s is the
sample standard deviation 54
60. 60
Find the values
of t for:
• 12 df and 0.025
area in the right
tail.
• 20 df and 0.01
area in the right
tail.
• 20 df and 0.05
area in the right
tail.
• 15 df and 0.005
area in the leA tail
• 22 df and 0.001
area in the leA
tail.
65. Class Exercise 1
• The standard deviation for a population is 14.8.
• A sample of 100 observations selected from this
population gave a mean of 143.72.
– Construct a 99% confidence interval for μ
– Construct a 95% confidence interval for μ.
– Construct a 90% confidence interval for μ.
– Does the width of the confidence intervals
constructed in parts a. to c. decrease as the
confidence level decreases? Explain.
65
66. Answer to Class Exercise 1
• 99% CI is (139.92 and 147.52)
• 95% CI is (140.82 and 146.62)
• 90% CI is (141.28 and 146.16)
• No0ce that the width of the Confidence
Interval decreases as the Confidence level
decreases.
• It makes sense right? Why?
66
67. Another Class Exercise
• A sample of 10 observa0ons taken from a
normally distributed popula0on produced the
following data:
44 52 31 48 46 39 47 36 41 57
a. What is the point es0mate of μ?
b. Construct a 95% confidence interval for μ.
67
68. A 100 (1 - α)% Confidence Interval Estimate for
the Population Proportion p.
• A 100( 1 – α)% interval es.mate for the popula.on
propor.on p is given by
p̂ – Zα/2 √(pq/n) ≤ p ≤ p̂ + Zα/2 √(pq/n)
or
(p̂ – Zα/2 √(pq/n) , p̂ + Zα/2 √(pq/n))
• where Zα/2 comes from the Std Normal Distribu.on.
68
69. IMPORTANT !!!
• Some versions of the on-line text say that
when popula0on standard devia0on is not
known, the t distribu0on should be used for
hypothesis tes0ng.
• In this course (and in prac0ce) we use the Z
tables for hypothesis tes0ng once the sample
size is large (at least over 30).
69
70. End of Lecture
• We have reviewed the Confidence Intervals
that form an integral part of the 5 stages of a
sta0s0cal analysis.
• Next we move on to another level of
inves0ga0on with respect to sample data.
• This involves Hypothesis tes0ng.
70